Spiral-Induced Star Formation in the Outer Disks of Galaxies
Abstract
The outer regions of galactic disks have received increased attention since ultraviolet observations with GALEX demonstrated that nearly 30% of galaxies have UV emission beyond their optical extents, indicating star formation activity. These galaxies have been termed extended UV (XUV) disks. Here, we address whether these observations contradict the gas surface density threshold for star formation inferred from radial profiles of galaxies. We run smoothed particle hydrodynamics simulations of isolated disk galaxies with fiducial star formation prescriptions and show that over-densities owing to the presence of spiral structure can induce star formation in extended gas disks. For direct comparison with observations, we use the 3-D radiative transfer code Sunrise to create simulated FUV and Ks-band images. We find that galaxies classified as Type I XUV disks are a natural consequence of spiral patterns, but we are unable to reproduce Type II XUV disks. We also compare our results to studies of the Kennicutt-Schmidt relation in outer disks.
Subject headings:
galaxies: spiral, galaxies: structure, galaxies: evolution, ultraviolet: galaxies1. Introduction
Star formation rate profiles derived from emission indicate that galaxies follow a “Kennicutt-Schmidt Law” where the star formation rate and gas surface densities averaged in azimuthal annuli are related by (Kennicutt, 1998b, 1989). However, sudden drops in intensity create strong departures at a gas surface density of 3-5 . This is generally interpreted as a threshold density for star formation (Kennicutt, 1989; Martin & Kennicutt, 2001). Several explanations for this threshold have been proposed, including a transition between dynamically unstable and stable regions of the galaxy (e.g. Toomre, 1964) or a phase transition of the gas (e.g. Elmegreen & Parravano, 1994; Schaye, 2004; Krumholz et al., 2009).
Outer disks have consequently been considered inhospitable environments for star formation despite the existence of knots at large radii (Kennicutt, 1989; Martin & Kennicutt, 2001; Ferguson et al., 1998). Interest in outer disks was rekindled by observations with the Galaxy Evolution Explorer (GALEX: Martin et al. (2005)) which revealed that % of disk galaxies have UV emitting sources beyond their optical disks (Thilker et al., 2007; Gil de Paz et al., 2005; Thilker et al., 2005; Zaritsky & Christlein, 2007). In the case of M83 and NGC 4625, UV knots have been identified as low mass stellar complexes and, if visible in the , are generally ionized by a single star (Gil de Paz et al., 2007). These knots are dynamically cold and rotating, indicating that outer disk complexes are extensions of the inner disk (Christlein & Zaritsky, 2008).
Thilker et al. (2007, hereafter T07) classified extended UV (XUV) disks into two types. In 2/3 of XUV disks, the UV emission is structured, lying in filamentary, spiral patterns (Type I XUV disks). In the other 1/3, a large zone in the outer regions of the galaxy is dominated by UV emission (Type II XUV disks).
The prevalence of star formation in outer disks raises new questions about the nature of star formation in diffuse environments. In particular, we address whether a threshold density to star formation is consistent with the observed emission. Boissier et al. (2007, hereafter B07) selected a sample of galaxies of large angular size, including XUV and non-XUV disks, and studied their extinction corrected UV and gas profiles. While the uncertainties are large, B07 do not find a departure from the Kennicutt-Schmidt relation at low gas density. They suggest that the high mass end of the stellar initial mass function (IMF) is not sampled in every stellar cluster at the low star formation rates observed and emitting stars are not formed in all star forming complexes. They argue that this is responsible for the difference in the UV and profiles and the Kennicutt-Schmidt law is followed to low surface density.
Pflamm-Altenburg & Kroupa (2008) propose instead that the Kennicutt-Schmidt law is obeyed below the traditional threshold density but that high mass stars capable of emitting in the simply do not form at low gas densities. This is supported by a deficiency of H emission in dwarf galaxies that cannot be explained by IMF sampling effects (Lee et al., 2009). Roškar et al. (2008a) note that stars migrate radially from their formation sites in the disk, which can modify the stellar populations of outer disks. However, it is not clear that this process is efficient enough to relocate UV emitting stars to 2-3 (Roškar et al., 2008b, a).
Alternatively, at some sites the gas density may exceed a star formation threshold locally, allowing stars to form beyond the radius where the azimuthally averaged gas density is at or below a threshold density (Kennicutt, 1989; Martin & Kennicutt, 2001; Schaye, 2004; Elmegreen & Hunter, 2006; Gil de Paz et al., 2007). Outer disk stellar complexes are often coincident with local H I over-densities (Ferguson et al., 1998, T07), supporting this interpretation. XUV disks are gas rich for their star formation rates, indicating that a high fraction of their gas is not undergoing star formation (T07). Studies of UV selected sources in the XUV disk of M 83 indicate that star formation occurs only above a critical gas density defined by the Toomre criterion for dynamical instability (Dong et al., 2008) and, where it occurs, follows a Kennicutt-Schmidt law.
This theory has been explored by Elmegreen & Hunter (2006). In their model, gas clumping triggered by spiral density waves, radial variations in the interstellar medium (ISM) turbulence, and gas phase transitions lead to localized regions of active star formation in extended gas disks. They implement a Kennicutt-Schmidt law and a radially varying threshold density based on the Toomre criterion (Elmegreen & Hunter, 2006). These processes enable star formation to extend into the outer disk. In Bush et al. (2008), we used smoothed particle hydrodynamic (SPH) simulations of an isolated disk galaxy with an extended gas disk of initially constant surface density to explore the morphology resulting from such in situ outer disk star formation. We showed that spiral structure can propagate from the inner disk to the extended gas disk, producing regions of locally enhanced gas density and triggering star formation in filaments similar to those observed in Type I XUV disks. However, this study was restricted to one galaxy model, limiting our ability to draw general conclusions.
In this paper, we expand on the work of Bush et al. (2008) by varying the structure of the simulated galaxy, in particular the gas profile and the disk to halo mass ratio, to explore the amount and morphology of outer disk star formation that result naturally without altering traditional star formation laws. In addition, we produce simulated images to directly compare UV and Ks emitting populations to observations. This allows us to classify our models as normal, Type I or II XUV disks. We also compare our results to studies of the Kennicutt-Schmidt law, radially and locally. While we test whether the UV and Ks emission of XUV disks can be reproduced using traditional star formation laws, we do not create H images and therefore do not address the discrepancy between H and UV radial profiles. In §2 we describe our models, in §3 we describe the evolution and uncertainties in one model in detail, in §4 we describe the full set of models and how they compare to observations and finally in §5 and §6 we discuss our results. Our models succeed in producing the UV morphologies of Type I XUV disks. However, they do not reproduce the UV bright outskirts of Type II XUV disks.
2. Method
2.1. SPH Simulations
We use the code Gadget2 (Springel, 2005), based on the fully conservative formulation of SPH developed by Springel & Hernquist (2002) to run simulations of galaxies with extended gas disks. We incorporate a sub-resolution multi-phase model of the ISM and star formation according to Springel & Hernquist (2003, hereafter SH03), which includes radiative cooling as in Katz et al. (1996) and Davé et al. (1999). Star formation from the cold phase gas (total cold gas, our simulation does not treat atomic and molecular gas separately) follows a Schmidt volume density law with and normalized to a star formation timescale ().
We run simulations with two different star formation timescales to explore how affects the XUV emission. One set of simulations adopts the values proposed in SH03: Gyr, , and , where and are parameters that regulate the mass fraction in the cold phase of the ISM. This normalizes the star formation rate to the best-fit relation found in Kennicutt (1998b). The second set of simulations are run with parameters which normalize the star formation rate roughly to that of the Milky Way (MW), since these are MW like models: Gyr, , and . This results in lower levels of star formation for a given gas density. The local star formation volume density cutoff corresponds to M⊙/pc3 for both sets of parameters. In all cases, star formation rates lie well within the scatter shown in Kennicutt (1998b) and the surface density threshold falls between 3-5 M⊙/pc2, consistent with observations (Kennicutt, 1989; Martin & Kennicutt, 2001). The effective equation of state for the star-forming gas is determined from these parameters through the pressurizing action of supernova feedback, allowing us to stably evolve disks with even very large gas fractions (Springel & Hernquist, 2005).
2.2. SPH Initial Conditions
Our galaxy models are constructed using the procedure outlined in Springel et al. (2005). We construct analogs to the Milky Way with a total mass of M⊙ composed of a Hernquist (1990) dark matter halo with concentration , an exponential stellar disk with scale length 3.75 kpc (we adopt the Hubble parameter throughout this paper), and an exponential gas disk of the same scale length. We then add an extended gas disk either of approximately constant density or following an Mestel (1963) radial profile that starts at a “break radius” of 3.5 scale lengths ( kpc) and extends to 8.7 scale lengths ( 32 kpc). We also create a control model with no extension (pure exponential profile). We then normalize with each of these outer disk profiles (pure exponential, flat, and Mestel) to have a gas surface density of 3, 5 and 10 at the break radius, spanning the range of outer disk profiles seen in the THINGS (Walter et al., 2008) and Broeils & van Woerden (1994) surveys. Table 1 summarizes these properties and lists a run-name for each model. We do not simulate a galaxy with a high mass constant density extension because nearly constant density disks are not found at those densities. The gas content and distribution agree roughly with the and trends seen in Broeils & Rhee (1997). The flat-low model is very similar to the model shown in Bush et al. (2008).
The ratio of the mass of the inner gas disk to the mass of the inner stellar disk is fixed at 1:5, meaning the overall stellar disk mass is increased when the gas surface density is increased. The halo mass is also increased accordingly to keep the halo to disk mass ratio at constant at 0.041. Varying the halo to disk mass ratio changes the spiral structure amplitude, which we do in § 5.1. A stellar Hernquist (1990) bulge with a scale length of 0.27 kpc is added with 0.008 of the total mass of the simulation, making it % the mass of the stellar disk. Particle numbers are varied for each model to keep the mass per particle constant. The mass per particle in the stellar and gas disks is and in the halo is . The Gadget softening length of the baryonic particles and halo particles are 0.14 kpc and 0.28 kpc, respectively. The models each have a 0.01 mass black hole in its center. The black hole is represented by a sink particle that can accrete mass at the Bondi rate (Springel et al., 2005; Di Matteo et al., 2005), but as we are interested in the outer disk its presence does not influence our results.
| run name | gas profile shape | surface density at break radius for | ||
|---|---|---|---|---|
| gas | stars | |||
| exp-low | exponential | 3 | 12 | |
| exp-mid | exponential | 5 | 20 | |
| exp-high | exponential | 10 | 40 | |
| Mestel-low | Mestel | 3 | 12 | |
| Mestel-med | Mestel | 5 | 20 | |
| Mestel-high | Mestel | 10 | 40 | |
| flat-low | flat | 3 | 12 | |
| flat-mid | flat | 5 | 20 | |
2.3. Radiative Transfer
To create simulated FUV and Ks-band images, we employ the 3D adaptive grid polychromatic Monte Carlo radiative transfer code Sunrise111Sunrise is a free, publicly available software that can be applied to any hydrodynamic galaxy simulation. http://sunrise.familjenjonsson.org. (Jonsson, 2006; Jonsson et al., 2009). Sunrise assigns a spectrum to each particle in our simulations that would be a source of radiation (stellar and black hole particles) and then propagates photon “packets” from these sources through the dusty ISM, represented by the gas particles, using a Monte Carlo approach. The black hole particle emits an empirical template AGN spectrum derived from observations of quasars (Hopkins et al., 2007) but since we are examining the outer disk, and this is a small black hole with almost negligible accretion, this has negligible impact on our results.
Each stellar particle over 10 Myr old is given a spectrum corresponding to its age and metallicity from Starburst 99 (Leitherer et al., 1999) population synthesis models. We assume a Kroupa IMF (Kroupa et al., 1993). Star particles that existed at the beginning of the simulation are assigned an age from a distribution that is determined by a star formation history chosen to match observations of local disks (see Rocha et al. (2008) for more details). The disk was assigned an exponentially increasing star formation rate with a timescale of 106 Gyr (which makes the star formation rate effectively constant) with the oldest stars being 13.9 Gyr old. The bulge was assumed to form in an instantaneous burst with an age of 13.9 Gyr. Since these parameters are not given any radial gradient, and the number of stars in the outer disk is low, they only slightly affect our results.
Star clusters with ages less than 10 Myr are assumed to be located in their nascent birth-clouds of molecular gas and are given a modified spectrum which accounts for the effects of H II and photo-dissociation regions (PDRs). The evolution of H II regions and PDRs are described analytically and the photo-ionization code MAPPINGS III (Groves et al., 2004) is used to calculate the propagation of the source spectrum through this nebula (Groves et al., 2008). The H II region absorbs effectively all ionizing radiation and is the source of hydrogen recombination lines. A fraction (=.3) of the solid angle into which the star particle is emitting is assumed to be obscured by the PDR, which absorbs a significant fraction of the UV emission of the stellar particle and reprocesses it into the FIR. The remaining solid angles are not influenced by the PDR, and the final result is a linear combination of the PDR of obscured and unobscured regions weighted by . Owing to the low star formation rates in the outer disk, very few particles in the outer disk are less than 10 Myr old. Thus emission from stars unaffected by PDRs dominates the FUV and the results here are very insensitive to .

The source spectra, as described above, are then propagated as photon ’packets’ through the ISM represented by gas particles. Gas and star particles are initialized with an exponentially decreasing metallicity distribution with a central value of and a value of at the break radius to approximately match the outer disk metallicities of M 83 (Bresolin et al., 2009). The distribution is shown in Figure 1 and additional metals are added as the simulation progresses as described in SH03. We assume a dust to metals mass ratio of 0.4 (Dwek, 1998) and use the dust models of Weingartner & Draine (2001), updated according to Draine & Li (2007). For details on the photon propagation, see Jonsson (2006). The final spectra are comprised of source photons that escape absorption and scattering, supplemented by photons re-emitted in the infrared from the dust and photons scattered into the line of sight. Finally, the viewing angle and bandpass are considered to calculate broadband images. Since we examine only FUV and Ks-band images in this paper, dust emission is unimportant. We only examine face-on images in this work. Highly inclined models would have more obscuration along the line of sight and show less UV emission.
3. A Case Study
3.1. Evolution
In Bush et al. (2008) we demonstrated that spiral over-densities in the inner disk of a galaxy can propagate to the edge of an extended constant density gas disk. In the outer disk of that model, peaks in the spiral waves above the density threshold form stars while troughs below the density threshold do not. This yields filamentary star formation in the outer disk, as seen in Type I XUV disks (T07). A study of the model’s observable properties using radiative transfer was beyond the scope of that work. However, the model presented there is very similar to our flat-low model. To provide a context for the analysis of the entire sample of simulations, we first study the results of applying radiative transfer to the flat-low model and the time evolution of this model’s properties.
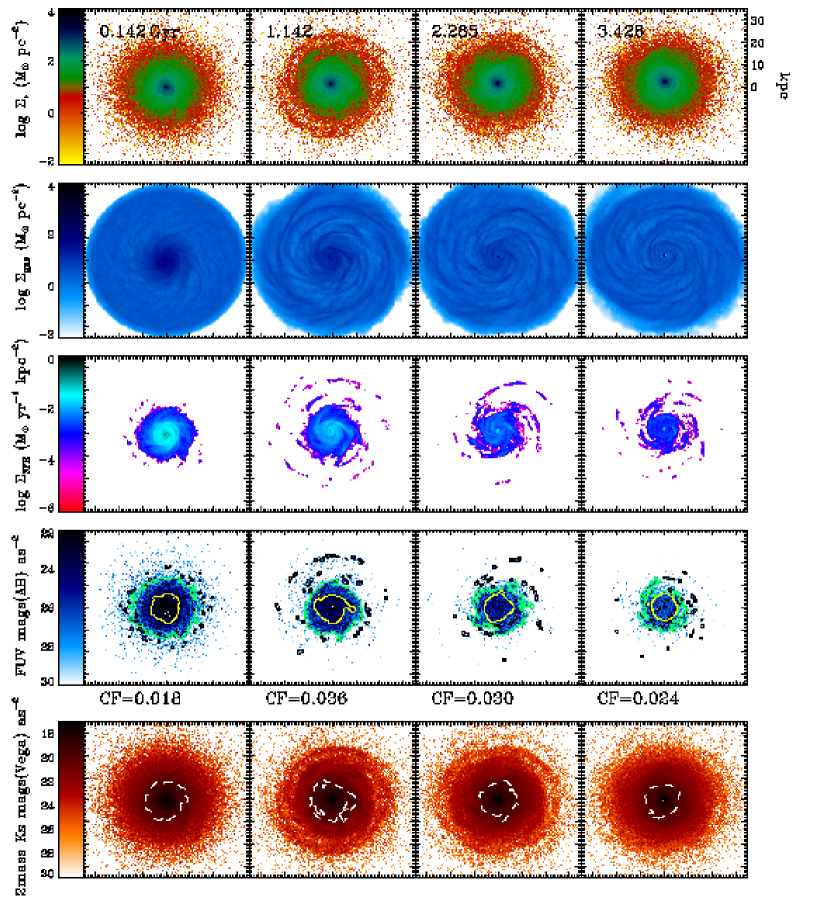
Four snapshots from the 4 Gyr evolution of flat-low are shown in Figure 2. The first three rows of Figure 2 map stellar surface density, gas surface density, and instantaneous star formation rate surface density (top-bottom). The star formation rate, and therefore also the UV emission, is determined by the gas distribution. Early in the simulation, ring-like perturbations in gas density propagate outwards from the center. These relax with time into steady spiral features caused by potential fluctuations in the halo (Hernquist, 1993). For a discussion of how these spiral features compare to observed spiral features in galaxies, see § 5.1. This results in rings of star formation in the outer disk early on, relaxing to spiral features around 2 Gyr. Late in the simulation, the inner regions deplete as gas is converted into stars, leading to inner holes in the gas distribution and, eventually, also in the distribution of star formation. The star formation rates in the outer disk are low enough that they do not significantly deplete the outer disk (see § 5.4), so the morphology of star formation in the outer disk changes very little from 2 Gyr to the end of the simulation.
To classify disks according to their outer disk star formation, T07 analyze the FUV and 2MASS Ks-band images of 189 galaxies in the GALEX Atlas of Nearby Galaxies (Gil de Paz et al., 2007) and define two types of XUV disks. FUV emission traces star formation over 200 Myr, not instantaneous star formation, so in order to accurately compare our simulations to T07 we created FUV and Ks-band images with Sunrise. FUV and Ks-band images are shown in the fourth and fifth rows of Figure 2. The FUV emission partially traces the instantaneous star formation rate, but also stretches the features out in time as older stars continue to emit in the UV. The Ks-band traces the complete stellar population, resulting in images very similar to the stellar surface density maps.
T07 define a Type I XUV disk to be a galaxy that has at least two complexes of structured FUV emission beyond an FUV contour of 27.25 AB magnitudes arcsec-2 at 1 kpc resolution that are unaccompanied by emission in the Ks or DSS red bands. To analyze our simulations when the gas distribution is comparable to observed spiral galaxies, we choose snapshots after the spiral structure has become steady, but before the inner gas is depleted, near the 2.285 Gyr snapshot shown. At this time, knots of FUV emission trace spiral arms in the outer disk. The features brighter than 27.25 AB mags arcsec-2 are highlighted with a thin black contour in Figure 2. The surface brightness of the outer disk in the Ks is very low. The approximate surface brightness limit of 2MASS is 20 magnitudes arcsec-2, shown as the white dashed line in Figure 2 (Jarrett et al., 2003). Most of the emission in the outer disk is below the detection limit for 2MASS. The outer disk shows more than one knot of UV emission without accompanying Ks-band emission, this model most likely fits the criterion for Type I XUV disks. We do not simulate the DSS red band, but expect the results to be similar.
T07 define Type II XUV disks based on the properties of a low surface brightness (LSB) zone in the outer disks of galaxies. They define the LSB zone as emission beyond 80% of the Ks-band flux, and interior to the innermost 27.25 FUV AB magnitudes arcsec-2 contour. The 80% Ks-band flux contour for our model (80 % of the flux above the 20 magnitudes arcsec-2 surface brightness limit) is shown in Figure 2 in yellow. The innermost continuous 27.25 FUV mag arcsec-2 contour is highlighted in green on the same figure. The LSB zone of our simulations is then the area between the yellow and green contours. T07 use the color and area of the LSB zone to define Type II XUV disks as disks whose outskirts are very bright in the FUV, but low surface brightness in the Ks-band. Their empirical definition of these objects is those whose LSB zones have an FUVKs color of less than 4, and whose LSB zones are at least 7 times the area of the inner disk, defined by the 80% Ks-band contour.
For this model, at 2.285 Gyr, the LSB zone color is 3.6, but the LSB zone size ratio is 2.1. Consequently, flat-low does not qualify as a Type II disk at this time. In fact, these values are similar to those sees in Type I XUV disks and normal disk galaxies (see § 4.1). Because star formation in the outer disk is very filamentary, the continuous FUV contour, even at 1 kpc resolution, actually traces the edge of the inner disk. Therefore, the LSB zone is actually quantifying the properties of the edge of the inner disk, not the properties of the extended outer disk, so we would expect its properties to agree with those of normal galaxies.
Since the LSB zone does not measure extended filamentary emission, we introduce a covering fraction of FUV emission to quantify the amount of outer disk emission. We define the covering fraction as the fraction of pixels beyond the ’FUV inner disk’ that are brighter than 27.25 FUV AB magnitudes arcsec-2 when the image is smoothed to 1 kpc resolution. We define the FUV inner disk to end where the average FUV surface brightness is 27.25 FUV AB magnitudes arcsec-2 and calculate the covering fraction between this radius and twice this radius. The values are listed below the FUV images. These will be discussed further in § 4.
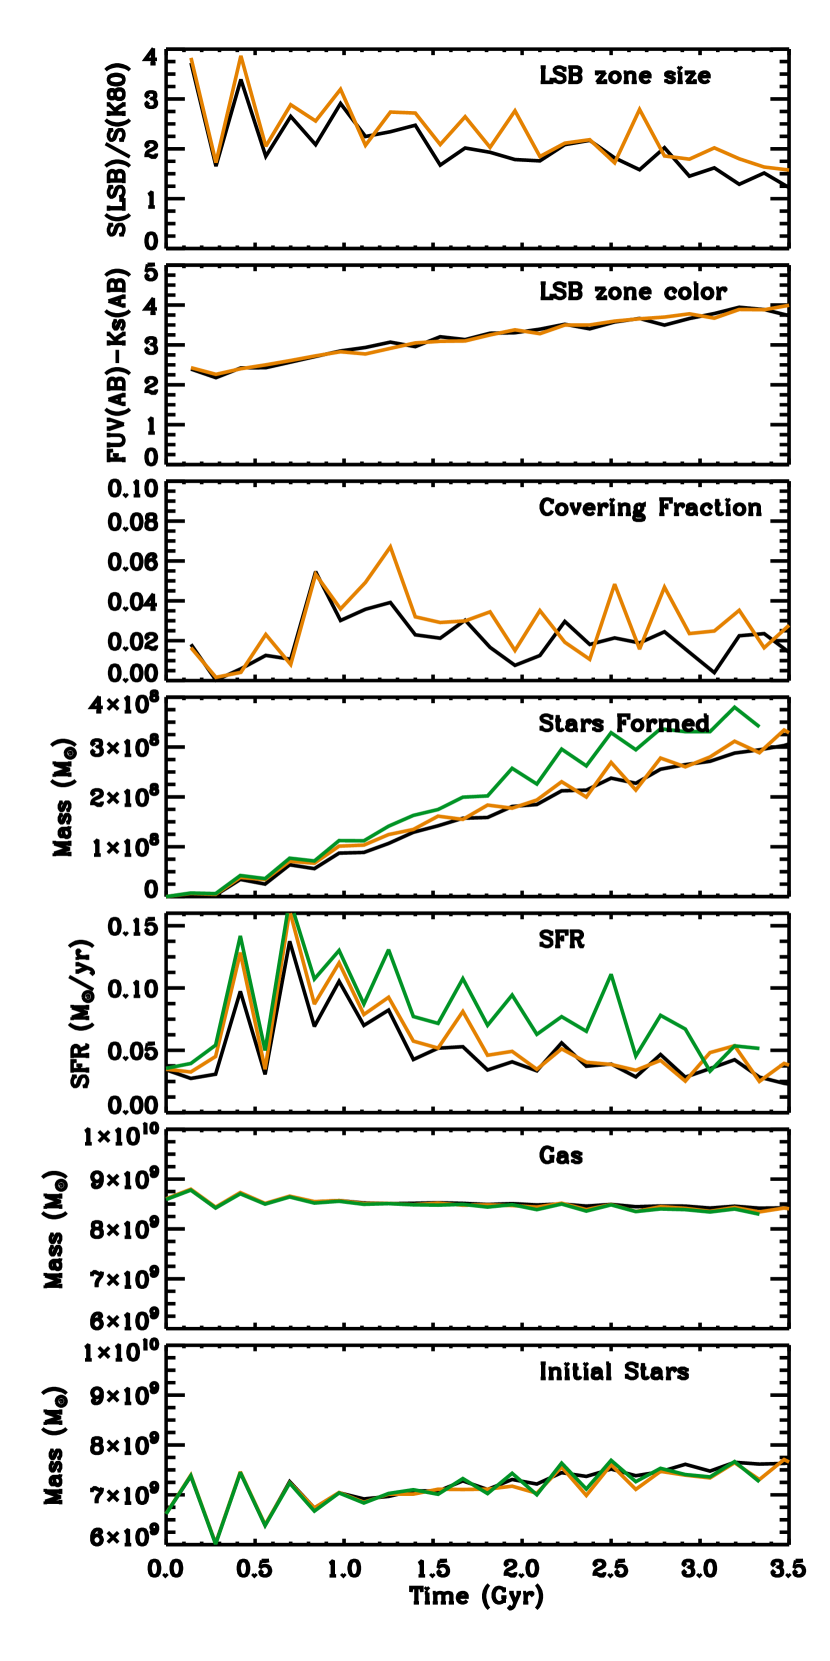
To explore how the evolution of the disk affects these classifications, we examine the properties of the outer disk with time. We take the outer disk to start at a radius where the star formation rate surface density falls below 3 10-4 kpc-2 yr-1, the 27.25 FUV contour in star formation rate using the calibration in Kennicutt (1998a), when the simulation is initialized. The mass of stars initially in the simulation, gas mass, star formation rate and mass of stars formed in the simulation are summed beyond this radius every 0.14 Gyr and presented as a function of time in Figure 3. For the first 1.5 Gyr, as the simulation relaxes, strong oscillations are seen in these quantities as density perturbations shift slightly inside or outside the boundary between the inner and outer disk. After these relax, most quantities evolve smoothly with time. The mass of old stars in the outer disk increases slowly over time. This most likely owes to stellar migration, a phenomenon caused by resonant scattering from spiral arms (Roškar et al., 2008a). The gas mass decreases slowly with time as it is converted into stars. The mass of stars formed increases correspondingly. The star formation rate is high initially owing to the strong perturbations in gas density as the disk relaxes, but then slowly decreases as gas depletes. As the stellar mass of the disk builds and the star formation rate drops, the color of the LSB zone reddens and the size shrinks. Since Type II XUV disks have large, blue LSB zones, this means that this disk evolves away from being a Type II XUV disk over time. This hints that recent gas accretion, creating in effect an un-evolved outer disk, may be important in producing Type II XUV disks. The covering fraction of FUV emission in the outer disk is also high initially but settles at around 0.02 after 2 Gyr. It is noisier than many of the other quantities, but evolves less with time.
To confirm that these simulations are indeed relaxed after 2 Gyr, we created new initial conditions for the flat-low model by pre-running the simulation without any star formation or gas cooling for over 4 Gyr. We then turned star formation and cooling on and the simulation was analyzed identically to the original. After 2 Gyr, the results are consistent with the original run.
3.2. Dependence on Disk Resolution
The three observational quantities (covering fraction, LSB zone color and LSB zone size) are evaluated over an area that depends on the emission properties of the disk. If the area covered by star forming particles changed significantly with resolution, these quantities may be resolution dependent. The covering fraction, with its dependence on the knots of star formation in the outer disk, is particularly susceptible. To determine whether these quantities depend on resolution, we ran simulations with twice and ten times the number of particles in the gas, stars and bulge of the galaxy. In these simulations, more gas particles of lower mass, form stars at each time step. The results for the double resolution run are over-plotted in Figure 3 in orange. The observable quantities do not change more than the scatter in the original simulation. Although the simulation with ten times the resolution simulation was too large to be processed by Sunrise, we have over-plotted the stellar mass, gas mass and star formation rates of the outer disk in Figure 3 in green. Note that at this resolution, the star formation rate increases. The simulation is now tracing smaller, but higher density peaks in the gas density distribution. We note that this means our results are lower limits on the star formation rate, and most likely the covering fraction, of outer disks. However, the qualitative results described in § 4 are unaffected.
3.3. Dependence on Metallicity
The metallicity of the stars in our simulation affects the template SED chosen for them, and the metallicity of the gas affects the amount of obscuration in the radiative transfer calculations. It is therefore important to consider how the metallicity distribution we select affects our results. The metallicity used by Sunrise comes from two sources. The first is the distribution of metals present when the simulation is initialized. Our initial distribution is shown in Figure 1. The second is metal enrichment owing to supernova feedback. As stars form in the simulation, gas particles are treated as a closed box system, and metals are instantaneously returned to the gas. The new stellar particle is given the metallicity of the gas particle from which it formed. Over time, the metallicity of the gas and stars increases. This evolution is shown for the flat-low simulation in Figure 4.
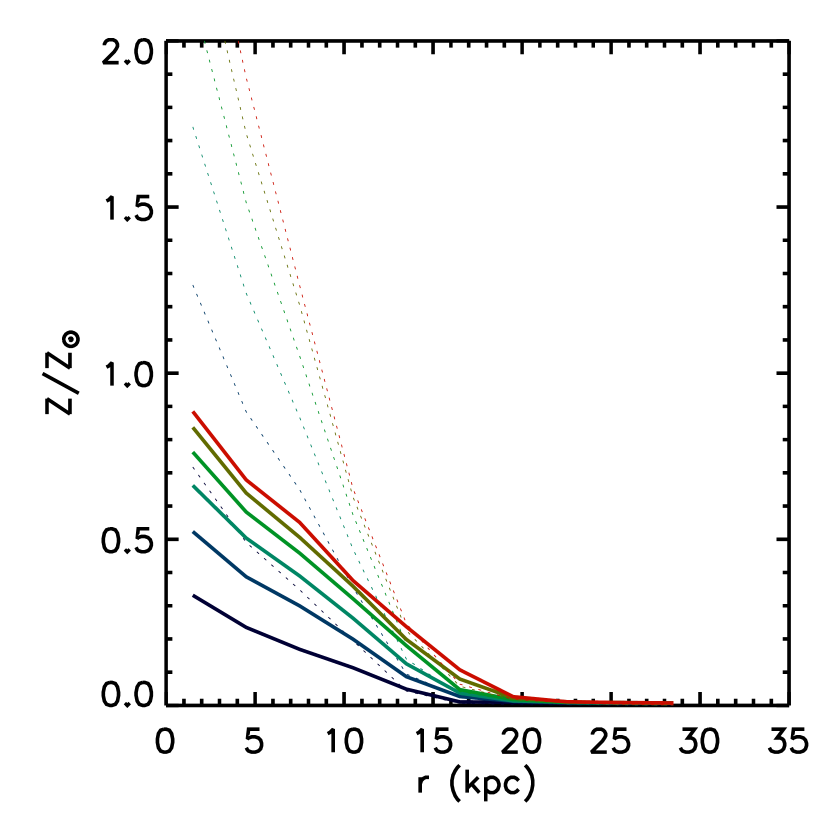
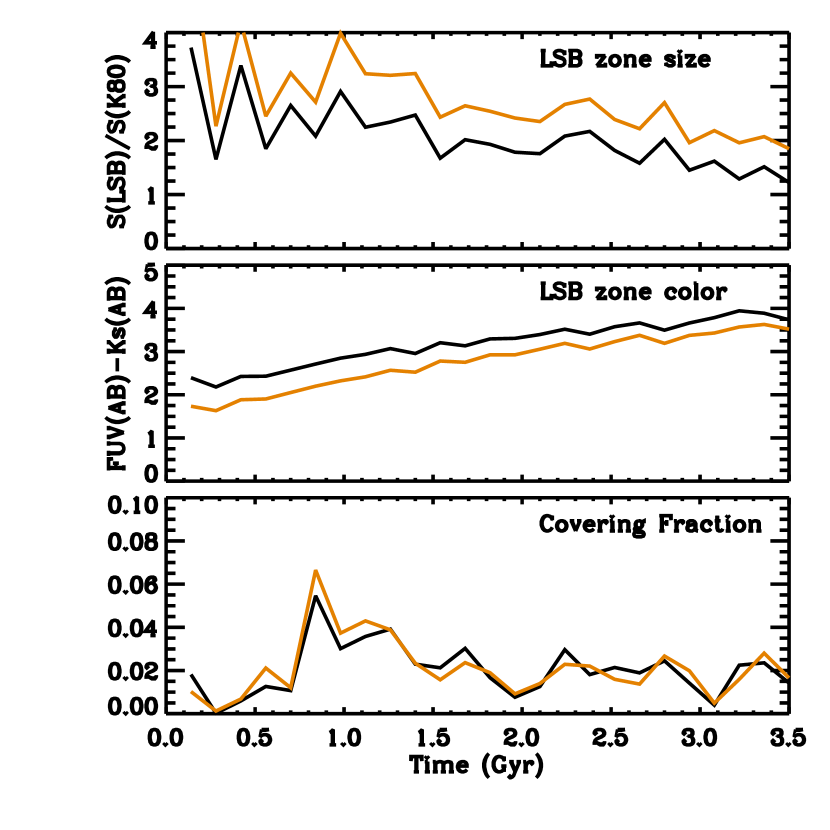
Very little is known about the metallicity of outer disks. Observations have found gas metallicities anywhere from (Bresolin et al., 2009; Gil de Paz et al., 2007). At 2.2 Gyr, the metallicity of the new stars (the dominant source of UV emission) at the break radius in our simulation is from supernova feedback and from the initial conditions, which gives overall. This is reasonable, but could also be too high. To test how much our results depend on metallicity, we re-ran the Sunrise radiative transfer on flat-low with no initial metal content. In this case, the entire metal contribution comes from supernova feedback. Clearly this is a limiting case, since it also assumes that the initial simulation stars have no metal content. The results are shown in Figure 5. The black line is the flat-low simulation and the orange line shows the results of the radiative transfer with no initial metal content. As we would expect, the LSB zone color is noticeably bluer throughout the simulation, owing to the lower metallicity of the FUV emitting stars. The LSB zone size increases owing to an increase in FUV emission and a slight decrease in Ks-band emission, both resulting from the lower metallicity of the initial and new stars. Interestingly, the covering fraction changes very little. This indicates that the change in metallicity does not increase the brightness of knots enough for a larger number to exceed the 27.25 FUV contour.
While these effects are not large enough to change the conclusions we discuss, there is some uncertainty about the exact color and sizes of the LSB zone owing to the lack of constraints on the metallicities of outer disks.
4. Set of Models and Comparison to Observations
After the detailed examination of the flat-low model, we now study and classify the other models in Table 1. Spiral structure propagates from the inner to the outer disk in all of our simulations. The amount of outer disk star formation is then controlled by the amount of gas in the outer disk that is above the threshold at any given time, which depends on the density perturbations owing to the spiral structure and the radial distribution of the gas. Immediately below, we focus on the radial gas distribution, but we consider variations in the spiral structure in § 5.1.
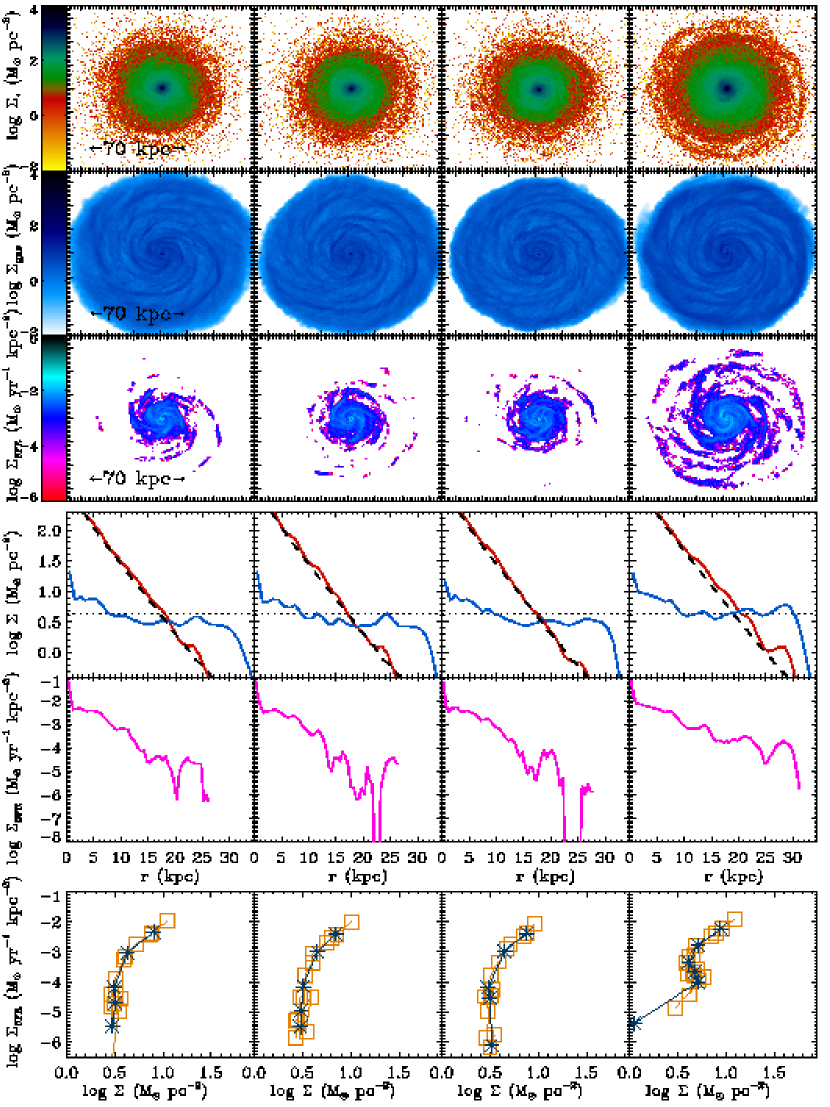
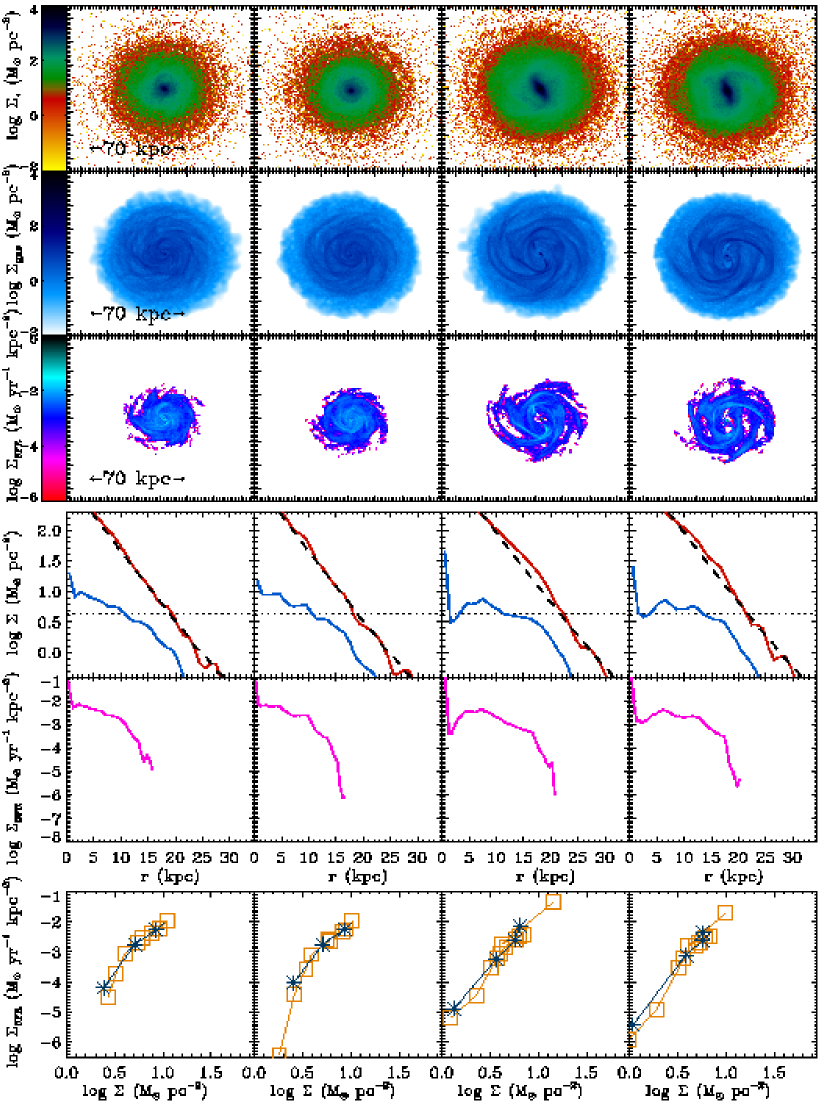
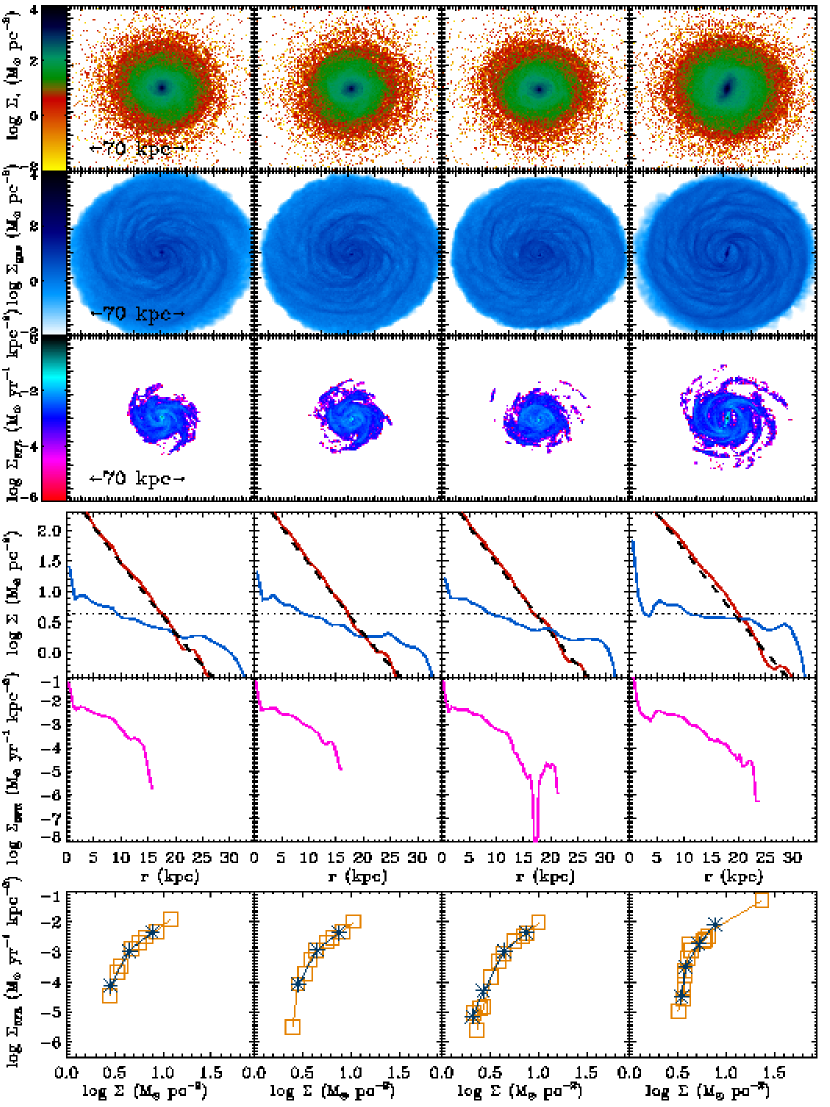
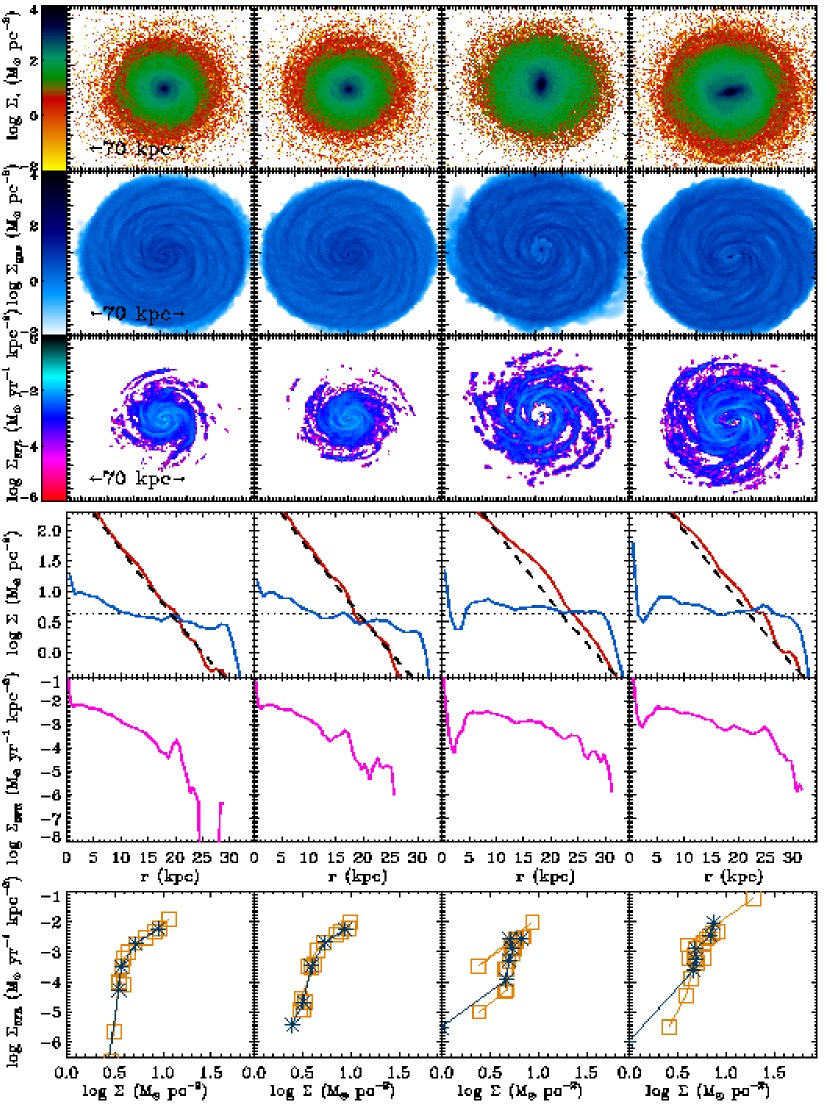
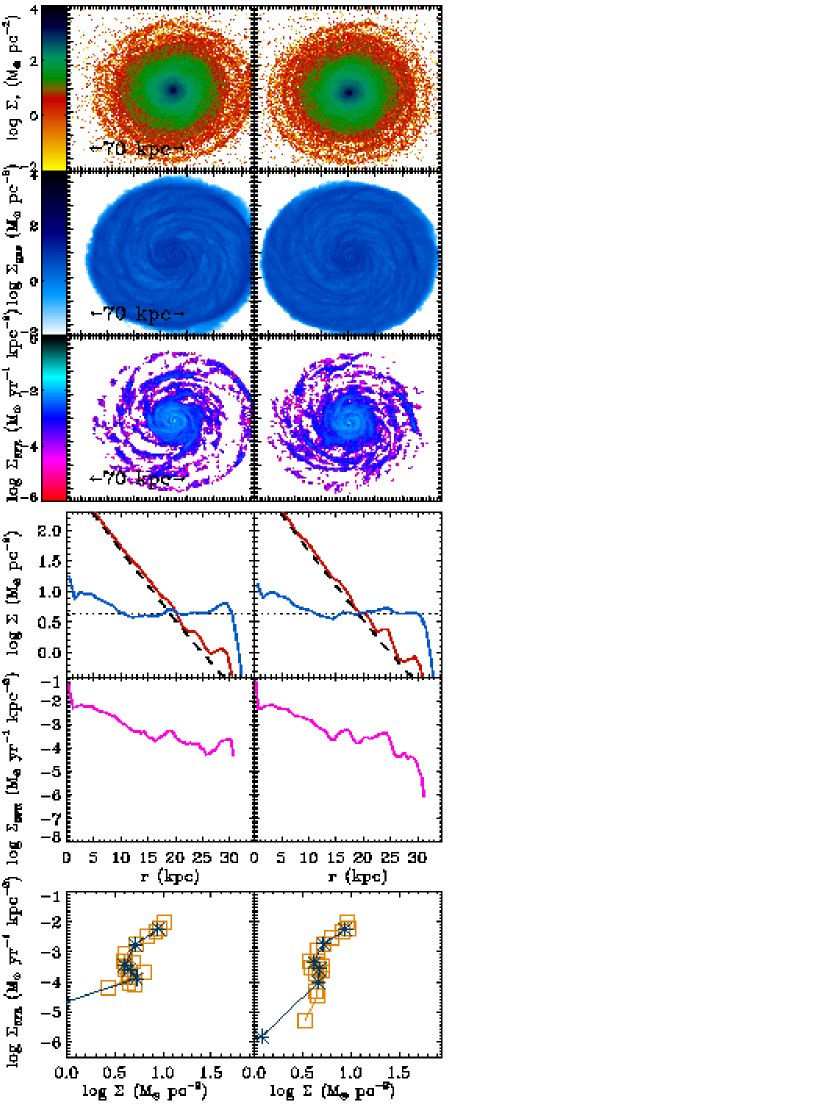
Maps of stellar surface density, gas surface density, and instantaneous star formation rate, along with gas, stellar, and star formation rate density profiles at 2.2 Gyr for each simulation are provided in Appendix A. The time evolution of each model is similar to that seen for the flat-low model. In the following sections, we compare our models to several observations star formation in outer disks.
4.1. Comparison to Thilker et al. 2007
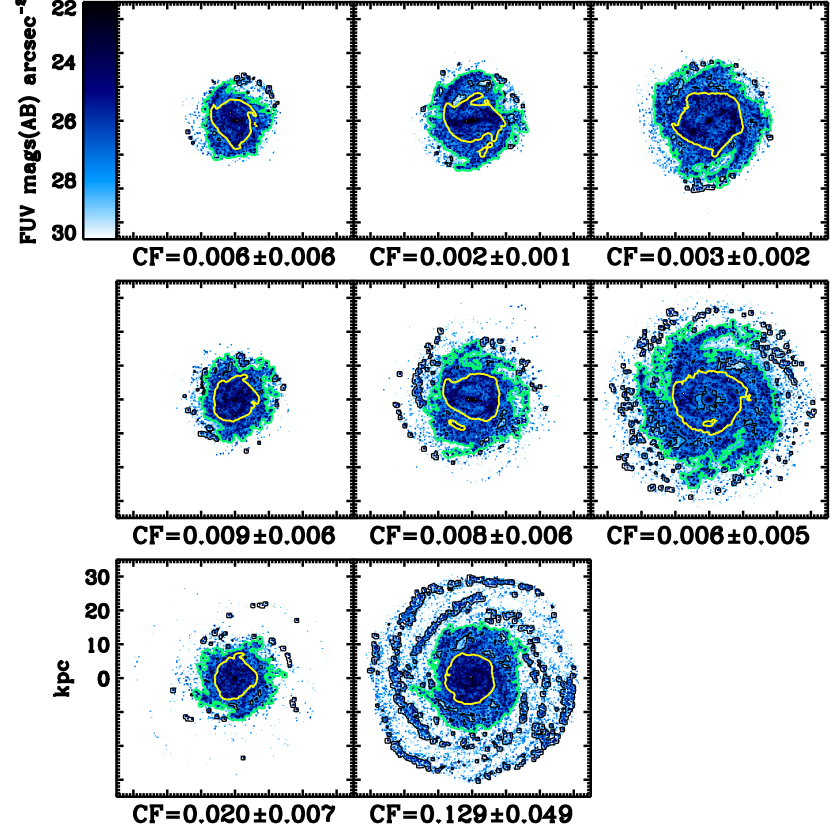
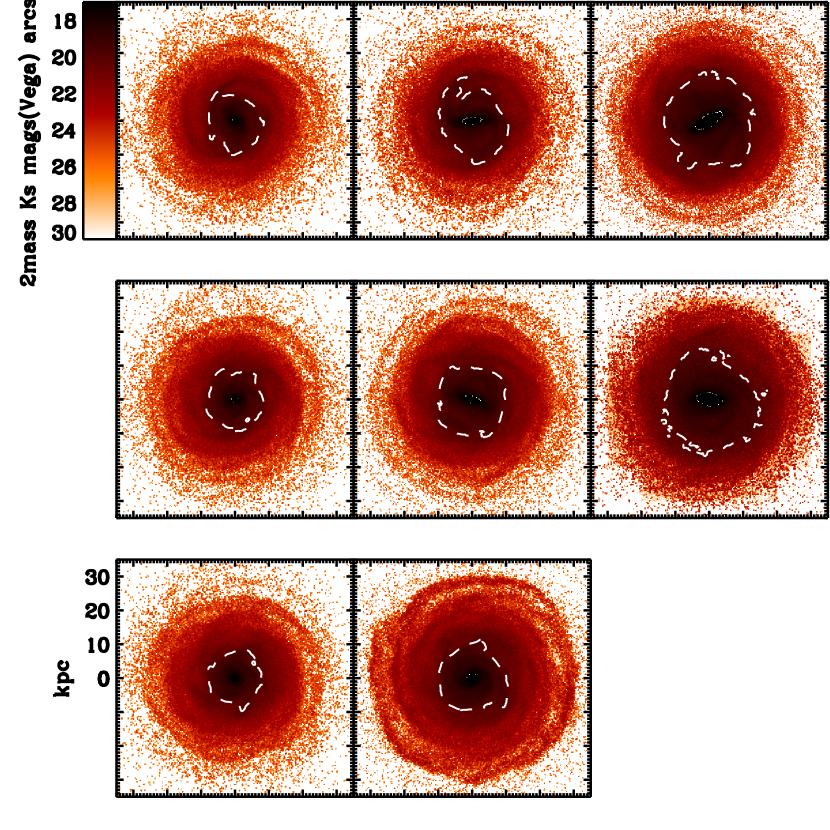
One snapshot from each simulation described in § 2.2 is shown in Figure 6. The thin black contour in these images is at 27.25 AB magnitudes arcsec-2, and the green line highlights the innermost continuous contour, as in Figure 2. Clumps beyond this green line contribute to the Type I XUV disk classification. All disks show a few clumps beyond this contour, but how fast the gas distribution falls off with radius controls the radial extent of the FUV complexes. Disks with slowly varying gas distributions have clumps of FUV emission at larger radii. The flat-low, flat-mid, Mestel-mid, and Mestel-high models all show significant numbers of FUV knots in filamentary structures extending off the disk. None of the purely exponential gas disks show more than a small ’fringe’ of XUV emission because of their rapid decrease in surface density with radius. The corresponding Ks-band images are shown in Figure 7. The surface brightness limits seen in Figure 7 (white dashed contour) are at smaller radius than most of the FUV knots seen in Figure 6, so the flat-low, flat-mid, Mestel-mid, and Mestel-high models would most likely be classified as Type I XUV disks.
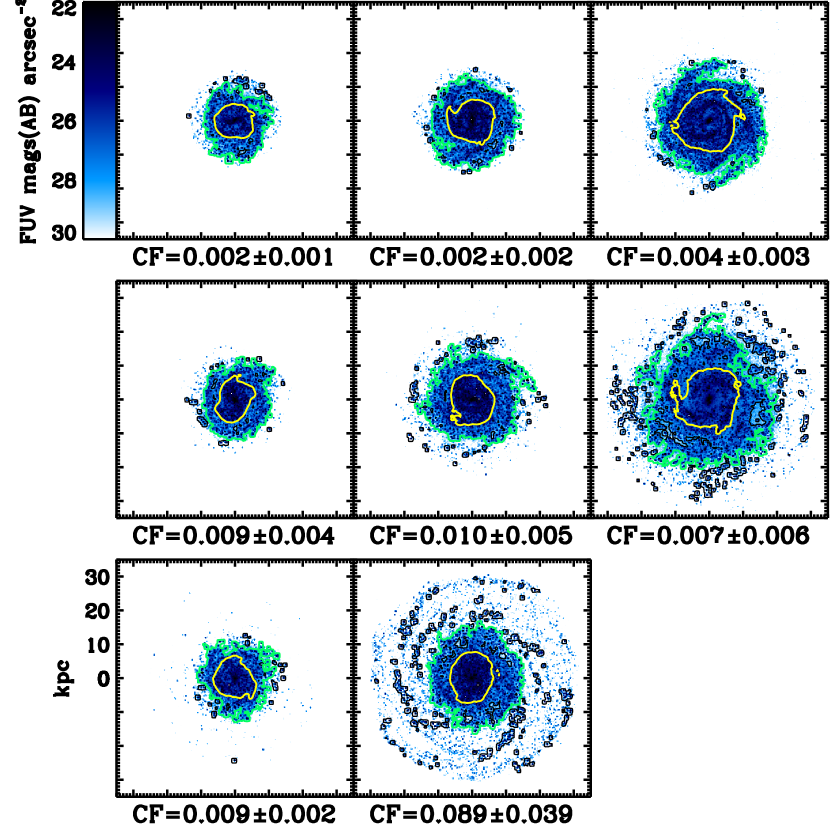
To determine how robust these results are to the star formation rate prescription we increased the star formation timescale of the gas by a factor of 3. Shown in Figure 8, when is increased, the overall amount of star formation is reduced, but its distribution is largely unchanged. However, the flat-low model and Mestel-mid model simulation may not be classified as XUV disks, depending on the snapshot analyzed, because they have very few knots of emission brighter than the 27.25 FUV contour.
Based on these simulations we expect higher surface density gas disks whose outer gas profiles do not fall off exponentially to be classified as Type I XUV disks. Studies of H I distributions indicate that non-exponential gas profiles are common in the outer parts of galaxies (Broeils & Rhee, 1997; Broeils & van Woerden, 1994). It should be noted that we only tested exponential disks with the same scale length as the stellar disk, in this case, 3.75 kpc. As the scale length of the gas disk increases and falls off more slowly it will be more likely to be classified as an XUV disk.
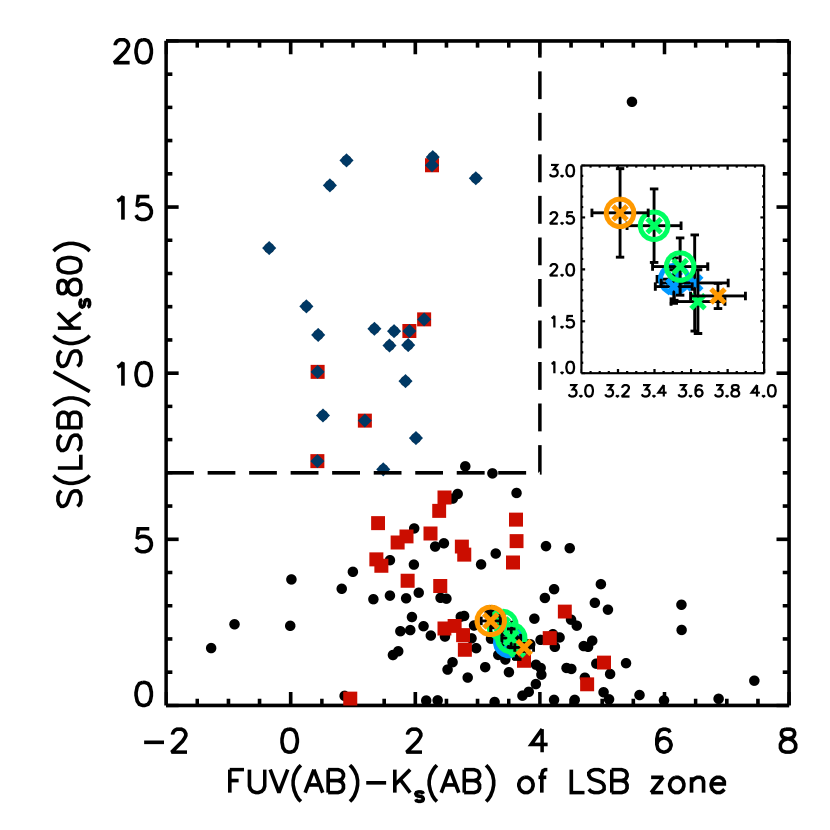
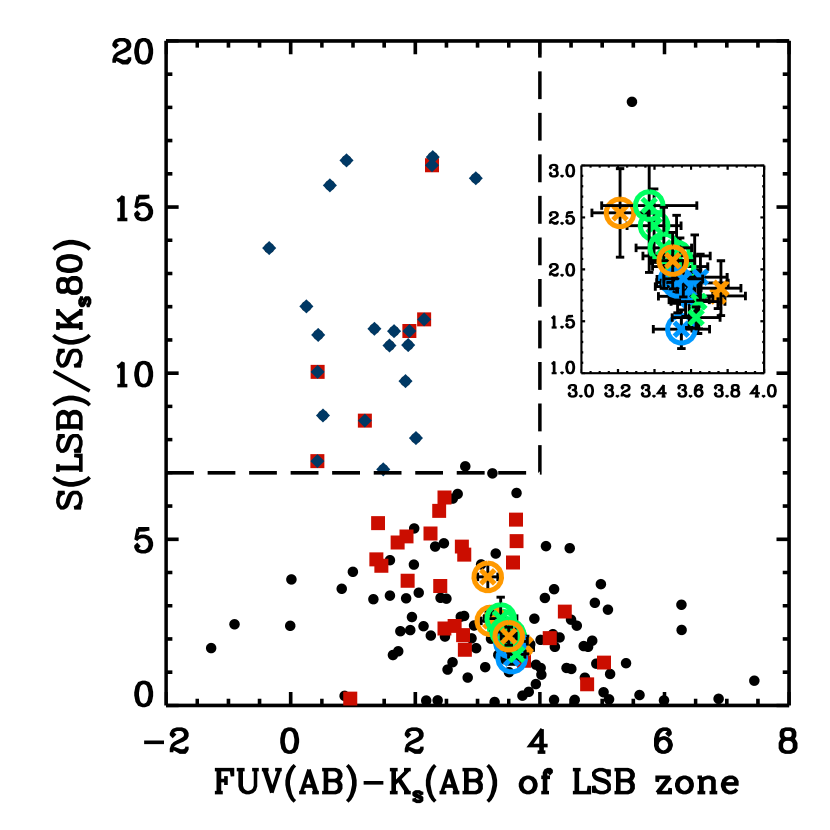
To determine whether any of the models would be classified as a Type II disk, we evaluate the color and area of the low surface brightness (LSB) zone defined by T07. As described in § 3.1, T07 define the LSB zone as emission beyond 80% of the Ks-band flux, and interior to the innermost 27.25 FUV AB magnitudes arcsec-2 contour. The 80% Ks-band flux contour for the grid of models is shown in yellow in Figure 6. The LSB zone of our grid of simulations is the area between the yellow and green contours in Figure 6. T07 define Type II XUV disks as objects whose LSB zone has an FUVKs color of less than 4, and the LSB zone is at least 7 times the area of the inner disk, defined by the 80% Ks-band contour. The color vs. area of this zone for our sample are shown in Figure 9 with the T07 sample.
None of our simulations meet the Type II criterion. Although they are blue enough in FUV-Ks, the LSB zone is too small. These characteristics are consistent with normal and Type I disks. Note that our simulations have very small scatter in this plot. As with the discussion of the flat-low model, the outer disk star formation in our simulations covers such a low fraction of the disk that the innermost continuous 27.25 FUV AB magnitudes arcsec-2 contour tends to fall at the edge of the inner disk, not the outer extended gas disk, so the LSB zone is primarily probing a part of the disk where the initial structure of each model is very similar. By varying the structure of the inner disk, particularly increasing the scale lengths of the models, we could change the characteristics of the LSB zone. However, it seems unlikely that we could alter the structure of the inner disk enough that it would yield Type II disks, while staying consistent with the observed structure of galaxies.
To quantify the outer disk UV emission we calculate covering fractions as described in § 3.1. Since the covering fraction varies significantly between snapshots, we considered 4 snapshots spanning an evolutionary time of 2.1 Gyr to 2.5 Gyr and report their average value in Figure 6. The error reported is the standard deviation of these values. Overall, the covering fraction seems to quantify the amount of FUV emission well, but, especially when limited to such a small sample, the covering fraction does not differentiate strongly between galaxies with different gas distributions. On average, the Mestel models have a higher covering fraction than the exponential models, and likewise for the constant density models vs. the Mestel models. But the covering fraction is not significantly higher for the models classified as Type I XUV disks than for the others. This at least partially owes to resolution. The contours are smoothed to 1 kpc in all models, the area of the low mass disks is smaller, increasing the size of the UV knots in the outer disk relative to the area the covering fraction is calculated over. This biases the covering fractions to be larger for the lower mass disks.
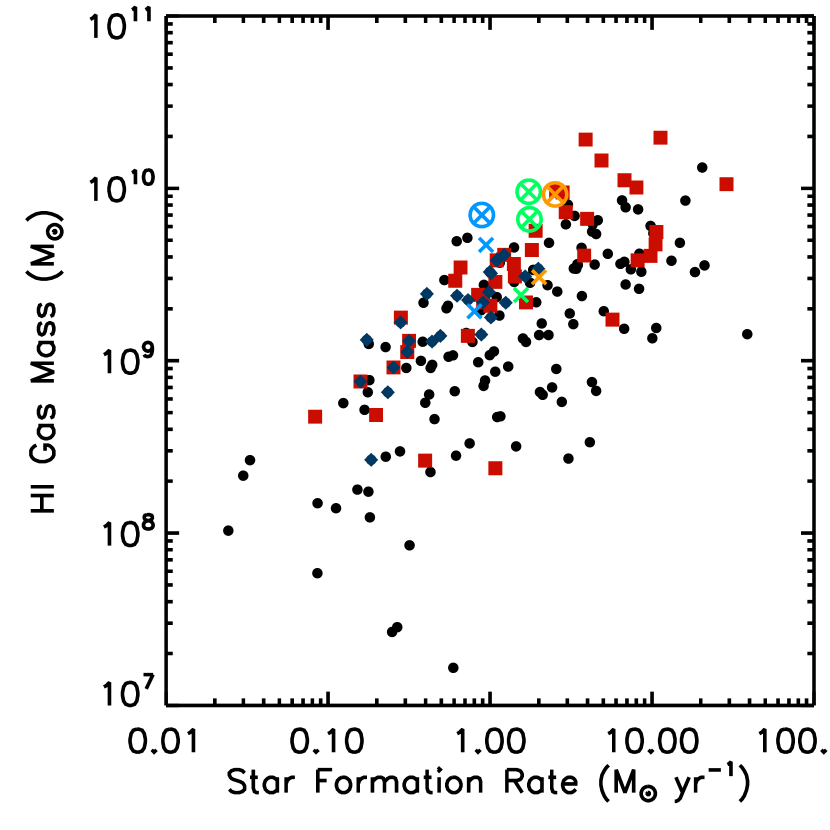
To further constrain our models, we compare their properties to other observational characteristics of XUV disks. T07 show that XUV disks are gas rich for their total star formation rate. In Figure 10 we plot the approximate H I gas masses of our disks against their total instantaneous star formation rates, along with the T07 sample. The H I gas mass for our simulations was approximated by assuming that 50% of all the star forming gas is molecular (Keres et al., 2003) and that 70% of what remains is H I (to account for He). Our models all lie in the high gas mass region of the T07 data, unsurprising since we have chosen a massive galaxy as our fiducial model. Additionally, in star forming regions, the molecular gas percentage may in fact be much higher, lowering the H I masses. However, since they are high mass disks, all of our galaxies lie in areas where there are both Type I XUV disks and normal disks. So while our results are consistent with T07, this plot does not provide a good diagnostic for determining whether our models match observed XUV disks in terms of gas richness.
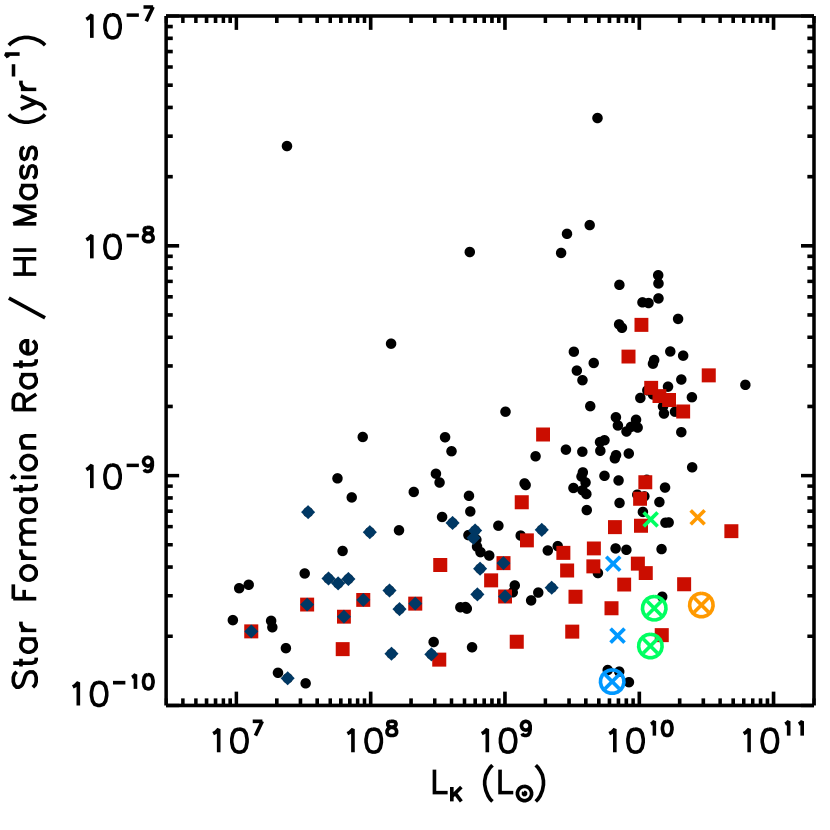
In Figure 10 we also plot the SFR/H I ratio vs. the Ks-band luminosity (calculated inside the 20 magnitudes arcsec-2 contour) of our galaxies, and compare these to T07. This plots gas richness vs. LK, a proxy for stellar mass and show whether the disks are gas rich for their star formation rate and stellar mass. Our modeled Type I XUV disks fall in an area that is dominated by Type I XUV disks, rather than normal galaxies. This is promising, indicating that the structure of our model galaxies is similar to Type I XUV disks.
In each of these plots it is evident that our models with constant density extended gas disks tend to have slightly larger H I masses than most observed galaxies. This is unsurprising; in reality we would expect to find few galaxies whose H I disks do not fall off at all with radius. However, they are an interesting limiting case. Our models with extended disks seem to be quite consistent with the H I masses of massive XUV disks. Overall, the structure of our models that are classified as Type I XUV disks are consistent with XUV disks observed by T07.
It is difficult to determine the fraction of XUV disks that owe to isolated in situ star formation if we do not know the fraction of XUV disks that have disk structures similar to that of our Type I XUV disk models. Detailed studies of the H I profiles of XUV disks are needed to determine whether we are describing them fully or if there are additional conditions needed to create all Type I XUV disks.
4.2. Comparison to Boissier et al. 2007
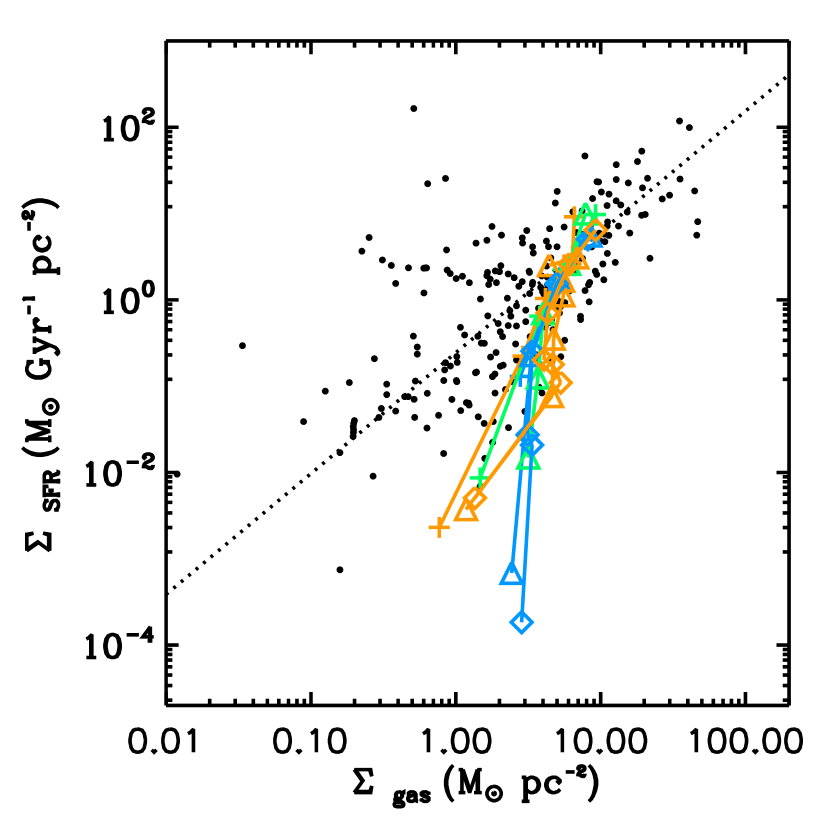
B07 studied the extinction corrected UV radial profiles of 43 galaxies which were selected for large angular size. In contrast to studies of profiles of galaxies, which find a strong truncation at 3-5 in total gas surface density (Kennicutt, 1989; Martin & Kennicutt, 2001), B07 find that star formation rate profiles derived from UV profiles do not show a break. In Figure 11 we show the instantaneous star formation rate of our simulations vs. the gas surface density. UV derived star formation rates give the star formation rate averaged over 200 Myrs, but since the star formation rates of our simulations are mostly constant with time after relaxing initially, the trends seen should be identical.
While at low gas densities, simulations can differ considerably in the details, all simulations, including Type I XUV disks, show strong truncations as a result of the volume density threshold to star formation and azimuthal averaging. The levels of star formation at low gas densities indicated by B07 are simply not reflected in our simulations. However, there are large uncertainties in the low star formation rate measurements and, when a gas profile is slowly varying, averaging can play a significant role in smoothing the star formation profile. To demonstrate this we plot the gas density vs. star formation rate density radial profile with radial bins of two different sizes, 1 kpc and 5 kpc. While with larger bins the profiles do flatten, they still show significant truncation. If the B07 results hold true with more detailed studies of individual objects, a change in the star formation prescription should be needed at low gas surface densities for at least some galaxies.
If the resolution of our simulation was increased, it is possible it could trace smaller overdensities and increase the amount of star formation at low average gas densities. However, when the azimuthally averaged Kennicutt-Schmidt law is plotted for the flat-low simulation at ten times the disk resolution, a truncation is still very evident.
4.3. Comparison to Dong et al. 2008
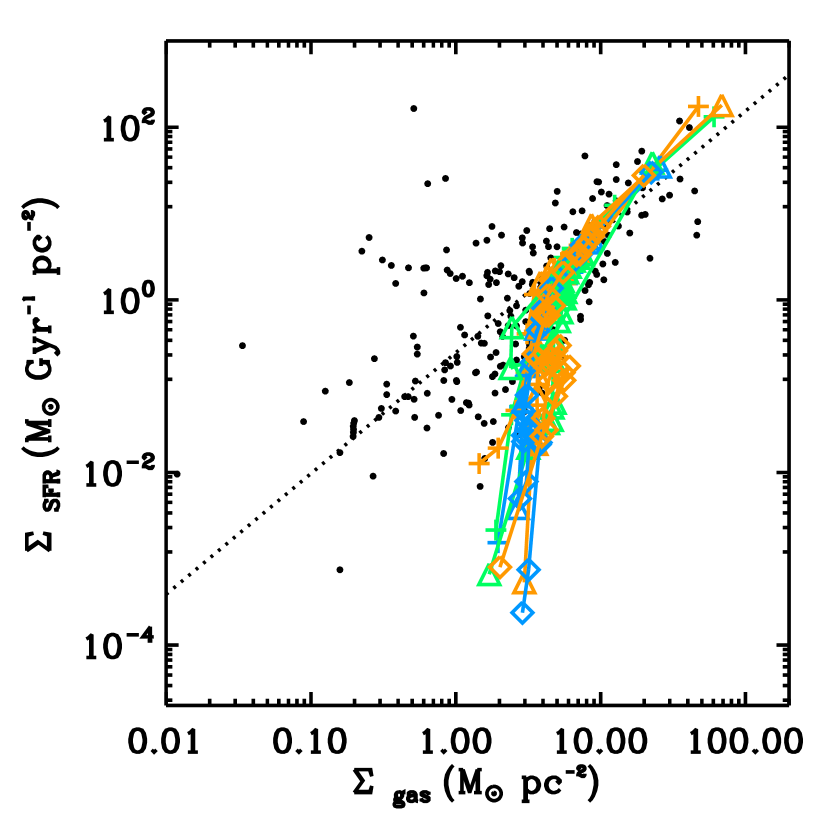
Dong et al. (2008) studied the characteristics of UV selected sources in the outer disks of a prototypical Type I XUV disk, M 83, using circular apertures with a diameter of 440 - 600 pc. They found that most of the star forming complexes are coincident with H I gas above the Toomre dynamical instability threshold. In addition, using UV and 8 m derived star formation rates and plotting these against H I gas density, they found general agreement with the Kennicutt-Schmidt law derived for regions in the inner disk of M 51 (Kennicutt et al., 2007).
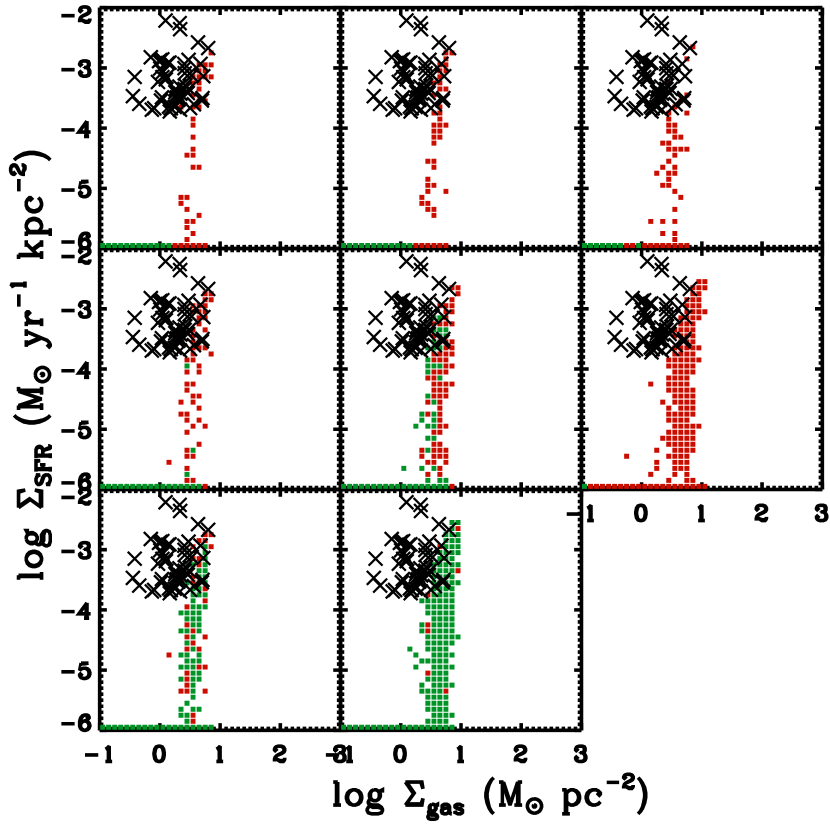
In order to compare to this type of analysis, we divide the star formation rate and gas surface density maps of each simulation into 1 kpc 1 kpc squares and plot the star formation rate vs. gas surface density for squares in the outer disk in Figure 12, along with the Dong et al. (2008) data. The SPH smoothing length is typically 1 kpc for our outer disk particles, therefore these are the smallest apertures we can use and they should be compared to the smaller aperture data of Dong et al. (2008) with caution. With the exception of a few points (and Dong et al. (2008) caution that the uncertainties on the 8 m portion of the star formation rates are large), we create star formation rates as high in the outer disk as those measured in M 83. Some gas surface densities in the Dong et al. (2008) data are considerably lower than our simulations, but they only include H I, so these should be considered lower limits on the gas surface density. If we calculate the H I surface density for our simulations assuming 50% of all star forming gas is molecular (clearly not accurate on large scales in outer disks but in the small apertures used by Dong et al. (2008) this may be a good approximation) we find that the central concentration of the M 83 data agrees well with our simulation results. In addition, some of our star formation rates are lower than those see in in Dong et al. (2008), but this is expected because they lay apertures only on sources, while we simply bin our outer disk, so some of our bins will have very low star formation rates.
As the star formation prescription is the same in each model, the Kennicutt-Schmidt law averaged on local scales change very little as the disk structure is changed between models. The data agree similarly with all the models we considered. The main difference between the models with and without Type I XUV emission is the extent of the star formation. To highlight this, we have colored portions of the diagram where star formation exists beyond a distance of approximately 1.5 optical radii in green. It is clear that the exponential disks do not show any star formation at large radii and, at large radii, only Mestel-mid, flat-low and flat-mid agree with the data.
5. Discussion
5.1. Spiral Structure
To determine whether we are accurately reproducing the star formation observed in galaxies, we need to determine whether the spiral perturbations in our simulations are consistent with those in actual galaxies. Though we know that spiral structure in our simulations is caused by numerical noise in the halo (Hernquist, 1993), what causes spiral structure in nature is unknown. However, for our purposes we only need to accurately recreate the amount of gas above the star formation threshold and therefore the amplitude of the spiral perturbations in the outer disk.
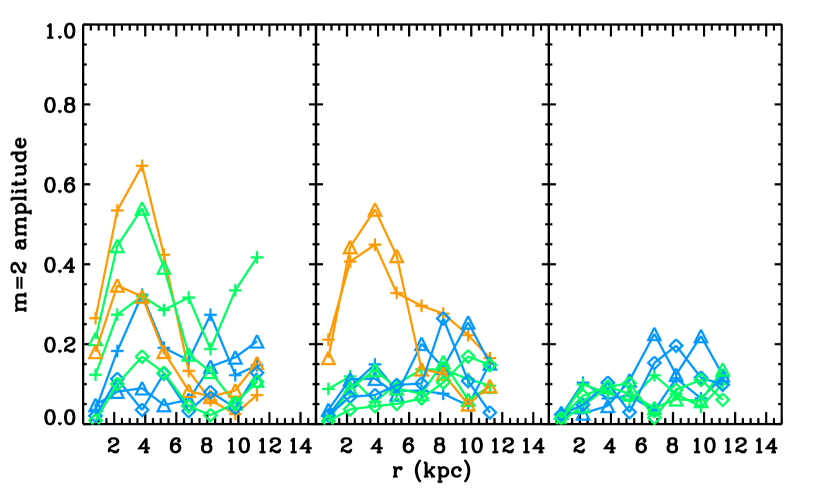
Studies of the spiral structure in stellar disks indicate that the two armed mode of spiral structure () dominates in most galaxies. We plot the relative amplitude of the stellar mode for the 2.2 Gyr snapshot of each simulation on the left in Figure 13. The very high amplitudes in inner regions owe to central bars. These are generally consistent with the range of observed mode amplitudes (Rix & Zaritsky, 1995; Elmegreen et al., 1992, Kendall et al. in preparation). The stellar mass dominates in the inner disk and gas falls into the potential well of the stellar spiral arms. These arms then propagate in the outer disk as sound waves. Since we reproduce the amplitudes of the stellar spiral wave correctly, it is reasonable to believe that we are accurately representing the gas perturbations as well.
To explore how the star formation in outer disks is affected by variations in spiral structure, we re-run our models again after increasing the halo mass by factors of two and four. As the halo to disk mass ratio increases, the disk becomes less self-gravitating and the power in the mode is decreased, making the spiral structure more flocculent. The structure of the disk is kept constant, and the number of particles in the halo is increased to keep the mass per particle in the halo constant between models. For the most massive disks, increasing the halo by four times means that the rotation curve peaks at over 300 km s-1, which is unreasonably high, so these models are not included in the analysis. The mode amplitude for the simulations with higher halo to disk mass ratios are shown on the middle and right panels in Figure 13. Note that as the halo to disk mass ratio increases, the mode amplitude decreases. These are still well within the constraints of observations (Rix & Zaritsky, 1995; Elmegreen et al., 1992, Kendall et al. in preparation).
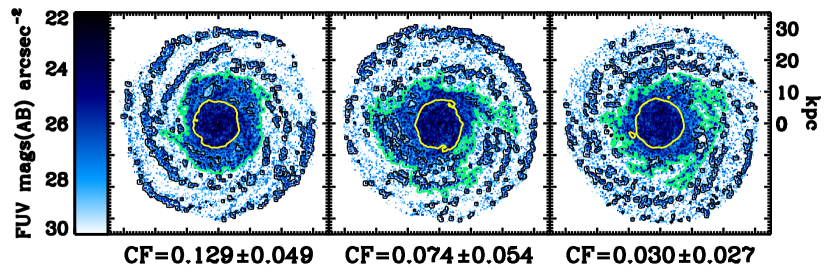
An example of the effect on the morphology of the outer disk star formation is shown in Figure 14. Figure 14 shows the 2.2 Gyr snapshot for the flat-mid model as the halo to disk mass ratio is increased. The morphology is affected and this is reflected in the covering fraction. This indicates that in galaxies that are more dark matter dominated, such as dwarf galaxies, we might expect to see more flocculent spiral structures in the outer disk and smaller covering fractions. There is very little difference in other diagnostics. Plotting the star formation rate vs. gas surface density does not alter the results seen in Figure 11. In Figure 15 we show the T07 XUV type diagnostic diagram including the high halo mass models. The locus of points is almost entirely unaffected by the additional models.
Changing the mass resolution of the halo particles also modifies the spiral structure. Higher resolution in the halo leads to less numerical noise and suppresses spiral structure. We choose our halo resolution because it recreates the observed amount of spiral structure.
5.2. Stellar Profiles
In a study of a large sample of SDSS galaxies, Pohlen & Trujillo (2006) found that only 10% of galaxies have a purely exponential stellar profile. Most galaxies show either a “down-bending break”, where the exponential profile of the outer disk is steeper than the inner disk, or an “up-bending break” where the exponential profile of the outer disk is shallower than that of the inner disk. While several other methods of populating the outer disks of galaxies have been proposed (Roškar et al., 2008b, a; Younger et al., 2007), older stellar populations accompanying the low levels of star formation in outer disks have been suggested as an explanation for up-bending breaks (Thilker et al., 2007; Elmegreen & Hunter, 2006). The stellar profiles of our models, shown in Appendix A, exhibit features owing to over-densities, but generally appear to be characterized by a single exponential. The overall level of star formation in outer disks is low, as shown by the star formation rate profiles in Appendix A, so it is not surprising that the outer stellar profile changes very little.
Elmegreen & Hunter (2006) present a model of star formation which creates down-bending breaks. These build stellar populations which also show a down-bending break. Their model includes a threshold for star formation that depends on the Toomre stability criterion and a turbulent model of the ISM. Because our threshold for star formation is just a single volume density, the star formation profile of our simulations is determined entirely by the gas density profile of the galaxy. Our star formation rate profiles then flatten in the outer disk following the flattening extended disk, rather than falling off with a sharper exponential. A more complex implementation of the star formation threshold is needed in order to determine whether our models agree.
5.3. Ionized Gas
We construct the gas content of our model galaxies to reproduce observed H I distributions of galaxies. However, there may be a significant amount of diffuse ionized gas, particularly in the outer regions of galaxies, that is not captured in 21 cm observations that measure the H I content. In the Milky Way the column density ranges from 20% -60% of the column density of H I (Reynolds, 1991). However, in outer disks, low gas densities reduce the efficiency with which the gas is able to shield itself from the UV background (e.g. Elmegreen & Parravano, 1994; Schaye, 2004). Studies of H I line-widths with radius indicate that there is an unexplained source of heating in outer disks (Tamburro et al., 2009) which could also point to a contribution from the UV background. This indicates that H II could become a significant component of the ISM at large radii. If star formation truly does reflect the total gas mass, as it would if it depended on the mid-plane pressure of the ISM, the pressure owing to the H II mass could boost star formation rates in the outer disk. In the case of our simulations, adding H II would increase the amount of gas above the threshold in the outer disk and result in more star formation. Detailed studies of the ISM in outer disks are needed to determine whether this effect is important.
5.4. Longevity

There is much debate over whether star formation in outer disks is continuous or episodic. In many examples there is enough H I gas to support continuous star formation at the levels seen over the lifetime of the galaxy (Gil de Paz et al., 2007). Our simulations are consistent with this. In Figure 16 we show the fraction of the initial gas in the outer disk still present as a function of time for the four simulations that are identified as Type I XUV disks in § 4.1. The outer disk is defined to start where the star formation rate surface density falls below 3 10-4 kpc-2 yr-1 in the initial disk. The oscillations owe to non-steady behavior in the disk as the simulation relaxes (see Figure 3). Even the simulations with the most outer disk star formation, flat-mid and Mestel-high, lose only % of their gas over the 4 Gyr timeframe of the simulations. Flat-low and Mestel-mid show almost no change over this time. This indicates that XUV disk emission could continue for the lifetimes of the galaxies, though as the gas is consumed in the galaxies with higher levels of outer disk star formation, the amount of XUV emission may decline to what is seen in lower gas content models.
5.5. Interactions
In this paper, we study only isolated galaxies, where density perturbations in the outer disk result from spiral structure induced by numerical noise in the halo. Of course, other sources, such as interactions, can cause perturbations in outer disks leading to in situ star formation. Strongly shocked gas owing to interactions in the outer disk would likely create high levels of star formation in very small regions. We will explore this possibility in due course.
5.6. Emission
While exploring the simulated H colors and distributions of individual star clusters would be very interesting, our resolution limits us to particle masses of . Since knots in the outer disk are often illuminated by a single star emitting ionizing radiation, we do not have the resolution to study the properties of our sources.
6. Conclusions
We have explored how outer disk star formation in extended gas disks resulting from a Kennicutt-Schmidt star formation prescription and volume density threshold compares to observations of XUV disks. We used a set of models with outer disk structures motivated by H I surveys. We find that models with slowly varying high surface density outer gas disks would be classified as Type I XUV disks. Possible variations in the star formation rate normalization or spiral structure amplitude mean that gas distributions that result in only a few knots of outer disk UV emission in our models may not always have UV emitting sources in their observed outer disks. While we cannot rule out other explanations for Type I XUV disks, since the Type I XUV emission in our models results naturally from empirical star formation laws and the observed structure of galaxy disks, we argue that the theory outlined here is a viable explanation.
The star formation in the outer disk of our models is not prevalent enough to erase the tell-tale truncation of the profile caused by the star formation volume density threshold. Since B07 see no truncation in the UV with gas radial profile, this could indicate that we need to revise our star formation prescription. However, the star formation rates in our models are consistent with star formation rates in the Type I XUV disk M 83 Dong et al. (2008). More detailed observational studies of the relation of gas density to star formation rate in outer disks are needed to determine whether the observed fields of M 83 are a special case or whether disks selected for XUV emission are subject to different processes than the B07 sample.
While XUV emission does not depend enough on the detail of gas density profiles to distinguish easily between them, it is a good indicator of the presence of gas at large radii in galaxies. Our results imply that nearly 1/3 of galaxies have large amounts of gas at 2-3 times their optical extents. In addition, forming Type II XUV disks with traditional star formation laws must require some process, such as rapid gas accretion, for creating a large young stellar population without an accompanying older population. These results may be outlining a picture where accreting gas in the outer parts of disks is common at late times, as suggested by the inside out disk formation scenario demonstrated by simulations of structure formation (e.g. Mo et al., 1998; Brook et al., 2006), and supported by the possibility that cold clouds developing in cosmological simulations may accrete onto disks at late times (Kereš & Hernquist, 2009).
The next step in exploring the observed signatures of in situ star formation would be to run very high resolution simulations that could be compared to observational work such as that of Herbert-Fort et al. (2009). These authors have computed the cross correlation of young clusters in NGC 3184 and found a significant inter-cluster signal for separations of less than 1 kpc, with cluster masses of . With higher resolution simulations, it is possible that measurements like these could differentiate between in situ star formation and stellar migration scenarios. Moreover, simulations with star formation prescriptions that are linked directly to the molecular gas may help reconcile in situ star formation and the results of B07. Robertson & Kravtsov (2008) present models indicating that directly relating the star formation rate to the molecular gas may eliminate truncations in the star formation rate profile. Continued observational studies and sophisticated simulations are needed to explore this complex regime in star formation.
References
- Boissier et al. (2007) Boissier, S. et al. 2007, ApJS, 173, 524
- Bresolin et al. (2009) Bresolin, F., Ryan-Weber, E., Kennicutt, R. C., & Goddard, Q. 2009, ApJ, 695, 580
- Broeils & Rhee (1997) Broeils, A. H. & Rhee, M.-H. 1997, A&A, 324, 877
- Broeils & van Woerden (1994) Broeils, A. H. & van Woerden, H. 1994, A&AS, 107, 129
- Brook et al. (2006) Brook, C. B., Kawata, D., Martel, H., Gibson, B. K., & Bailin, J. 2006, ApJ, 639, 126
- Bush et al. (2008) Bush, S. J., Cox, T. J., Hernquist, L., Thilker, D., & Younger, J. D. 2008, ApJ, 683, L13
- Christlein & Zaritsky (2008) Christlein, D. & Zaritsky, D. 2008, ApJ, 680, 1053
- Davé et al. (1999) Davé, R., Hernquist, L., Katz, N., & Weinberg, D. H. 1999, ApJ, 511, 521
- Di Matteo et al. (2005) Di Matteo, T., Springel, V., & Hernquist, L. 2005, Nature, 433, 604
- Dong et al. (2008) Dong, H., Calzetti, D., Regan, M., Thilker, D., Bianchi, L., Meurer, G. R., & Walter, F. 2008, AJ, 136, 479
- Draine & Li (2007) Draine, B. T. & Li, A. 2007, ApJ, 657, 810
- Dwek (1998) Dwek, E. 1998, ApJ, 501, 643
- Elmegreen et al. (1992) Elmegreen, B. G., Elmegreen, D. M., & Montenegro, L. 1992, ApJS, 79, 37
- Elmegreen & Hunter (2006) Elmegreen, B. G. & Hunter, D. A. 2006, ApJ, 636, 712
- Elmegreen & Parravano (1994) Elmegreen, B. G. & Parravano, A. 1994, ApJ, 435, L121+
- Ferguson et al. (1998) Ferguson, A. M. N., Wyse, R. F. G., Gallagher, J. S., & Hunter, D. A. 1998, ApJ, 506, L19
- Gil de Paz et al. (2005) Gil de Paz, A. et al. 2005, ApJ, 627, L29
- Gil de Paz et al. (2007) —. 2007, ApJ, 661, 115
- Groves et al. (2008) Groves, B., Dopita, M. A., Sutherland, R. S., Kewley, L. J., Fischera, J., Leitherer, C., Brandl, B., & van Breugel, W. 2008, ApJS, 176, 438
- Groves et al. (2004) Groves, B. A., Dopita, M. A., & Sutherland, R. S. 2004, ApJS, 153, 9
- Herbert-Fort et al. (2009) Herbert-Fort, S., Zaritsky, D., Moustakas, J., Christlein, D., Wilcots, E., Baruffolo, A., Di Paola, A., Fontana, A., Giallongo, E., Pogge, R. W., Ragazzoni, R., & Smareglia, R. 2009, ApJ, 700, 1977
- Hernquist (1990) Hernquist, L. 1990, ApJ, 356, 359
- Hernquist (1993) —. 1993, ApJS, 86, 389
- Hopkins et al. (2007) Hopkins, P. F., Richards, G. T., & Hernquist, L. 2007, ApJ, 654, 731
- Jarrett et al. (2003) Jarrett, T. H., Chester, T., Cutri, R., Schneider, S. E., & Huchra, J. P. 2003, AJ, 125, 525
- Jonsson (2006) Jonsson, P. 2006, MNRAS, 372, 2
- Jonsson et al. (2009) Jonsson, P., Groves, B., & Cox, T. J. 2009, ArXiv e-prints
- Katz et al. (1996) Katz, N., Weinberg, D. H., & Hernquist, L. 1996, ApJS, 105, 19
- Kennicutt (1989) Kennicutt, Jr., R. C. 1989, ApJ, 344, 685
- Kennicutt (1998a) —. 1998a, ARA&A, 36, 189
- Kennicutt (1998b) —. 1998b, ApJ, 498, 541
- Kennicutt et al. (2007) Kennicutt, Jr., R. C. et al. 2007, ApJ, 671, 333
- Keres et al. (2003) Keres, D., Yun, M. S., & Young, J. S. 2003, ApJ, 582, 659
- Kereš & Hernquist (2009) Kereš, D. & Hernquist, L. 2009, ApJ, 700, L1
- Kroupa et al. (1993) Kroupa, P., Tout, C. A., & Gilmore, G. 1993, MNRAS, 262, 545
- Krumholz et al. (2009) Krumholz, M. R., McKee, C. F., & Tumlinson, J. 2009, ApJ, 699, 850
- Lee et al. (2009) Lee, J. C., Gil de Paz, A., Tremonti, C., Kennicutt, R. C., Salim, S., Bothwell, M., Calzetti, D., Dalcanton, J., Dale, D., Engelbracht, C., Funes, S. J. J. G., Johnson, B., Sakai, S., Skillman, E., van Zee, L., Walter, F., & Weisz, D. 2009, ApJ, 706, 599
- Leitherer et al. (1999) Leitherer, C., Schaerer, D., Goldader, J. D., Delgado, R. M. G., Robert, C., Kune, D. F., de Mello, D. F., Devost, D., & Heckman, T. M. 1999, ApJS, 123, 3
- Martin & Kennicutt (2001) Martin, C. L. & Kennicutt, Jr., R. C. 2001, ApJ, 555, 301
- Martin et al. (2005) Martin, D. C. et al. 2005, ApJ, 619, L1
- Mestel (1963) Mestel, L. 1963, MNRAS, 126, 553
- Mo et al. (1998) Mo, H. J., Mao, S., & White, S. D. M. 1998, MNRAS, 295, 319
- Pflamm-Altenburg & Kroupa (2008) Pflamm-Altenburg, J. & Kroupa, P. 2008, Nature, 455, 641
- Pohlen & Trujillo (2006) Pohlen, M. & Trujillo, I. 2006, A&A, 454, 759
- Reynolds (1991) Reynolds, R. J. 1991, in IAU Symposium, Vol. 144, The Interstellar Disk-Halo Connection in Galaxies, ed. H. Bloemen, 67–76
- Rix & Zaritsky (1995) Rix, H.-W. & Zaritsky, D. 1995, ApJ, 447, 82
- Robertson & Kravtsov (2008) Robertson, B. E. & Kravtsov, A. V. 2008, ApJ, 680, 1083
- Rocha et al. (2008) Rocha, M., Jonsson, P., Primack, J. R., & Cox, T. J. 2008, MNRAS, 383, 1281
- Roškar et al. (2008a) Roškar, R., Debattista, V. P., Quinn, T. R., Stinson, G. S., & Wadsley, J. 2008a, ApJ, 684, L79
- Roškar et al. (2008b) Roškar, R., Debattista, V. P., Stinson, G. S., Quinn, T. R., Kaufmann, T., & Wadsley, J. 2008b, ApJ, 675, L65
- Schaye (2004) Schaye, J. 2004, ApJ, 609, 667
- Springel (2005) Springel, V. 2005, MNRAS, 364, 1105
- Springel et al. (2005) Springel, V., Di Matteo, T., & Hernquist, L. 2005, MNRAS, 361, 776
- Springel & Hernquist (2002) Springel, V. & Hernquist, L. 2002, MNRAS, 333, 649
- Springel & Hernquist (2003) —. 2003, MNRAS, 339, 289
- Springel & Hernquist (2005) —. 2005, ApJ, 622, L9
- Tamburro et al. (2009) Tamburro, D., Rix, H.-W., Leroy, A. K., Low, M.-M. M., Walter, F., Kennicutt, R. C., Brinks, E., & de Blok, W. J. G. 2009, AJ, 137, 4424
- Thilker et al. (2005) Thilker, D. A. et al. 2005, ApJ, 619, L79
- Thilker et al. (2007) —. 2007, ApJS, 173, 538
- Toomre (1964) Toomre, A. 1964, ApJ, 139, 1217
- Walter et al. (2008) Walter, F., Brinks, E., de Blok, W. J. G., Bigiel, F., Kennicutt, R. C., Thornley, M. D., & Leroy, A. 2008, AJ, 136, 2563
- Weingartner & Draine (2001) Weingartner, J. C. & Draine, B. T. 2001, ApJ, 563, 842
- Younger et al. (2007) Younger, J. D., Cox, T. J., Seth, A. C., & Hernquist, L. 2007, ApJ, 670, 269
- Zaritsky & Christlein (2007) Zaritsky, D. & Christlein, D. 2007, AJ, 134, 135