1\Yearpublication2010\Yearsubmission2010\Month\Volume\Issue
later
Inhomogeneous Power Distribution in Magnetic Oscillations
Abstract
We apply ring-diagram analysis and spherical harmonic decomposition methods to compute 3-dimensional power spectra of magnetograms obtained by the Global Oscillation Network Group (GONG) during quiet periods of solar activity. This allows us to investigate the power distribution in acoustic waves propagating in localized directions on the solar disk. We find evidence of the presence of five-minute oscillations in magnetic signals that suggests a non-homogeneous distribution of acoustic power. In this paper, we present our results on the asymmetry in oscillatory power and its behaviour as a function of frequency, time and magnetic field strength. These characteristics are compared with simultaneous velocity measurements.
keywords:
Sun:helioseismology; Sun: magnetic fields; Sun: oscillations; methods: data analysis1 Introduction
The nature of the propagation of acoustic waves in the solar atmosphere is important for understanding the interaction of these waves with magnetic fields that modify the surface amplitude of the propagating waves. The absorption of acoustic waves by sunspots has been discussed using various data sets and techniques (e.g. Braun, La Bonte and Duvall 1987, Lites et al. 1998, Norton et al. 1999, Ulrich 1996). The studies using the techniques of local-helioseismology have also shown a significant decrease in oscillatory power in localized regions of strong magnetic field (Chou et al. 2009, Howe et al. 2004, Rajaguru, Basu and Antia 2001). The observed modulation in power is also affected by neighboring regions and this “neighborhood effect” is discussed in detail by Nicholas, Thompson and Rajaguru (2004). Observations further suggest that the amplitude is suppressed at low-frequencies while it is enhanced around magnetic field regions above 5 mHz (Jain & Haber 2002).
In this paper, we present characteristics of the oscillations observed in magnetic and velocity signals during quiet solar activity using simultaneous full-disk measurements from Global Oscillations Network Group (GONG). The origin of five-minute oscillations in magnetograms is believed to be cross talk between Doppler velocity and Zeeman splitting. Since the presence of strong magnetic fields modulates the power, quiet periods provide clues to the me-chanism of how the waves propagate in the absence of the field. For a comprehensive comparison of results, two different techniques, ring-diagram analysis and spherical harmonic decomposition, are applied.
2 Data and Analysis
We use high-cadence (60 s) line-of-sight continuous magnetograms from GONG. These magnetograms were obtained in the Ni 6768 spectral line with a spatial pixel size of approximately 2.5 arc-sec, and have a noise level of 3 G per pixel. To study the acoustic power distribution in the quiet Sun, we choose a period of minimal activity in both front- and far-sides. Hence we analyze data during 2008 August, which recorded more than 94% spotless days. We also use simultaneous Dopplergrams from the same network to compare the characteristic of oscillatory power in two observables. We treat these images locally by applying ring-diagram technique and globally by using the spherical harmonic decomposition method to calculate power spectra.
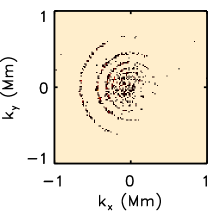
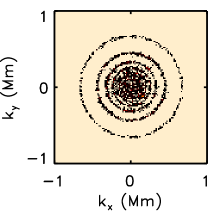
For the ring-diagram method, we used a grid of 128 128 pixels with spatial resolution of 0o.25 at disk center. The regions of 32o square (apodized to 30o diameter) were remapped and tracked for 1440 min using the surface rotation rate of Snodgrass. The Fast Fourier Transformation (FFT) was then applied to the tracked cube to calculate 3-dimensional power spectrum (, , ). In this method, the oscillation power within the spectrum is distributed along curved surfaces that, when cut at constant frequency, appear as a set of nested rings, each corresponding to a mode of different radial order . Figure 1 shows rings obtained at 3.333 mHz for both magnetic and velocity signals.
For the spherical harmonic decomposition method, regions of 120o in diameter centered at the disk center were selected and remapped into sin(lat)-long co-ordinates. The spherical harmonic decomposition was applied to produce a time series of coefficients. The obtained time series were filtered with a Gaussian filter of FWHM = 2.5 mHz centered at 3.3 mHz and the FFT was applied to produce power spectrum.
3 Results
3.1 Ring-diagram analysis
Figure 1 shows the cuts of 3D spectra in (, ) plane for magnetic and velocity oscillations at a constant frequency ( = 3.333 mHz) for 2008 August 18. It is clearly seen that the power around the rings in magnetic oscillations is different from the velocity oscillations. These slices provide information about the characteristics of the propagated waves. The approximate relationship between , , and are / and /, where is the solar radius and other symbols have their usual meanings. The total wave number, , is /.
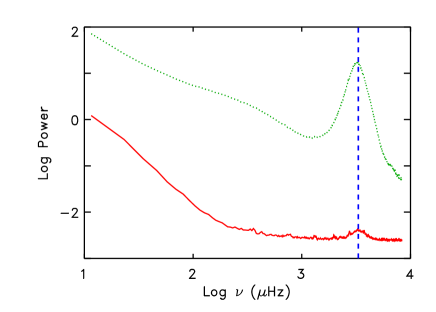
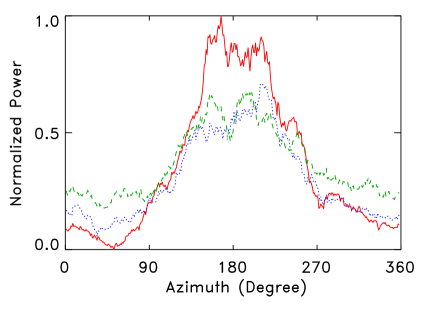
The presence of partial rings in magnetic oscillations suggests anisotropic distribution of acoustic power in propagating waves. These were first reported by Hill et al. (2008) where quiet, sunspot and network regions were analyzed. In this analysis, it was conjectured that the power in quiet region might have been suppressed by the presence of neighboring sunspot. Since our analysis is confined to quiet days and there is no visible solar activity for several days, we do not expect the observed suppression to be arising from the “neighborhood effect”. We also notice that the power in magnetic oscillations is relatively weak. This difference is clearly visible in Figure 2 where we show azimuthally averaged power spectra for both the observables. We do see a bump in magnetic oscillations at 3.33 mHz but it is less prominent compared to the velocity oscillations due to low signal-to-noise ratio. A similar trend is observed for all days considered in this analysis. As an example, we show in Figure 3 the variation of normalized power in ring-diagram analysis with azimuth for three consecutive days. In an earlier analysis using data from NaI D line by Magneto-Optical Filter (MOF) instrument, Moretti et al. (2003) also found a significantly low signal-to-noise ratio in magnetic oscillations. We also find a weak anisotropy in power distribution in velocity rings.
3.2 Spherical harmonic decomposition method
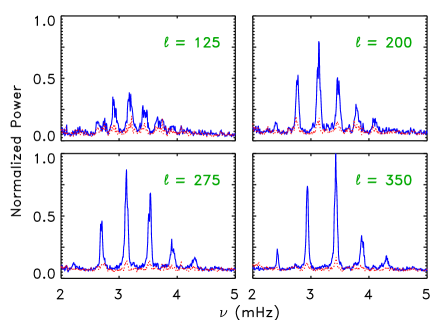
Here we split the total power spectrum into two components corresponding to positive- and negative- coefficients. In Figure 4, we show the variation of these components with frequency for magnetic oscillations. In all cases, we find that the waves propagating in the direction of solar rotation (represented by coefficients) have more power than the retrograde waves. A similar plot for velocity oscillations is shown in Figure 5, but we obtain comparable power in both directions. Hence, in this method again, we find the acoustic power in waves seen in magnetic field propagating in westward direction is higher than the eastward direction. This indicates that a portion of power is lost when waves propagate against the direction of solar rotation, however this effect is prominent in magnetic oscillations due to the low signal-to-noise ratio. These results support the findings obtained with ring-diagram technique as discussed earlier.
3.3 Temporal variability in anisotropy
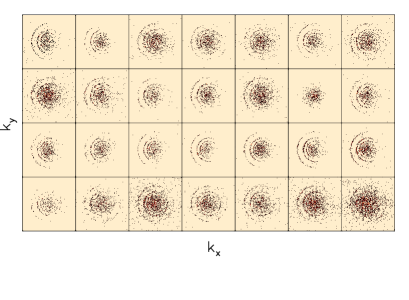
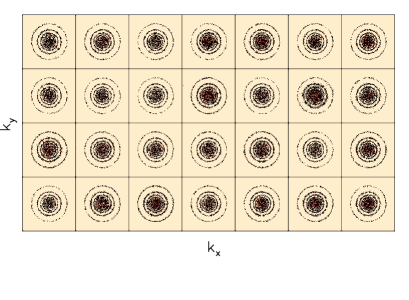
To study the temporal variability in anisotropy, we plot in Figure 6 the 3-dimensional power spectra at = 3.333 mHz for the period 2008 August 1-28. Although the anisotropy is present in all cases, there are variations from day to day. It is well known that the duty cycle of observations plays an important role in helioseismic techniques and affects the observations. Clearly, a low duty cycle will produce noisy rings. A detailed analysis of the effect of duty cycle on anisotropy is in progress and will be published elsewhere.
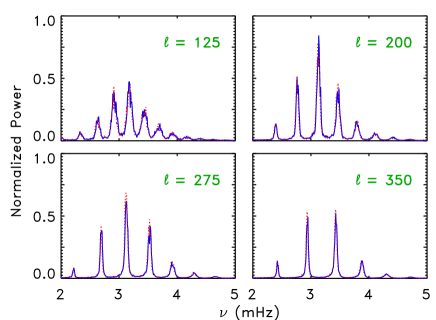
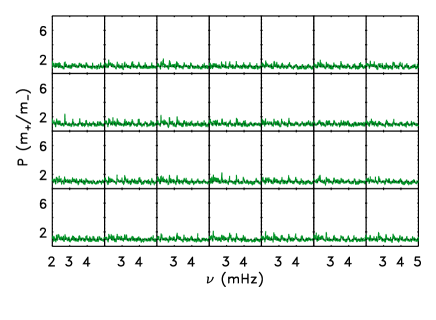
To quantify the anisotropy we define an asymmetry parameter, , as the ratio of the power in waves propagating in westward (prograde) and eastward (retrograde) directions. These values obtained from the spherical decomposition method are plotted in Figure 6. It is evident that the asymmetry parameter varies with frequency and has significantly higher values for the peaks in power spectra. These are also found to vary with time. We notice a close correspondence between asymmetries obtained with both the methods. Figure 7 shows the power distribution in the velocity oscillations. As discussed above, there is a weak inhomogeneity in velocity oscillations but it is not as significant as in magnetic oscillations. Hence our analysis of power spectra for waves in two different directions clearly indicates that the propagation is affected by the solar rotation that attenuates the amplitude when waves propagates against this direction.
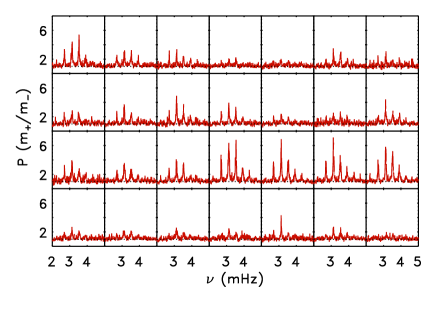
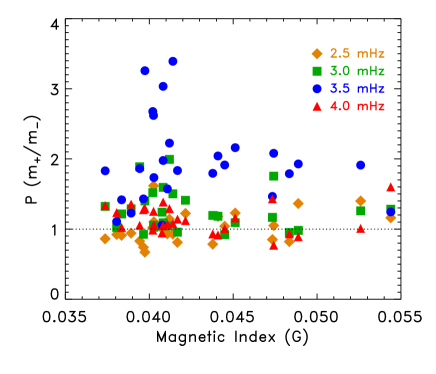
To study the effect of the magnetic field strength on the asymmetry parameter, Figure 8 shows as a function of magnetic index for four different frequency bands. We find a systematic variation in asymmetry parameter with frequencies and maximum values are achieved for the 3.5 mHz band. However, we do not find any significant correlation between the asymmetry parameter and magnetic field strength. A statistically meaningful analysis for this variation is in progress and we believe that such studies will provide important clues on the absorption of power in magnetized regions.
4 Summary
Using simultaneous Dopplergrams and magnetograms obtained from GONG, we find evidence of the presence of 5-minute oscillations in magnetic signals. The oscillations in these magnetograms are believed to arise due to cross talk between Doppler velocity and Zeeman splitting. The important findings in this work are summarized below;
-
1.
The signal-to-noise ratio in magnetic rings is low compared to the velocity rings.
-
2.
The anisotropy in magnetic rings appear in two quadrants that correspond to waves propagating in the retrograde direction. Thus, in the quiet sun the effect is mainly due to solar rotation which shifts the frequency of one half of the ring, thereby decreasing its amplitude.
-
3.
The asymmetry parameter varies with frequency and the maximum asymmetry is obtained in 5-min oscillation band.
-
4.
Our analysis do not show any significant correlation between asymmetry parameter and magnetic field.
-
5.
We do find anisotropy in the velocity rings, but it is much less prominent due to high signal-to-noise ratio.
Acknowledgements.
We wish to thank Irene González Hernández for many useful discussions. This work was supported by NASA-GI grant NNG 08EI54I. It utilizes data obtained by the Global Oscillation Network Group (GONG) project, managed by the National Solar Observatory, which is operated by AURA, Inc. under a cooperative agreement with the National Science Foundation. The data were acquired by instruments operated by the Big Bear Solar Observatory, High Altitude Observatory, Learmonth Solar Observatory, Udaipur Solar Observatory, Instituto de Astrofísico de Canarias, and Cerro Tololo Interamerican Observatory.References
- [1] Braun, D. C., La Bonte, B. J., Duvall, T. L., Jr.: 1987, ApJ 319, L27
- [2] Chou, D.-Y., Liang, Z.-C., Yang, M.-H., Zhao, H., Sun, M.-T.: 2009, ApJ 696, L106
- [3] Hill, F.: 1988, ApJ 333, 996
- [4] Hill, F. et al. : 2008, in ASP Conf Ser 383, eds. R. Howe, R. W. Komm, K. S. Balasubramaniam, G. J. D. Patrie, p. 383
- [5] Howe, R., Komm, R. W., Hill, F., Haber, D. A., Hindman, B. W.: 2004, ApJ 608, 562
- [6] Jain, R., Haber, D.: 2002, A&A 387, 1092
- [7] Lites, B. W., Thomas, J. H., Bogdan, T. J., Cally, P.: 1998, ApJ 497, 646
- [8] Moretti, P. F., Cacciani, A., Hanslmeier, A., Messerotti, M., Otruba, W., Warmuth, A.: 2003, A&A 403, 297
- [9] Nicholas, C. J., Thompson, M. J., Rajaguru, S. P.: 2004, Solar Phys. 225, 213
- [10] Norton, A. A., Ulrich, R. K., Bush, R. I., Tarbell, T. D.: 1999, ApJ 518, L123
- [11] Ulrich, R. K.: 1996, ApJ 465, 436