Abundances of C, N, Sr and Ba on the red giant branch of Centauri111This paper includes data gathered with the 6.5 meter Magellan Telescopes located at Las Campanas Observatory, Chile.
Abstract
Abundances relative to iron for carbon, nitrogen, strontium and barium are presented for 33 stars on the red giant branch of the globular cluster Centauri. They are based on intermediate-resolution spectroscopic data covering the blue spectral region analyzed using spectrum synthesis techniques. The data reveal the existence of a broad range in the abundances of these elements, and a comparison with similar data for main sequence stars enables insight into the evolutionary history of the cluster.
The majority of the red giant branch stars were found to be depleted in carbon, i.e. , while for the same stars shows a range of 1 dex, from to 1.7 dex. The strontium-to-iron abundance ratios varied from solar to mildly enhanced (), with [Ba/Fe] generally equal to or greater than [Sr/Fe]. The carbon and nitrogen abundance ratios for the one known CH star in the sample, ROA 279, are and dex.
Evidence for evolutionary mixing on the red giant branch is found from the fact that the relative carbon abundances on the main sequence are generally higher than those on the red giant branch. However, comparison of the red giant branch and main sequence samples shows that the upper level of nitrogen enhancement is similar in both sets at dex. This is most likely the result of primordial rather than evolutionary mixing processes.
One red giant branch star, ROA 276, was found to have Sr and Ba abundance ratios similar to the anomalous Sr-rich main sequence star S2015448. High resolution spectra of ROA 276 were obtained with the Magellan Telescope/mike spectrograph combination to confirm this result, revealing that ROA 276 is indeed an unusual star. For this star calculations of the depletion effect, the potential change in surface abundance that results from the increased depth of the convective envelope as a star moves from the main sequence to the red giant branch, strongly suggest that the observed Sr enhancement in ROA 276 is of primordial origin, rather than originating from a surface accretion event.
1 Introduction
The unusual variation in abundances of stars within the globular cluster Centauri has been well studied over the last four decades. From the original photographic and photoelectric work of Woolley et al. (1966) and Cannon & Stobie (1973) respectively, and the more recent analysis of CCD photometry by Sollima et al. (2005), the spread in color on the red giant branch is apparent with distinct branches visible in the color-magnitude diagram (CMD). The large range in metallicity of over 1 dex has been studied extensively on the red giant branch (RGB) (Norris, Freeman & Mighell 1996, hereafter NFM96; Suntzeff & Kraft 1996; Lee et al. 1999; Pancino et al. 2000; Rey et al. 2004; Sollima et al. 2005; Johnson et al. 2008; Calamida et al. 2009), and to a limited extent on the main sequence and turnoff (MSTO) area (Piotto et al., 2005; Sollima et al., 2005; Stanford et al., 2006a; Kayser et al., 2006; Villanova et al., 2007).
Large ranges in abundance for all elements studied in the cluster have been found on the RGB (Norris & Da Costa 1995a, hereafter ND95; Smith et al. 1995, 2000; Johnson et al. 2008; Calamida et al. 2009). This contrasts with what is found in normal globular clusters where typically small ranges for the light elements (C, N, O, Mg, Al and Na) are seen. The light elements in Cen stars show large variations for a given [Fe/H] (Persson et al. 1980, Brown & Wallerstein 1993, hereafter BW93; ND95). The elemental (Mg, Si, Ca and Ti) abundance ratios with respect to iron are largely constant for (BW93, Smith et al. 1995; ND95; Smith et al. 2000) but [/Fe] then decreases at metallicities greater than -1.0 (Pancino et al., 2002). Sodium ([Na/Fe]) and aluminum ([Al/Fe]) abundances are correlated, and both are anticorrelated with oxygen ([O/Fe]) (BW93; ND95; Norris & Da Costa 1995a; Smith et al. 2000). For lower metallicities (below ) Smith et al. (2000) and Cunha et al. (2002) report constant [Cu/Fe]. Above a metallicity of , however, Pancino et al. (2002) find an increase in [Cu/Fe] as the metallicity increases. Variations in abundance for the neutron-capture elements have also been found. The s-process element abundance ratios, [s/Fe], increase with increasing [Fe/H], but then are constant above metallicities greater than (ND95, Smith et al. 1995). The source of these abundance variations can be attributed to several different possibilities. The decrease in -elemental abundances at higher metallicities () can be attributed to Type Ia supernovae enrichment. The origin of the s-process enrichment is possibly due to ejecta from asymptotic giant branch (AGB) stars, and the iron peak and metal abundance patterns are consistent with primordial enrichment from Type II supernovae.
At least three different processes are likely to be involved. The first are the processes that mix material within the stars themselves. These include the first dredge up on the RGB in which the surface layers of the star are mixed with lower processed material (Iben, 1965). This can, in principle, account for some of the variations seen within the RGB stars of C, N and O. These processes, however, are unlikely to account for the variations seen in elements heavier than oxygen.
Secondly, an enriched object may have accreted matter onto its surface layers from either stellar winds from AGB stars or interstellar material. As the accretion events only affect the surface layers of the star, once it ascends the RGB and the convective envelope deepens, the accreted matter will be mixed with the internal layers, thereby reducing the level of enrichment. A comparison of MS and RGB stars may then show higher abundances for the unevolved MS stars compared to those on the RGB. Johnson et al. (2009) suggest large binary fractions, and hence accretion of enhanced material, as the source of the 25% of their sample with . Calamida et al. (2009) also suggest the same scenario to explain the of CN strong RGB stars identified in their sample. However, this is in contrast to that observed by Mayor et al. (1996) who monitored giants in Cen over a ten year period and found the binary fraction to be as low as 3 – 4%.
The third possibility is that the variations have a primordial origin; i.e. the stars formed from gas enriched by a combination of AGB stars, massive stars and/or supernovae. It is likely that more than one of these scenarios is at work.
Nevertheless, a comparison between abundances obtained from MS and RGB stars may help to distinguish among the various processes involved in the enrichment of this unusual star cluster. In particular, in the absence of thermohaline mixing (discussed further in §5), it can distinguish whether enrichment of s-process and CNO elements is due to surface contamination (which would be diluted by the growing convective envelope as the stars move on to the giant branch) or is instead uniform throughout the stars. An abundance analysis of MSTO stars has already been performed by the present authors (Stanford et al., 2007) for carbon, nitrogen, and strontium. In the present paper we investigate abundances on the RGB in a similar manner. The sample of RGB stars and their observations is described §2. In §3 we discuss the stellar parameters and the techniques used to obtain abundances for C, N, Sr and Ba in the stars. The results are presented in §4. In §5 we present comparisons between the RGB and MSTO and discuss the consequences.
2 The Red Giant Branch Sample and Observations
In order to compare abundances found on the main sequence (Stanford et al., 2007) with those on the RGB, spectra were obtained for a sample of RGB stars. These objects have , and are among the brightest RGB stars in the cluster. All lie above the luminosity where the first dredge-up occurs and most, if not all, have luminosities that place them above the bump in the RGB luminosity function. The objects selected for observation covered a range in metallicities and several stars were included due to the known nature of their CH feature, or high s-process abundances. These objects are more likely to have higher relative abundances and to be useful for comparisons with the unusual stars on the MS. While most of these objects are ROA objects (Woolley et al. 1966), 11 come from the list of Pancino et al. (2002).
The spectra of the RGB stars were obtained on the ANU’s 2.3m telescope at Siding Spring Observatory. Data were obtained in February 2002, June 2002, and May 2005 with the Double Beam Spectrograph using 600 and 1200 line/mm gratings. The stars observed are listed in Table 1. Spectra for eighteen RGB stars were obtained with the 600 line/mm grating. The 1200 I grating was used to observe 39 RGB stars, 8 of which were in common with those observed with the lower resolution grating. The low resolution (R600) data covered a wavelength range 3500–5400Å and had a resolution of 2.2Å fwhm. The high resolution (R1200) spectra covered a wavelength range of 3700–4600Å and their resolution was 1.2Å fwhm. Reduction and wavelength calibration was performed using standard routines in IRAF and Figaro.
In addition to the above medium-resolution spectra, high-resolution data were also obtained for one outstanding object in the sample, ROA 276, together with two other comparison objects, ROA 46 and ROA 150. These spectra were obtained with the Magellan Telescope/mike spectrograph combination during 2007 June 22-23 using a 0.5 arcsec slit, yielding resolving power 47,000, and resolution 0.12 Å FWHM. This material will be discussed in §4.4.3.
3 Stellar Parameters
Stellar parameters for our sample were obtained primarily from the literature. ND95 listed temperatures (), gravities (), metallicities ([Fe/H]) and microturbulent velocities () for a large fraction of the RGB objects for which we have data, and these were used for consistency between objects. Temperatures and gravities were also obtained from Persson et al. (1980) for objects that were not in ND95. Stellar parameters for several RGB stars were also obtained from Pancino (2003, hereafter PAN03) which are identified by the “OC” prefix. For objects that did not have metallicities listed in ND95, [Fe/H] was determined using [Ca/H] from NFM96 where . Following Smith et al. (1995) and Pancino et al. (2000) we adopt the following [Ca/Fe] relation:
| (1) |
A small number of objects in our sample had no stellar parameter information from the sources listed above, or from others in the literature. In these cases a metallicity was determined from [Ca/H], of NFM96, as described above. This metallicity was then used to find other RGB stars in our sample with similar values () for which we had stellar parameters. A least squares fit was then performed in V– space for the chosen comparison stars to obtain a gravity for the star from its V magnitude. Similarly, a temperature was obtained from a least squares fit in space. As most RGB stars have a microturbulent velocity of , this value was assumed for these objects. However, there remained a small number of stars for which we were unable to obtain stellar parameters (ROA 55, 577; and OC 230189, 242056, 250606, 312058, 801639) and consequently these stars were not included in the analysis.
Table 2 lists the stellar parameters used for each star, with ROA or OC number in column 1, V magnitude and B–V color in columns 2 and 3, and , , metallicity and microturbulence in columns 4–7, respectively. The sources of the stellar parameters are listed against each star for clarification in column 8.
Abundances of [O/Fe] and [Ca/Fe] were obtained from ND95 and PAN03. In the instances where these were not available, the abundance ratios of these elements followed equation 1 above.
Two objects, ROA 336 and 517, observed with the higher resolution grating, had high metallicities ( and 0.02 respectively, Norris, Freeman & Mighell 1996). Spectrum synthesis was attempted but it was found that for these cool, metal-rich stars the models do not produce an adequate fit to the observed spectra. Consequently, these objects were not analyzed further. The remaining sample then consisted of 23 objects with high resolution (1.2Å) and 16 stars with low resolution (2.2Å) spectra, with 7 stars in common.
4 Abundances
The abundance analysis used spectrum synthesis techniques for each of the objects, adopting the stellar parameters listed in Table 2. Kurucz (1993) stellar models were employed with atomic line lists from Bell (2000, private communication) and Kurucz molecular lines lists. As with our study of abundances on the main sequence/subgiant branch (Stanford et al., 2007) the synthesis code developed by Cottrell (Cottrell & Norris, 1978) was used to generate synthetic spectra. These were broadened to 1.1Å and 2.2Å to match the observed higher and lower resolution data, respectively. The solar abundances and gf values for CH, CN, Sr ii 4077Å, Sr ii 4215Å and Ba ii 4554Å used in Stanford et al. (2007) were again employed.
As for the MSTO data, the CH at 4300Å feature was analyzed first. The resulting [C/Fe] was then adopted in the analysis of the CN features. Due to the cooler nature of the RGB stars in comparison with the MSTO stars, the violet CN at 3883Å is often saturated making any abundance determination from this band uncertain. Therefore the blue CN band at 4216Å was used for the RGB stars. The effect this has on the derived abundances is minimal, and was tested using an RGB object (ROA 40) with low N enhancement (). For this star, the violet CN band was not saturated and consistent results were found for [N/Fe] from both bands.
Lastly, the Sr ii 4077Å, Sr ii 4215Å and Ba ii 4554Å features were analyzed. In contrast to the MSTO data, Ba abundances were able to be determined for each RGB star. This was due to the higher resolution and S/N of the data and/or cooler temperatures. The Sr ii 4215Å line was not analyzed if owing to contamination from the 4215Å CN features. In the synthetic spectra, several lines (e.g. iron, titanium, samarium, CH) were present near the Sr ii 4077Å feature () that were more clearly separated in the observed high resolution (R1200) spectra. In the lower resolution data (R600) these features were blended with the Sr ii line making the abundance determined from the R600 data slightly more uncertain. The Sr abundances were determined from the models both with and without these lines, which led to the conclusion that they did not significantly affect the [Sr/Fe] measurements. This was particularly the case when the Sr feature was strong.
The effect of hyperfine splitting (hfs) on the derived abundance from the Ba ii 4554Å line was investigated following Norris, Ryan & Beers (1997). Two line lists were used: one that included hfs and isotopic components for Ba ii 4554Å, and one that did not. A comparison of abundances was made for a series of stellar parameters and [Ba/Fe] spanning the same range as for the RGB sample. Little difference () was found between the abundances obtained from the spectra with and without the inclusion of isotopes and hyperfine splitting.
4.1 Error Analysis
An error analysis was performed by varying the temperature, gravity, metallicity and microturbulence, and redetermining the abundances for several stars in both the R600 and R1200 samples. The parameters were varied by , , and .
The derived carbon abundance is dependent on the O abundance, which was taken from nd95 and Pancino 2003 when available. The oxygen abundance [O/Fe] was varied by and the spectrum synthesis was repeated to determine the error in [C/Fe] due to the possible uncertainty in the oxygen abundance. This error was then included in the final error of [C/Fe]. These individual errors were added in quadrature and gave a final error for the R600 data and for the R1200. As the nitrogen abundance determination was dependent on the adopted [C/Fe], the final [N/Fe] error also included the uncertainty in [C/Fe]. The errors in the N abundance were and for the R600 and R1200 data, respectively. The uncertainties in Sr and Ba abundances were determined to be and , and and .
In addition to the stellar parameters and oxygen abundance errors, a measurement uncertainty exists in the determination of the individual abundances. This was estimated by visual inspection of the quality of the fit for each star for carbon, nitrogen, strontium and barium, and combined with the general errors above. These uncertainties are listed for each star individually in Table 3 for the low resolution data and Table 4 for the R1200 ones.
4.2 Abundances of C, N, Sr and Ba
The low resolution (R600) abundance results are shown in Table 3. For all but one star in this data set the C abundance was found to be depleted (). The object with the highest C abundance was the CO-strong star ROA 179 with . Large overabundances in nitrogen were seen in C-depleted objects, and moderate enhancements of Sr and Ba were found. In general, the Ba enhancements were greater or equal to those for Sr, with . Figure 1 shows an example of low resolution spectra of the CO-strong star ROA 219 with the spectrum synthesis results.
Similar patterns to those found in the R600 data are also seen in the R1200 data (Table 4). Most stars are C depleted and enhanced in nitrogen. Sr and Ba abundances again show moderate enhancements with for the majority of stars.
The six stars for which both R600 and R1200 data were obtained (see Figure 2) show mean abundance differences (with the standard error of the mean), for [C/Fe], for [N/Fe], for [Sr/Fe], and for [Ba/Fe]. We will need to keep in mind the possibility of a systematic offset between the R600 and R1200 [Sr/Fe] values in the subsequent discussion.
4.3 Comparisons With Other Studies
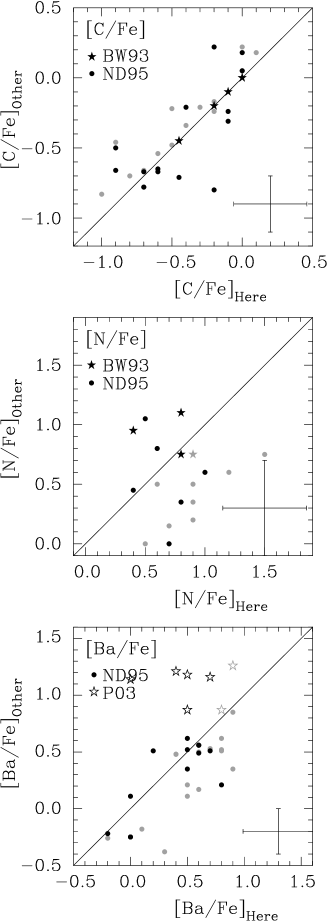
The abundances determined here can be compared with those in the literature for the same stars. ND95 determined [C/Fe] from the G band, [N/Fe] from the blue CN band and [Ba/Fe] from three lines (not including the one used here) for a large fraction of our sample. Although they did not observe Sr in their investigation of RGB stars, other light s-process elements such as yttrium and zirconium were included and these can be compared with the Sr abundances determined here for stars in common between the two studies. BW93 measured carbon (from the G band) and nitrogen (from the red CN band at 7950Å), among other elements, and have four stars in common (ROA 48, 74, 84, 213) with this study. The RGB stars with OC designations come from PAN03, and the results found here can be compared with the abundances of Ba, Y and Zr published there.
Figure 3 shows the comparisons between the present study on the one hand and ND95 and BW93, on the other, for [C/Fe] and [N/Fe]. The barium abundances were compared with those found in ND95 and PAN03 for stars in common. The R600 data show good agreement for the carbon abundances with ND95 and BW93. The mean abundance differences, in the sense this studyother study, were and for the one star in common. The R1200 data show a similar pattern where and . The nitrogen abundances determined from both the R600 and the bulk of the R1200 data show offsets to the ND95 study of and , respectively. Similar results are found when we compare our abundances with those of BW93 with for the one star in common in the R600 sample, and for the R1200 data, respectively. The reason for the offset of dex in [N/Fe] for the R600 data is probably due to the lower resolution of the data. As for [Sr/Fe], we need to keep in mind the possibility of a systematic offset between the R600 and R1200 [N/Fe] values in the subsequent discussions.
The barium abundances obtained from the R600 data are greater by and compared with other studies. This is most likely due to the low resolution of our data and the blended nature of the Ba ii 4554Å feature used for the analysis. The R1200 data show better agreement with ND95 with . The determination of [Ba/Fe] is somewhat easier for these spectra due to the reduced blending of the feature. From the four stars in common with PAN03 the barium abundances determined here for the R1200 data are lower by . As the same stellar parameters were used in both studies, the difference in abundance is most likely due to the differing nature of the analysis. Spectrum synthesis techniques were employed here for the Ba ii 4554Å line, while PAN03 used an equivalent width analysis and different lines.
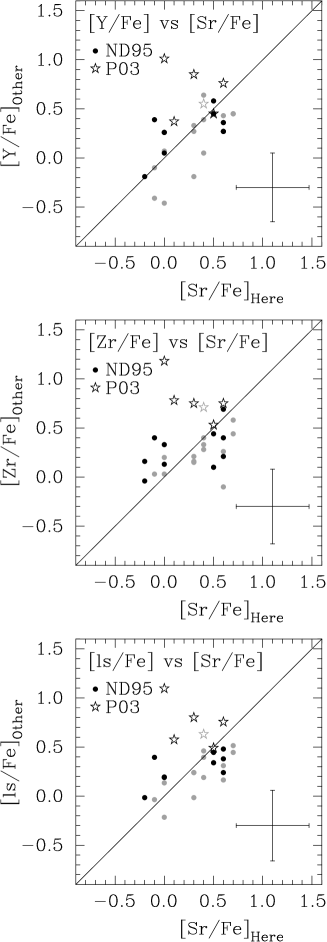
Figure 4 shows the comparison between the Sr abundances obtained here compared with [Y/Fe] and [Zr/Fe] obtained by ND95 and PAN03. The lower panels show the averaged [Y/Fe] and [Zr/Fe] abundances designated here as [ls/Fe]. The mean differences between the R600 dataother studies are and . The R1200 data show similar abundance patterns for Sr compared with the other light elements studied in ND95, with . The comparisons of the light s-process elements with PAN03 show similar to that found for the barium abundances.
4.4 Results
4.4.1 Carbon and Nitrogen
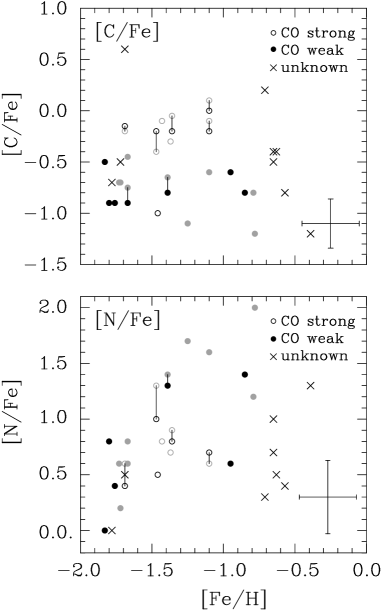
The carbon and nitrogen abundances for the R600 (grey points) and R1200 (black points) resolution data are shown as functions of metallicity in Figure 5. Objects in common between the R600 and R1200 data sets are joined by solid lines. The abundances have been plotted according to whether they are CO-strong (open circles) or weak (closed circles) following the convention of ND95. Crosses are plotted for which there is no information regarding their CO status. In general, a CO-strong star is found to have high [C/Fe] and relatively low [N/Fe]. Conversely, a CO-weak star shows low carbon abundances and high nitrogen ones.
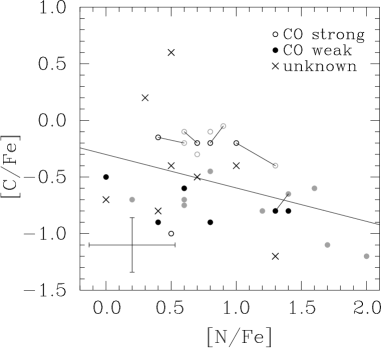
Figure 6 plots the carbon abundances against those of nitrogen for the R600 (grey dots) and R1200 (black dots) resolution data. Again, objects in common between the two data sets are joined by solid lines. An anticorrelation can be seen within the data, but there is no evidence for bimodality. A least squares fit was performed on the data, indicated by the solid line. The p-value for the least squares fit was 0.183, indicating some correlation but only a very moderate association between the carbon and nitrogen abundances222The p-value for the least squares fit indicates the probability that the sample was drawn from the population being tested given the assumption that the null hypothesis is true. A p-value of 1 gives an 100% probability of the null hypothesis being true, while a gives a 5% probability. In this case, the null hypothesis was that the [C/Fe] and [N/Fe] abundances were unrelated..
The RGB star ROA 279 is a known CH star (ND95). No previous carbon or nitrogen abundance determinations could be found in the literature for this object (ND95 analyzed lines of other elements but did not report carbon, nitrogen or oxygen abundances). The O abundance for ROA 279 is not known and as this has an impact on the derived C abundance, an analysis was performed to determined its effect. Using oxygen abundances in the range led to a spread in C of 0.8 dex, with . The oxygen abundance was assumed to be , and this led to and . The Sr and Ba abundances determined for ROA 279 were . Bell & Dickens (1974) analyzed two CH stars, ROA 55 and ROA 70, in Cen, and found , and assumed . Adopting for ROA 70 (Gratton, 1982), the carbon and nitrogen abundance ratios are and . While the abundance of C found here () for ROA 279 is less than these CH stars analyzed by Bell & Dickens (1974), it is still considerably higher than in other RGB stars in Cen, including the CO-strong objects. The enhancement of the s-process elements is comparable to that of the other CH stars, ROA 55 and 70 (Gratton, 1982), field CH stars and other stars with s-process enhancement in the cluster. The nitrogen abundances obtained, however, are over one dex different. This is an interesting discrepancy and warrants further investigation. The enrichment of C and s-process material in field CH stars is generally thought to come from mass transfer in binary systems (McClure & Woodsworth, 1990), and may be the case here as well.
4.4.2 Strontium and Barium
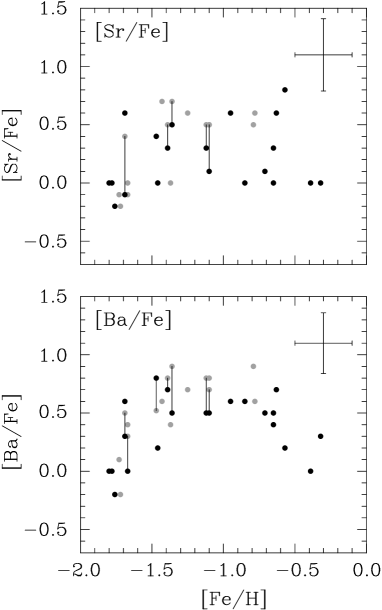
The Sr and Ba abundances are plotted as a function of metallicity in Figure 7 for both the R600 (grey) and R1200 (black) resolution data. The steep incline and then roughly constant value seen in the Ba abundance plot is similar to that seen in ND95. At higher metallicities a downward trend in the Ba abundances is also seen which is not present in other studies. These objects are the most metal-rich ones in our sample, and several come from the studies of PAN03. In §4.3 a comparison was made between the barium abundances determined here and those from PAN03. It was found that for stars in common [Ba/Fe] values determined here were lower than those found in PAN03 ( and ). This may account for the downward trend seen in the barium abundances at higher metallicities.
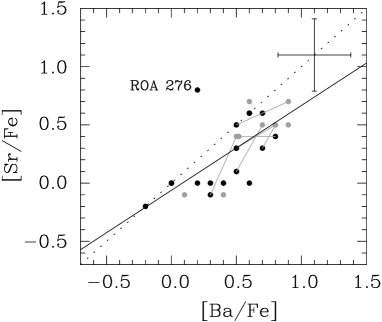
Figure 8 plots the strontium abundance against that of barium for the R600 (grey) and R1200 (black) resolution data. Objects in common between the two data sets are joined by a solid line. This plot shows a clear correlation between [Sr/Fe] and [Ba/Fe]. A one-to-one line is drawn for reference as a dotted line. A least squares fit was performed on the data, indicated by the solid line. The p-value for the least squares fit was , indicating a very high probability that there is a correlation between the strontium and barium abundances333 In this case, the null hypothesis was that the [Sr/Fe] and [Ba/Fe] abundances were unrelated..
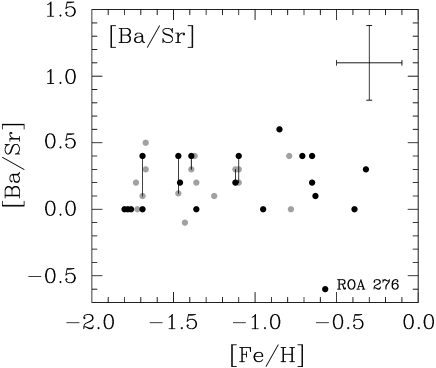
The ratio of the heavy s-process elements (e.g. Ba) to light ones (e.g. Sr) gives an indication of the level of neutron exposure, with a higher value indicating a higher exposure. Figure 9 plots the ratio [Ba/Sr], designated here as [hs/ls], as a function of [Fe/H]. Most objects have , with one exception, ROA 276, described in more detail in the following section. This star shows the surprisingly low value .
4.4.3 ROA 276
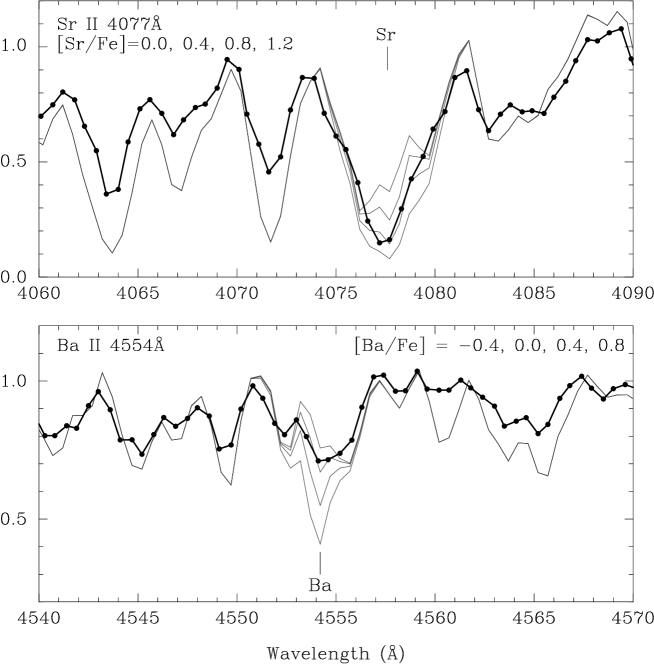
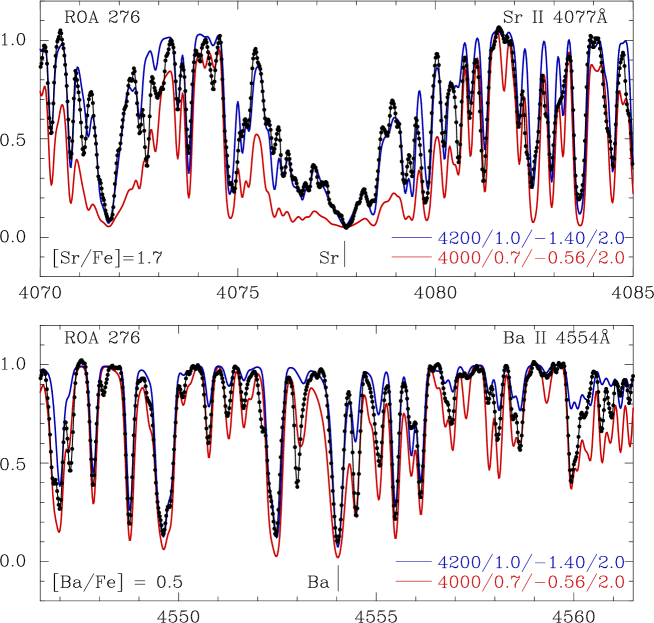
While most stars in the sample had measured [Ba/Fe] equal to or greater than [Sr/Fe], ROA 276 deviates from this general trend with significantly larger [Sr/Fe] than [Ba/Fe], as seen in Figure 8. The reader may recall that a similar [Ba/Sr] ratio was found before in the Cen main sequence star S2015448, described in Stanford et al. (2006b). ROA 276 is metal rich with , has depleted carbon (), and enhanced nitrogen (). The observed and synthetic spectra in the region of Sr ii 4077Å and Ba ii 4554Å are shown in Figure 10.
The stellar parameters for this object were derived by interpolation of and given its metallicity converted from [Ca/H] (NFM96) as described in §3. When analyzing the Sr ii 4077Å feature in the observed spectra it was noticed that many of the neighboring lines were too strong, indicating the metallicity was too high or the temperature too low. By decreasing the metallicity to , and redetermining the temperature to be 4200K (as opposed to 4000K), an improved fit to these lines was found. The effect this had on the abundances was to increase [Sr/Fe] from 0.8 to 1.8 and [Ba/Fe] from 0.2 to 0.6. Despite the change in stellar parameters the unusual [Ba/Sr] ratio is still present. Although the original stellar parameters and abundances have been recorded in each of Tables 3 and 4, it should be kept in mind that the temperature and metallicity have been estimated and require more accurate determination. Further analysis of this object is required to accurately determine its stellar parameters and to confirm the s-process abundance pattern found here.
As a consequence of the abundance result obtained with the intermediate resolution spectra, higher resolution data were obtained for ROA 276 along with two other Cen RGB stars, ROA 46 and ROA 150. These data were obtained with the Magellan (Clay) telescope/mike echelle spectrograph combination (see http://www.ucolick.org/rab/MIKE/usersguide.html) during 2007 Jun 22—23. We used a 0.5” slit and resolving power of 47 000. The resolution of the data are 0.12Å FWHM. Here we concentrate on the wavelength regions 4065–4085Å and 4545–4565Å to cover the Sr ii 4077Å line and the Ba ii 4554Å one. Hyperfine splitting for the Ba ii 4554Å line was taken into account and followed the s-process abundance pattern from Arlandini et al. (1999).
The synthetic spectra were produced using the models and linelists employed for the 2.3m spectra as described in §4. As mentioned previously, the stellar parameters are not well known for ROA 276. Synthetic spectra produced using the parameters determined above (, , ) did not match the observed spectra very well with the lines produced in the synthetic spectra being deeper than those observed. To illustrate this point, in Figure 11 we compare the observed mike high resolution data for both Sr II 4077Å (upper panel) and Ba II 4554Å (lower panel) with the synthetic spectra having stellar parameters (, , ) and (, , ) in both panels.
To test the robustness of the results based on the stellar parameters, synthetic spectra were produced with a range in temperature and metallicity (surface gravity corresponded to the temperature based on the star’s position in the CMD). Four effective temperatures (), and three metallicities () were used. The [Ba/Sr] ratio ranges between and for each of these models. As shown in Table 6 [Ba/Sr] is largely independent of the input stellar parameters. More accurate stellar parameters will be determined in a forthcoming paper where the red high resolution mike data are analyzed and results presented.
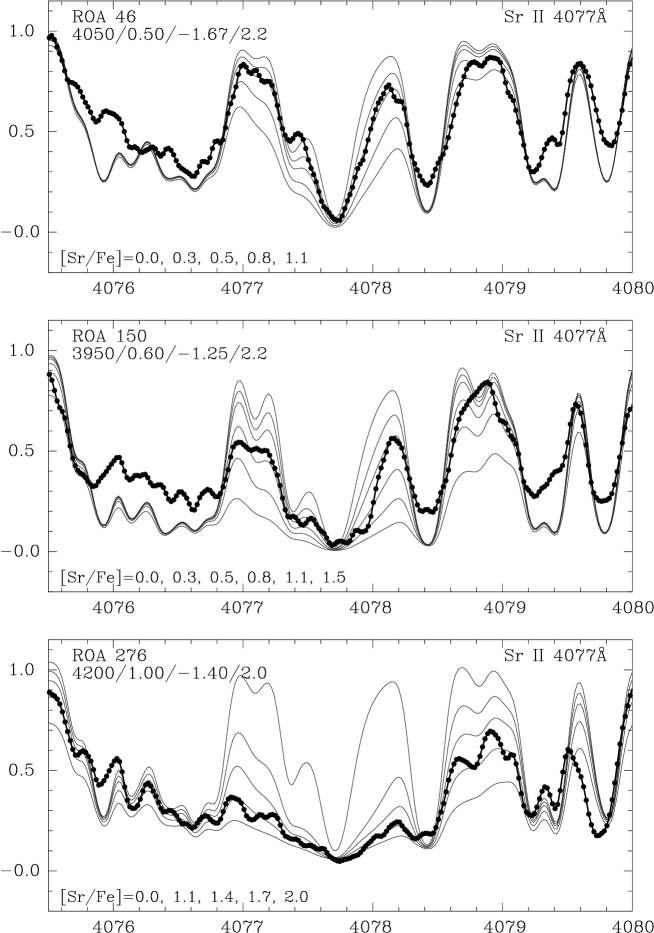
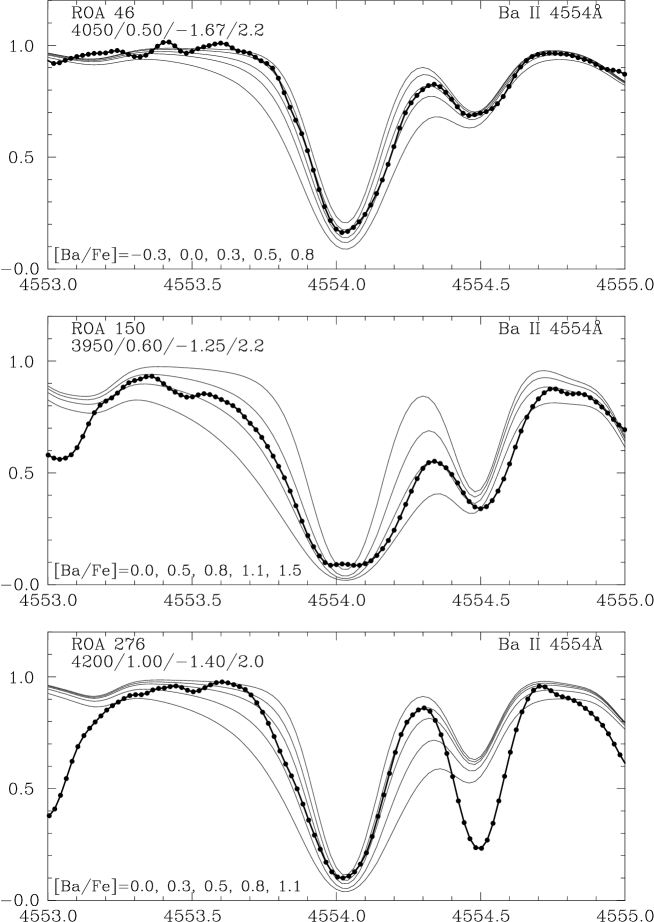
Figure 12 shows the Sr 4077Å line for ROA 40 (panel a), 150 (panel b) and 276 (panel c). The results for the Ba 4554Å line are shown for all three stars in Figure 13 (for ROA 150, one will notice a flat-bottom in the line profile for the Ba 4554Å line. The exact cause of this is unclear, but it is suspected to be due to saturation effects). For comparison, in both figures a synthetic spectrum with stellar parameters , , and have been plotted for a range of [Sr/Fe] and [Ba/Fe] values against the observed ROA 276 one. These were chosen as they gave the best fit to the observed spectra. Table 7 lists the [Sr/Fe] and [Ba/Fe] results for each of the three stars as well as the [Ba/Sr] abundance. It is clear from the mike high resolution data that ROA 276 has an unusual [Ba/Sr] ratio, and that further study of this star is warranted.
5 Discussion
The abundances found for the RGB stars here can not only provide information about enrichment sources for these stars, but also by comparing the abundances with those found for the main sequence and turnoff, further constraints can be derived. Comparing the MSTO and RGB abundance patterns may also show how these enrichments originated — that is, whether they are primordial, evolutionary or the material was accreted onto the surface layers of the stars.
As a star ascends the RGB, the convective envelope deepens considerably and material that was processed via the CN cycle in the interior of the star is possibly mixed to the surface layers (see Sweigart & Mengel 1979). This would result in less carbon and more nitrogen when compared with earlier evolutionary stages, with the overall C+N abundance remaining constant. In this instance the abundances of the s-process elements are not changed. The level of mixing, if any, on the RGB is, however, uncertain. In some globular clusters there is evidence of mixing as stars ascend the RGB as the carbon and nitrogen abundances are different from the MS level compared with those at the tip of the RGB (Langer et al., 1986; Briley et al., 2002). An example of such a cluster is M13 (Smith & Briley 2006, and references therein). It shows chemical inhomogeneities for elements C through to Al, and is a result of a primordial abundance spread, coupled with mixing on ascent of the RGB. On the other hand, other globular clusters, such as 47 Tuc show no difference in the abundance patterns of carbon and nitrogen between the MS and RGB (Cannon et al, 1998; Briley et al., 2004; Da Costa et al., 2004).
A competing factor to the mixing process is the enhancements of carbon, nitrogen and s-process elements in stars on the MSTO of Cen. These enhancements arose either from primordial enrichment (the enhanced material is uniform throughout the star’s interior) or accretion events (the enhanced material is in the surface layers only). In the case of the enhanced material being accreted, as a star ascends the RGB, the convective envelope deepens and the enhanced material is mixed with unenhanced material. This results in a dilution of the enhanced material which may include carbon, nitrogen and s-process elements. Alternatively, if the material is uniform throughout the star, the same abundances for the MSTO and RGB stars should be observed. That said, the evolutionary mixing, described above, adds a further complication to the picture and must be taken into consideration when attempting to decipher the differences between the MSTO and RGB.
Another type of mixing to take into consideration is thermohaline mixing (Kippenhahn, Ruschenplatt & Thomas, 1980; Charbonnel & Zahn, 2007). This process involves mixing of material that has been accreted when the mean molecular weight of the stellar gas increases towards the surface of the star. The gas is displaced downwards and compressed, making it hotter than its surroundings. This in turn makes it lose more heat, become denser and continue to sink. This then leads to mixing on thermal timescales. Stancliff & Glebbeek (2008) estimate thermohaline processes mixing the accreted material with 16—88% of the pristine gas. This, however, was for a model of a star with () whereas most of the enhanced stars are more metal-rich than this by at least one dex. Therefore the difference in mean molecular weight is smaller, and thermohaline mixing to be less efficient. Several other studies have found the thermohaline process to be less efficient that first thought. In a comparison between turnoff stars and red giants, Aoki et al. (2008) showed that the distribution of [C/Fe] was different between the two sets, suggesting significant mixing only occurs at the first dredge-up. Denissenkov & Pinsonneault (2008) reach a similar conclusion using the data from Lucatello et al. (2006), where they found the [C/H] reduced by resulting from the first dredge up.
It is interesting to estimate the dilution factor — the amount surface pollution is diluted as the convective envelope deepens on ascent of the RGB. This factor depends on the metallicity and mass of the star (Yoshii, 1981) as these influence the mass fraction of the convective envelope on the MS and RGB. The convective envelope mass faction increases for increasing metallicity, and decreasing stellar mass.
The dilution factor can then be calculated, given by the following equation:
| (2) |
where is the abundance of element X in the surface layers before dilution, is the abundance of element X on the RGB after dilution, and the mass fractions of the convective envelope on the MS and RGB are represented by and , respectively. The interior of the MS star is assumed to have a solar abundance ratio of [X/Fe]. Using the convective envelope mass fractions of and for an star with initial metallicity and enhanced (D. VandenBerg 2009, private communication), the depletion factor is found to be . Using envelope mass fractions for lower metallicity stars, larger mass stars, or lower enhancement all result in greater depletion values. The models of Girardi (2009, priv communication) give similar results. This dilution factor indicates that any surface contamination would be diluted to a large degree, although still measurable on the RGB. The inclusion of thermohaline mixing would only serve to increase the abundance one would find on the MS using the RGB abundance ratios.
There are several possible enrichment sources for the enhancements. One possibility is low mass () AGB stars, the products of which are carbon and s-process elements (Gallino et al., 1998). Intermediate mass (3 ) AGB stars may also play a role, producing nitrogen and perhaps a small amount of s-process elements (depending on the size of the 13C pocket) (Ventura et al., 2002). Massive stars may also contribute to the enrichment, in particular massive rotating objects. These produce excess helium and nitrogen in their stellar winds without carbon and oxygen overabundances (Maeder & Meynet, 2006). These stars may be able to account for the abundances found on the RGB.
Those objects with near solar abundance ratios of carbon and supersolar s-process element enrichment have possibly been enriched by low mass AGB stars. Yet objects with enrichment in nitrogen are more consistent with enhancement from intermediate mass AGB stars. As many of the nitrogen enhanced objects also show enrichment in s-process elements several different sources may be required to explain the observed abundance patterns. In these cases, rotating, massive stars may account for the N abundance patterns, while low mass AGB stars could be the source of the s-process enhancements. As yet s-process element abundance yields for rotating, massive stars have not been published and therefore definitive conclusions regarding the enhancement sources of enriched nitrogen and strontium RGB stars cannot be made.
5.1 Comparison of abundances on the MSTO and RGB
The RGB stars studied here do not have carbon abundances greater than , except for the CH star ROA 279 (), while few MSTO stars show depletions and several show enhancements (). Consequently, the low [C/Fe] values on the RGB may be due to the evolutionary effects during ascent of the RGB involving processing of C into N. It should be kept in mind, however, that our ability to measure the C abundance for for the metal-poor and intermediate metallicity MSTO stars is not high; therefore detailed comparisons, for example as a function of [Fe/H], are not easily made.
Apart from the CH star ROA 279, many RGB stars are carbon depleted as would be expected from convective mixing during ascent of the RGB. However, inspection of Fig. 6 shows a significant number of stars with , which were previously found in ND95 (the CO-strong objects of Persson et al. (1980)), and in comparison with other globular clusters these objects are unique. ND95 provided three possible explanations for the carbon abundances of these stars: (1) They are only found in Cen due to the larger number of stars sampled in this cluster; (2) carbon depletion as a star ascends the RGB does not occur for all stars; and (3) depletion does occur in all stars, and the initial carbon abundance of those objects with near solar [C/Fe] was considerably higher than for the bulk of the population before its ascent of the RGB.
The carbon results found on the main sequence and turnoff are consistent with the third possibility. The MSTO objects were found to have enhancements of for of stars (see Table 3, Stanford et al. (2007)). ND95 suggest, in their consideration of the unbiased samples of Persson et al. (1980) and Cannon & Stobie (1973) that within 1 mag of the tip of the RGB in Cen of the stars are CO-strong. As we do not find stars with carbon enhancements as great as those found at the MSTO on the upper RGB (except for the four CH stars), mixing to some degree must have occurred during the ascent of the RGB and resulted in objects with carbon abundances higher than found in the bulk of the main RGB population (i.e. ). ND95 reported depletion of carbon at the RGB tip in the range dex, supporting the above result. Therefore, the carbon rich objects on the MSTO could be the evolutionary precursors to the CO-strong stars on the RGB.
On inspection of Figure 6 it can be seen that those stars with the greatest depletions of carbon have the greatest enhancements of nitrogen. Those with near solar carbon abundance ratios have more modest nitrogen enhancements. This may be accounted for if the amount of evolutionary mixing a star goes though is not the same for every star for a given mass and metallicity. Main sequence objects, on ascent of the RGB, may have processed little C into N resulting in RGB stars with near solar [C/Fe], and moderate N enhancements. Alternatively, they may have processed a more substantial amount of carbon resulting in objects with low carbon abundances (, and large nitrogen enhancements. Nitrogen enhancements on the RGB show high . This may be due to two sources. The first is primordial enrichment, the second CN cycling and mixing as the star ascends the RGB.
5.1.1 Carbon rich stars
Two main sequence C-enhanced stars, S7007334 () and S9005309 (), were identified in Stanford et al. (2007) that may be the counterparts to the RGB CH stars in the cluster. They show enhancements in [C/Fe] greater than those found for the CH star ROA 279 () by 0.6 dex. These MS stars show no nitrogen or s-process enhancements that CH stars usually exhibit, although this may be due to the low sensitivity of our technique to these features at MS metallicities and temperatures.
On the subgiant branch (SGB), the star S8001811 (Stanford et al., 2007) is worthy of mention. Its carbon, nitrogen and strontium abundance pattern (, , ) is similar to that seen in the CH star ROA 279. This SGB object may be a precursor of the RGB CH stars in Cen, and a counterpart of the field “subgiant CH” stars of Luck & Bond (1991).
5.1.2 Nitrogen and s-process enhanced stars
There exists a number of metal-rich stars () on the MSTO that show enhancements in both nitrogen and s-process elements, together with low carbon, (, , ) (Stanford et al., 2007). On the RGB, ROA 480 shows similar abundance patterns and is of similar metallicity with . With , its carbon abundance is depleted by a larger amount than that of the MSTO group. This difference may be due to the carbon having been processed into nitrogen as ROA 480 ascended the RGB. ROA 480 (with , ) has lower nitrogen and strontium than found for the MSTO group. These abundance patterns with low carbon, and enhanced nitrogen and strontium are also seen at lower metallicities. For example, ROA 84 () and a star on the main sequence, S5004811 (), share similar abundances in carbon and nitrogen. Both have carbon abundances of , and high nitrogen ( and ). These abundances agree within the errors of measurement. The s-process enhancements have somewhat different values, with and . ND95 give high resolution abundances for both ROA 84 and 480 which are consistent with these results. For ROA 84 , and (where [s/Fe] is the average values of [Y/Fe] and [Zr/Fe]), while for ROA 480 , and .
The upper levels of nitrogen enhancements on the MSTO and RGB are similar, with . This may indicate that enhanced N abundances are driven more by a phenomenon that is induced in the cluster as a whole. The upper limit on nitrogen enhancements may also indicate that mixing on ascent of the RGB does not occur to the same extent for all stars. If it did, then higher [N/Fe] abundances should be measured for objects on the RGB than for those on the MSTO as an increase in nitrogen occurs in the CN cycle (although given the errors of measurement a difference in the measured abundance between the MSTO and RGB may not be reliable). However, this makes the assumption that the enriched material on the MSTO is uniform throughout the star. In the case where MSTO objects have accreted material onto their surface layers, on ascent of the RGB the convective envelope deepens and dilution of the N enhanced material occurs. Coupled with this is the increase in [N/Fe] due to internal processing and mixing. As the two scenarios (primordial or accretion event) cannot be differentiated due to the complication of mixing on the ascent of the RGB, abundances of elements not effected by this process need to be investigated and compared at the different evolutionary stages. An example of such an element is Sr, and a comparison of the Sr abundances found for MSTO and RGB stars is described in the following section.
5.1.3 S2015448 & ROA 276
As noted in §4.4, ROA 276 stood out against all other members of our RGB sample. For our initial adopted metallicity of , we obtained from our high-resolution mike spectra (see Table 6). (We also found in §4.4.3 that this value is quite insensitive to uncertainties in atmospheric parameters). In contrast, the [Ba/Fe] value was found to be equal to or greater than [Sr/Fe] for every other star analyzed.
This low [Ba/Sr] value for ROA 276 is similar to that found for the main sequence star S2015448 (Stanford et al., 2006b), which has , and , as may be seen in Table 7. While the relative frequencies of such large Sr enhancements on the MSTO and RGB are not well determined, and must await further work, the existence of such objects on both the MS and RGB places an important constraint on the origin of the enhancement. Specifically, unless accretion provides a large fraction of the mass of the observed star, a primordial origin of the enhancement is the more likely explanation for the anomaly. That is to say, if the Sr enhancement in S2015448 is confined only to its small convective outer region following accretion of only a small fraction of the star’s mass, convective dilution, as described by equation 6.2, will lead to a reduced relative abundance, , when it reaches the RGB. Conversely (and perhaps more to the point), given the same assumptions, one would conclude that ROA 276 would have had the enormous value, , when it was on the main sequence if it was surface contaminated rather than primordially enhanced. While not outside the realms of possibility, this is unlikely.
This argument can be applied to many of the stars on the RGB with s-process enhancements (the carbon and nitrogen abundances are complicated by evolutionary mixing abundance changes) similar to those found at the MSTO (to within errors of measurement). The abundance enhancements seen in these stars are unlikely to have been surface accretion phenomenon unless the mass accreted is very substantial. For example, ROA 279 with on the RGB would have a carbon abundance of on the MS. No stars with such a high carbon abundance ratio were found on the MS.
6 Conclusions
Abundances of C, N and the s-process elements Sr and Ba were determined for a biased sample of 33 RGB stars in Cen. Almost all objects show depletion of carbon, and solar or enhanced nitrogen. The abundances of Sr and Ba show enhancement as well. One of the known CH stars in Cen has been analyzed for the first time for carbon and nitrogen, resulting in , and . This star is less enhanced in carbon compared with other CH stars in the cluster, but still has considerable enhancement in carbon compared with other RGB stars.
The levels of N enhancement on both the MS and RGB reach similar relative abundances, . This may indicate that mixing on the RGB occurs to different extents for individual stars.
A RGB star with high enhancement of the light s-process element Sr was
found, but with little enhancement in Ba. This star is similar to the
strongly Sr-enhanced MS object, S2015448 (Stanford et al., 2006b) from which the
conclusion is reached that the Sr enhancement is likely to be
primordial in origin, rather than the result of some accretion event.
Acknowledgments
We wish to thank Don VandenBerg and Leo Girardi for providing unpublished details from their models. Australian access to the Magellan Telescopes was supported through the Major National Research Facilities II program of the Australian Government. We thank the referee for their comments which led to improvements in the manuscript. LMS wishes to thank K. Ward for advice on statistical calculations.
Facilities: ANU:SSO2.3m(DBS); Magellan:Clay(MIKE)
References
- Aoki et al. (2008) Aoki, W., Beers, T. C., Sivarani, T., Brian, M., Lee, Y. S., Honda, S., Norris, J. E., Ryan, S. G., & Carollo, D. 2008, ApJ, 678, 1351
- Arlandini et al. (1999) Arlandini, C., Käppeler, F., Wisshak, K., Gallino, R., Lugaro, M., Busso, M., & Straniero, O. 1999, ApJ, 525, 886
- Anders & Grevesse (1989) Anders, E., & Grevesse, N. 1989, GeCoA, 53, 197
- Bell & Dickens (1974) Bell, R. A., & Dickens, R. J. 1974, MNRAS, 166, 89
- Briley et al. (2002) Briley, M. M., Cohen, J. G., Stetson, P. B. 2002, ApJ, 579, 17
- Briley et al. (2004) Briley, M. M., Harbeck, D., Smith, G. H., Grebel, E. K. 2004, AJ, 127, 1588
- Brown & Wallerstein (1993) Brown, J. A., & Wallerstein, G. 1993, AJ, 106, 133, (BW93)
- Cannon et al (1998) Cannon, R. D., Croke, B. F. W., Bell, R. A., Hesser, J. E., & Stathakis, R. A. 1998, MNRAS, 298, 601
- Calamida et al. (2009) Calamida, A., Bono, G., Stetson, P. B., Freyhammer, L. M., Piersimoni, A. M., Buonanno, R., Caputo, F., Cassisi, S., Castellani, M., Corsi, C. E., Dall’Ora, M., Degl’Innocenti, S., Ferraro, I., Grundahl, F., Hilker, M., Iannicola, G., Monelli, M., Nonino, M., Patat, N., Pietrinferni, A., Prada Moroni, P. G., Primas, F., Pulone, L., Richtler, T., Romaniello, M., Storm, J & Walker, A. R. 2009, ApJ, 706, 1277
- Cannon & Stobie (1973) Cannon, R. D., & Stobie, R. S. 1973, MNRAS, 162, 207
- Charbonnel & Zahn (2007) Charbonnel, C., & Zahn, J. P. 2007, A&A, 467, L15
- Cottrell & Norris (1978) Cottrell, P. L., & Norris, J. 1978, ApJ, 221, 893
- Cunha et al. (2002) Cunha, K., Smith, V. V., Suntzeff, N. B., Norris, J. E., Da Costa, G. S., & Plez, B. 2002, AJ, 124, 379
- Da Costa et al. (2004) Da Costa, G. S., Cannon, R., Croke, B., & Norris, J. E. 2004, Mem. Ital. Astro. Soc. 75, 370
- Denissenkov & Pinsonneault (2008) Denissenkov, P. A., & Pinsonneault, M. 2008, ApJ, 684, 626
- Gallino et al. (1998) Gallino, R., Arlandini, C., Busson, M., Lugaro, M., Travaglio, C., Straniero, O., Chieffi, A.,& Limongi, M. 1998, ApJ, 497, 388
- Gratton (1982) Gratton, R. G. 1982, A&A, 115, 336
- Iben (1965) Iben, I. 1965, ApJ, 143, 642
- Iben & Renzini (1983) Iben, I. Jr., & Renzini, A. 1983, ARA&A, 21, 271
- Johnson et al. (2008) Johnson, C. I., Pilachowski, C. A., Simmerer, J., & Schwenk, D. 2008, ApJ, 681, 1505
- Johnson et al. (2009) Johnson, C. I., Pilachowski, C. A., Rich, M., & Fullbright, M. 2009, ApJ, 698, 2408
- Kayser et al. (2006) Kayser, A., Hilker, M., Richtler, T., & Willemsen, P. G. 2006, A&A, 458, 777
- Kippenhahn, Ruschenplatt & Thomas (1980) Kippenhahn, R., Ruschenplatt, G., & Thomas, H. C. 1980, A&A, 91 175
- Kurucz (1993) Kurucz, R. 1993, CD-ROM 13, ATLAS9 Stellar Atmosphere Programs and 2 km/s Grid (Cambridge: SAO), 13
- Langer et al. (1986) Langer, G. E., Kraft, R. P., Carbon, D. F., Friel. E., & Oke, J. B. 1986, PASP, 98, 473
- Lee et al. (1999) Lee, Y.-W., Joo, J.-M., Sohn, Y.-J., Rey, S.-C., Lee, H.-C., Walker, A. R. 1999, Nature, 402, 55
- Lucatello et al. (2006) Lucatello, S., Beers, T. C., Christleib, N., Barklem, P. S., Rossi, S., Marsteller, B., Sivarani, T., & Lee, Y. S. 2006, ApJ, 652, L37
- Luck & Bond (1991) Luck, R. E., & Bond, H. E. 1991, ApJS, 77, 515
- McClure & Woodsworth (1990) McClure, R. D., & Woodsworth, A. W. 1990, ApJ, 352, 709
- Maeder & Meynet (2006) Maeder, A., & Meynet, G. 2006, A&A, 448, L37
- Mayor et al. (1996) Mayor, M., Duquennoy, A., & Udry, S. 1996, in Milone, E. F., & Mermilliod, J. C., eds, ASP Conf. Ser. Vol. 90, The Origins, Evlolutions, and Destinies of Binary Stars in Clusters. Astron. Soc. Pac., San Francisco, p190
- Norris & Da Costa (1995b) Norris, J. E., & Da Costa, G. S. 1995a, ApJ, 441, L81
- Norris & Da Costa (1995a) Norris, J. E., & Da Costa, G. S. 1995b, ApJ, 447, 680 (ND95)
- Norris, Freeman & Mighell (1996) Norris, J. E., Freeman, K. C., & Mighell, K. J. 1996, ApJ, 462, 241
- Norris, Ryan & Beers (1997) Norris, J. E., Ryan, S. G., & Beers, T. C. 1997, ApJ, 488, 350
- Pancino et al. (2000) Pancino, E., Ferraro, F. R., Bellazzini, M., Piotto, G., & Zoccali, M. 2000, ApJ, 534, 83
- Pancino et al. (2002) Pancino, E., Pasquini, L., Hill, V., Ferraro, F. R., Bellazzini, M. 2002, ApJ, 568, L101
- Pancino (2003) Pancino, E. 2003, PhD Thesis, “Multiple Stellar Populations in Centauri”, University of Bologna, Italy (PAN03)
- Persson et al. (1980) Persson, S. E., Frogel, J. A., Cohen, J. G., Aaronson, M., & Matthews, K. 1980, ApJ, 235, 452
- Piotto et al. (2005) Piotto, G., Villanova, S., Bedin, L. R., Gratton, R., Cassisi, S., Momany, Y., Recio-Blanco, A., Lucatello, S., Anderson, J., King, I. R., Pietrinferni, A., Carraro, G. 2005, ApJ, 621, 777
- Rey et al. (2004) Rey, S.-C., Lee, Y.-W., Ree, C. H., Joo, M.-J., & Sohn, Y.-J. 2004, AJ, 127, 958
- Smith & Briley (2006) Smith, G. H., & Briley, M. M. 2006, PASA, 118, 740
- Smith et al. (1995) Smith, V. V., Cunha, K., & Lambert, D. 1995, AJ, 110, 2827
- Smith et al. (2000) Smith, V. V., Suntzeff, N., Cunha, K., Gallino, R., Busso, M., Lambert, D., & Straniero, O. 2000, AJ, 119, 1239
- Sollima et al. (2005) Sollima, A., Ferraro, F. R., Pancino, E., & Bellazzini, M. 2005, MNRAS, 357, 265
- Stancliff & Glebbeek (2008) Stancliff, R. J., & Glebbeek, E. 2008, MNRAS, 389, 1828
- Stanford et al. (2006a) Stanford, L. M., Da Costa, G. S., Norris, J. E., & Cannon, R. D. 2006, ApJ, 647, 1075
- Stanford et al. (2006b) Stanford, L. M., Da Costa, G. S., Norris, J. E., & Cannon, R. D. 2006, ApJ, 653L, 117
- Stanford et al. (2007) Stanford, L. M., Da Costa, G. S., & Norris, J. E. 2007, ApJ, 667, 911
- Suntzeff & Kraft (1996) Suntzeff, N. B., & Kraft, R. P. 1996, AJ, 111, 1913
- Sweigart & Mengel (1979) Sweigart, A. V., & Mengel, J. G. 1979, ApJ, 229, 624
- van Leeuwen (2000) van Leeuwen, F., Le Poole, R. S., Reijns, R. A., Freeman, K. C., & de Zeeuw, P. T. 2000, A&A, 360, 472
- Ventura et al. (2002) Ventura, P., D’Antona, F., & Mazzitelli, I. 2002, A&A, 393, 215
- Villanova et al. (2007) Villanova, S., Piotto, G., King, I. R., Anderson, J., Bedin, L. R., Gratton, R. G., Cassisi, S., Momany, Y., Bellini, A., Cool, A. M., Recio-Blanco, A., Renzini, A. 2007, ApJ, 663, 296
- Woolley et al. (1966) Woolley, R. v. d. R., et al. 1996, R. Obs. Ann., No 2
- Yoshii (1981) Yoshii, Y. 1981, A&A, 97, 280
| Grating | Date | Star ID |
|---|---|---|
| (1) | (2) | (3) |
| 600 I | May 2005 | ROA: 24, 40, 43, 46, 53, 58, 84, 132, 150, 159 |
| ROA: 162, 171, 179, 219, 248, 252, 253, 371 | ||
| 1200 I | Feb/Jun 2002 | ROA: 40, 42, 43, 46, 48, 55, 65, 74, 84, 94 139 |
| ROA: 159, 179, 201, 213, 219, 253, 276, 279, 300 | ||
| ROA: 324, 336, 357, 425, 447, 477 , 480, 517, | ||
| OC: 140419, 222068, 230189, 242056, 250606, 263340 | ||
| OC: 305654, 312058, 321293, 618774, 801639 |
| ID | V11NFM96 and references therein; Pancino (2003) | B–V22van Leeuwen (2000), Pancino (2003) | Teff | log | [Fe/H] | Vt | source33Source: ND95 (1); PFCAM (2); NFM96 (3); Pancino (2003) (4); This study (5) |
|---|---|---|---|---|---|---|---|
| ROA 40 | 11.37 | 1.48 | 4200 | 0.5 | –1.69 | 2.3 | 1 |
| ROA 42 | 11.64 | 1.49 | 4150 | 0.5 | –1.69 | 2.0 | 1 |
| ROA 43 | 11.62 | 1.62 | 3950 | 0.4 | –1.47 | 2.1 | 1 |
| ROA 46 | 11.54 | 1.55 | 4050 | 0.5 | –1.67 | 2.2 | 1 |
| ROA 48 | 11.51 | 1.58 | 4050 | 0.5 | –1.76 | 2.5 | 1 |
| ROA 53 | 11.58 | 1.64 | 3950 | 0.4 | –1.67 | 2.3 | 1 |
| ROA 58 | 11.67 | 1.43 | 4200 | 0.6 | –1.73 | 2.2 | 1 |
| ROA 65 | 11.61 | 1.50 | 4050 | 0.6 | –1.72 | 2.1 | 1 |
| ROA 74 | 11.78 | 1.37 | 4250 | 0.7 | –1.80 | 2.2 | 1 |
| ROA 84 | 11.87 | 1.66 | 3900 | 0.5 | –1.36 | 1.9 | 1 |
| ROA 94 | 11.80 | 1.39 | 4200 | 0.7 | –1.78 | 2.1 | 1 |
| ROA 132 | 12.05 | 0.87 | 3900 | 0.3 | –1.37 | 2.2 | 1 |
| ROA 139 | 11.98 | 1.45 | 4150 | 0.8 | –1.46 | 1.6 | 1 |
| ROA 150 | 12.00 | 1.69 | 3950 | 0.6 | –1.25 | 2.2 | 1 |
| ROA 159 | 12.04 | 1.34 | 4300 | 0.9 | –1.72 | 2.0 | 1 |
| ROA 162 | 12.14 | 3950 | 0.7 | –1.10 | 2.1 | 1 | |
| ROA 171 | 12.07 | 1.47 | 4100 | 0.7 | –1.43 | 1.9 | 1 |
| ROA 179 | 12.21 | 1.65 | 3850 | 0.5 | –1.10 | 1.5 | 1 |
| ROA 213 | 12.22 | 1.12 | 4500 | 1.1 | –1.83 | 1.9 | 1 |
| ROA 219 | 12.20 | 4000 | 0.7 | –1.10 | 2.2 | 1 | |
| ROA 248 | 12.43 | 1.70 | 3850 | 0.6 | –0.78 | 1.6 | 1 |
| ROA 252 | 12.30 | 1.20 | 4400 | 1.1 | –1.74 | 2.0 | 1 |
| ROA 253 | 12.34 | 1.37 | 4300 | 1.0 | –1.39 | 1.9 | 1 |
| ROA 276 | 12.37 | 1.38 | 4000 | 0.7 | –0.57 | 2.0 | 3,5 |
| ROA 279 | 12.32 | 4350 | 1.1 | –1.69 | 2.0 | 1 | |
| ROA 300 | 12.71 | 1.68 | 3900 | 0.7 | –0.77 | 2.0 | 2,3 |
| ROA 324 | 12.59 | 1.54 | 4000 | 0.7 | –0.39 | 1.9 | 3,5 |
| ROA 357 | 12.69 | 1.43 | 4000 | 0.8 | –0.85 | 1.8 | 1 |
| ROA 371 | 12.68 | 1.61 | 4000 | 0.9 | –0.79 | 1.6 | 1 |
| ROA 425 | 12.73 | 3650 | 0.6 | –0.32 | 2.0 | 2,3 | |
| ROA 447 | 12.80 | 1.64 | 3700 | 0.7 | –0.18 | 2.0 | 2,3 |
| ROA 480 | 12.98 | 1.25 | 4350 | 1.3 | –0.95 | 1.8 | 1 |
| OC 140419 | 13.49 | 1.22 | 4200 | 1.5 | –0.65 | 2.0 | 4 |
| OC 263340 | 13.62 | 1.13 | 4400 | 1.9 | –0.63 | 1.2 | 4 |
| OC 305654 | 13.38 | 1.29 | 4200 | 1.6 | –0.65 | 1.4 | 4 |
| OC 321293 | 13.69 | 1.15 | 4300 | 1.6 | –0.71 | 1.4 | 4 |
| ID | [Fe/H] | Carbon | Nitrogen | Strontium | Barium | ||||||||
|---|---|---|---|---|---|---|---|---|---|---|---|---|---|
| ab11ab=[X/Fe], e=[X/Fe] | e11ab=[X/Fe], e=[X/Fe] | ab11ab=[X/Fe], e=[X/Fe] | e11ab=[X/Fe], e=[X/Fe] | ab11ab=[X/Fe], e=[X/Fe] | e11ab=[X/Fe], e=[X/Fe] | ab11ab=[X/Fe], e=[X/Fe] | e11ab=[X/Fe], e=[X/Fe] | ||||||
| ROA 40 | –1.69 | –0.20 | 0.24 | 0.6 | 0.31 | 0.3 | 0.36 | 0.5 | 0.32 | ||||
| ROA 43 | –1.47 | –0.30 | 0.24 | 1.2 | 0.38 | 0.4 | 0.36 | 0.5 | 0.18 | ||||
| ROA 46 | –1.67 | –0.70 | 0.24 | 0.5 | 0.38 | 0.0 | 0.44 | 0.3 | 0.32 | ||||
| ROA 53 | –1.67 | –0.40 | 0.29 | 0.7 | 0.38 | –0.1 | 0.44 | 0.4 | 0.32 | ||||
| ROA 58 | –1.73 | –0.80 | 0.29 | 0.6 | 0.31 | –0.1 | 0.36 | 0.1 | 0.32 | ||||
| ROA 84 | –1.36 | –0.10 | 0.24 | 0.9 | 0.35 | 0.7 | 0.28 | 0.9 | 0.18 | ||||
| ROA 132 | –1.37 | –0.50 | 0.29 | 0.9 | 0.35 | 0.0 | 0.31 | 0.4 | 0.22 | ||||
| ROA 150 | –1.25 | –1.00 | 0.24 | 1.5 | 0.38 | 0.6 | 0.28 | 0.7 | 0.18 | ||||
| ROA 159 | –1.72 | –0.50 | 0.24 | 0.2 | 0.38 | –0.2 | 0.44 | –0.2 | 0.41 | ||||
| ROA 162 | –1.10 | –0.60 | 0.24 | 1.5 | 0.38 | 0.3 | 0.36 | 0.8 | 0.22 | ||||
| ROA 171 | –1.43 | –0.20 | 0.29 | 0.9 | 0.31 | 0.7 | 0.28 | 0.6 | 0.22 | ||||
| ROA 179 | –1.10 | 0.10 | 0.24 | 0.35 | 0.5 | 0.28 | 0.8 | 0.18 | |||||
| ROA 219 | –1.10 | 0.00 | 0.24 | 0.5 | 0.31 | 0.4 | 0.28 | 0.7 | 0.18 | ||||
| ROA 248 | –0.78 | –1.00 | 0.29 | 1.8 | 0.38 | 0.6 | 0.31 | 0.6 | 0.18 | ||||
| ROA 253 | –1.39 | –0.70 | 0.24 | 1.4 | 0.31 | 0.4 | 0.36 | 0.8 | 0.32 | ||||
| ROA 371 | –0.79 | –0.90 | 0.29 | 1.4 | 0.35 | 0.4 | 0.31 | 0.9 | 0.27 | ||||
| ID | [Fe/H] | Carbon | Nitrogen | Strontium | Barium | ||||||||
|---|---|---|---|---|---|---|---|---|---|---|---|---|---|
| ab11ab=[X/Fe], e=[X/Fe] | e11ab=[X/Fe], e=[X/Fe] | ab11ab=[X/Fe], e=[X/Fe] | e11ab=[X/Fe], e=[X/Fe] | ab11ab=[X/Fe], e=[X/Fe] | e11ab=[X/Fe], e=[X/Fe] | ab11ab=[X/Fe], e=[X/Fe] | e11ab=[X/Fe], e=[X/Fe] | ||||||
| ROA 40 | –1.69 | –0.10 | 0.16 | 0.4 | 0.22 | –0.1 | 0.34 | 0.3 | 0.28 | ||||
| ROA 43 | –1.47 | –0.40 | 0.21 | 1.0 | 0.26 | 0.4 | 0.37 | 0.8 | 0.31 | ||||
| ROA 46 | –1.67 | –0.90 | 0.25 | 0.43 | 0.0 | 0.44 | |||||||
| ROA 48 | –1.76 | –0.80 | 0.18 | 0.4 | 0.43 | –0.2 | 0.40 | –0.2 | 0.44 | ||||
| ROA 65 | –1.72 | –0.60 | 0.18 | ||||||||||
| ROA 74 | –1.80 | –0.80 | 0.18 | 0.8 | 0.43 | 0.0 | 0.34 | 0.0 | 0.36 | ||||
| ROA 84 | –1.36 | –0.10 | 0.25 | 0.8 | 0.30 | 0.5 | 0.37 | 0.5 | 0.36 | ||||
| ROA 94 | –1.78 | –0.70 | 0.18 | 0.0 | 0.43 | 0.0 | 0.34 | 0.0 | 0.36 | ||||
| ROA 139 | –1.46 | –0.90 | 0.21 | 0.5 | 0.34 | 0.0 | 0.34 | 0.2 | 0.31 | ||||
| ROA 179 | –1.10 | 0.00 | 0.25 | 0.34 | 0.3 | 0.34 | 0.5 | 0.28 | |||||
| ROA 213 | –1.83 | –0.50 | 0.18 | 0.0 | |||||||||
| ROA 219 | –1.10 | –0.20 | 0.21 | 0.7 | 0.30 | 0.1 | 0.34 | 0.5 | 0.28 | ||||
| ROA 253 | –1.39 | –0.70 | 0.21 | 1.3 | 0.26 | 0.3 | 0.34 | 0.7 | 0.31 | ||||
| ROA 276 | –0.57 | –0.80 | 0.21 | 0.4 | 0.34 | 0.8 | 0.34 | 0.2 | 0.28 | ||||
| ROA 279 | –1.69 | 0.60 | 0.25 | 0.5 | 0.30 | 0.6 | 0.34 | 0.6 | 0.28 | ||||
| ROA 324 | –0.39 | –1.00 | 0.34 | 1.3 | 0.30 | 0.0 | 0.34 | 0.0 | 0.28 | ||||
| ROA 357 | –0.85 | –0.80 | 0.25 | 1.4 | 0.30 | 0.0 | 0.40 | 0.6 | 0.28 | ||||
| ROA 425 | –0.32 | 0.0 | 0.40 | 0.3 | 0.36 | ||||||||
| ROA 480 | –0.95 | –0.60 | 0.21 | 0.6 | 0.22 | 0.6 | 0.34 | 0.6 | 0.28 | ||||
| OC 140419 | –0.65 | –0.60 | 0.25 | 0.7 | 0.26 | 0.3 | 0.34 | 0 5 | 0.31 | ||||
| OC 263340 | –0.63 | –0.40 | 0.21 | 0.5 | 0.22 | 0.6 | 0.34 | 0.7 | 0.28 | ||||
| OC 305654 | –0.65 | –0.30 | 0.25 | 1.0 | 0.30 | 0.0 | 0.34 | 0.4 | 0.36 | ||||
| OC 321293 | –0.71 | 0.40 | 0.21 | 0.3 | 0.1 | 0.34 | 0.5 | 0.31 | |||||
| Teff | |||||
|---|---|---|---|---|---|
| [Fe/H] | 3800 | 4000 | 4200 | 4400 | |
| –0.6 | –1.40 | –1.10 | –1.45 | –1.40 | |
| –1.0 | –1.20 | –1.15 | –1.40 | –1.30 | |
| –1.4 | –1.10 | –1.30 | –1.20 | –1.35 | |
| Star | [Sr/Fe] | [Ba/Fe] | [Ba/Sr] |
|---|---|---|---|
| ROA 46 | 0.4 | 0.15 | –0.25 |
| ROA 150 | 0.6 | 0.70 | 0.10 |
| ROA 276 | 1.6 | 0.40 | –1.20 |
| ID | [Fe/H] | [C/Fe] | [N/Fe] | [Sr/Fe] | [Ba/Fe] |
|---|---|---|---|---|---|
| ROA 276 | –0.57 | –0.80 | 0.4 | 0.8 | 0.2 |
| S2015448 | –0.74 | –0.50 | 0.5 | 1.6 | 0.6 |