Two-proton correlation function for the and reactions
Abstract
For the very first time, the correlation femtoscopy method is applied to a kinematically complete measurement of meson production in the collisions of hadrons. A two-proton correlation function was derived from the data for the reaction, measured near the threshold of meson production. A technique developed for the purpose of this analysis permitted to establish the correlation function separately for the production of the and of the systems. The shape of the two-proton correlation function for the differs from that for the and both do not show a peak structure opposite to results determined for inclusive measurements of heavy ion collisions.
pacs:
13.60.Hb, 13.60.Le, 13.75.-n, 25.40.Ve1 Introduction
Momentum correlations of particles at small relative velocities are widely used to study the spatio-temporal characteristics of the production processes in relativistic heavy ion collisions [1]. This technique, called after Lednicky correlation femtoscopy [2], originates from photon intensity interferometry initiated by Hanbury Brown and Twiss [3]. Implemented to nuclear physics [2, 4, 5] it permits to determine the duration of the emission process and the size of the source from which the particles are emitted [2]. A central role plays the correlation function which has been defined as the measured two-particle distribution normalized to a reference spectrum obtained by mixing particles from different events [2]. The importance of the correlation femtoscopy has been well established for investigations of the dynamics of heavy ion collisions with high multiplicity. However, as pointed out by Chajecki [6], in the case of low-multiplicity collisions the interpretation of correlation function measurements is still not fully satisfactory, especially in view of the surprising observation by the STAR collaboration indicating universality of the resulting femtoscopic radii for both, the hadronic (proton-proton), and heavy ion collisions [7]. One of the challenging issues in this context is the understanding of contributions from non-femtoscopic correlations which may be induced by the decays of resonances, global conservation laws [6], or by other unaccounted interactions. In contrast to heavy ion collisions, in the case of single meson production, the kinematics of all ejectiles may be entirely determined and hence a kinematically complete measurement of meson production in the collisions of hadrons gives access to complementary information which could shed light on the interpretation of the two-proton correlations observed in heavy ion reactions. It is also important to underline that the correlation of protons was never exploited till now in near threshold meson productions, and as an observable different from the distributions of cross sections, it may deepen our understanding of the dynamics of meson production. Particularly favourable are exclusive experiments conducted close to the kinematical threshold where the fraction of the available phase-space associated with low relative momenta between the ejectiles is large [8].
In this article we report on a meson and multi-pion production experiment in which the mesons were created in collisions of protons at a beam momentum of 2.0259 GeV/c corresponding to an excess energy of Q = 15.5 MeV for the reaction. The measurement of the two-proton correlation function for these reactions is important not only in the context of studying the dynamics underlying the heavy ion physics. Such investigations are interesting by themselves because they offer a new promising diagnostic tool, still not exploited, for studying the dynamics of meson production in hadron collisions.
The correlation function carries information about the emitting source and, in particular, about the size of the interaction volume of the process. The knowledge of this size might be essential to answer the intriguing question whether the three-body system is capable of supporting an unstable Borromean bound state. Borromean systems may be realized in a variety of objects on the macroscopic (e.g. strips of papers), molecular [9, 10] and nuclear scale (e.g. 11Li or 6He nuclei [11, 12, 13]). According to Wycech [14], the large enhancement of the excitation function for the reaction observed close to the kinematical threshold may be explained by assuming that the proton-proton pair is emitted from a large (Borromean like) object whose radius is about 4 fm.
2 Experimental technique
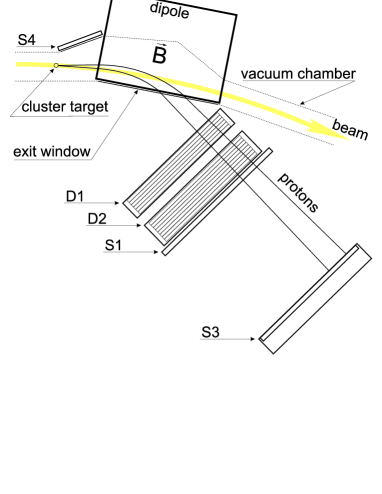
The experiment was conducted using the proton beam of the cooler synchrotron COSY [15] and an internal hydrogen cluster target [16]. Momentum vectors of outgoing protons from the reaction were measured by means of the COSY-11 facility [17] presented schematically in Figure 1.
The two-proton correlation function was determined for the and systems, respectively. Here, denotes a projection of the correlation function onto the momentum of one of the protons in the proton-proton center-of-mass system333 Note, that some authors instead of take as the independent variable the relative momentum of emitted particles with .. It was calculated, by means of the well established technique, as a ratio of the momentum () dependent reaction yield to the uncorrelated yield according to the formula (cf. [21])
| (1) |
where denotes an appropriate normalization constant. was derived from the uncorrelated reference sample obtained by using the event mixing technique introduced by Kopylov and Podgoretsky [5].
The separation of the correlations of the from the system and corrections for the limited acceptance of the detection system constitute the two main challenges to be solved when deriving the correlation function from the experimental data.
2.1 Separation of events from the production of and systems
In the discussed experiment, the four-momenta of the two final state protons were measured only, and the unobserved meson was identified via the missing mass technique [18, 20]. In such situations the entirely accessible information about the reaction is contained in the momentum vectors of the registered protons. Therefore, it is impossible to know whether in a given event the meson or a few pions have been created. However, statistically one can separate these groups of events using the missing mass spectra for each chosen region of the phase-space.
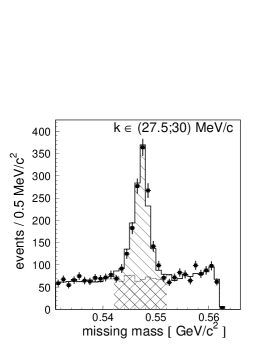
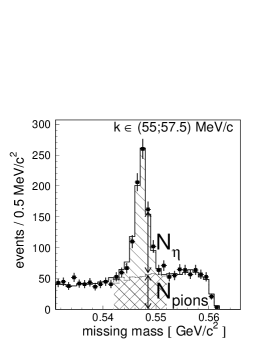
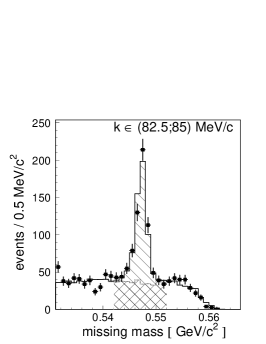
Thus, can be extracted for each studied interval of by grouping the sample of measured events according to the value of , next calculating the missing mass spectra of the reaction for each sub-sample separately, and counting the number of events from these spectra. Examples of typical missing mass histograms for three different intervals are presented in Figure 2. The statistics obtained in the considered measurement allowed to divide the kinematically available range of into bins whose width ( MeV/c) corresponds approximately to the accuracy of the determination of with ( MeV/c). A clear signal of meson production is observed in each spectrum on top of a continuous distribution originating from the multi-pion production. It is important to note that in the studied range of the missing mass the observed shape of the multi-pion distributions is well reproduced in corresponding simulation studies for each region of the phase space [18].
An extraction of - unbiased by the multi-pion production - is, however, not trivial. Applying a mixing technique one can construct the uncorrelated reference sample, taking momentum vectors of protons corresponding to different real events. A real event is determined by the momentum vectors of two protons registered in coincidence, and an uncorrelated event will thus comprise momentum vectors of protons ejected from different reactions. Unfortunately, in such a sample of uncorrelated momentum vectors, due to the loss of the kinematical bounds, the production of the meson will be not reflected on the missing mass spectrum and hence it cannot be used to extract a number of mixed-events corresponding to the production of the meson. Therefore, in order to determine a background-free correlation function for the reaction we performed the following analysis: First, for each event, the probability was determined that this event corresponds to the reaction. The probability , that the event with a missing mass , and a relative momentum of corresponds to a reaction was estimated according to the formula:
| (2) |
where stands for the number of the reactions and is the number of events corresponding to the multi-pion production with the invariant mass equal to . The values of and were extracted from the missing mass distributions produced separately for each of the studied intervals of . An example of a missing mass spectrum with pictorial definitions of and is presented in the middle panel of Figure 2. Now having introduced the weights we can calculate also the value of separately for the and final states. We can achieve this by sorting an uncorrelated sample according to the values similarly as in the case of the correlated events and next for each sub-sample we construct background free distributions as a sum of the probabilities that both protons in an uncorrelated event originate from the reaction where the meson was created. Specifically, if in a given uncorrelated event denoted by , one momentum is taken from a real event say and the second momentum from another real event , then the probability that both correspond to reactions where an was created equals to , and hence the uncorrelated yield may be constructed from the sum , where enumerates events in the uncorrelated sub-sample selected for a momentum range .
Analogously one can calculate assigning to the event a weight equal to .
2.2 Acceptance corrections
As the next necessary step in the data evaluation we corrected the determined yields to account for the finite geometrical acceptance and detection efficiency of the COSY-11 detectors [22]. Hereafter for simplicity by ”acceptance” both the geometrical acceptance and detection efficiency will be denoted. The acceptance was calculated as a function of the proton momentum in the proton-proton rest frame . It was obtained using Monte-Carlo simulations and evaluated according to formula:
| (3) |
where and denote the number of accepted and generated events, respectively.
Simulations were performed based on the GEANT-3 packages [23]
including the realistic geometry of the detectors and a precise map
of the field of the dipole magnet. The momentum and spatial beam spreads, multiple scattering,
proton-proton final state interaction [24]
and other known physical and instrumental effects were taken into account [17, 18].
Knowing the acceptance [22]
it would be straightforward to correct the nominator
of equation 1, however the correction
of the uncorrelated
yield is not trivial since the
momenta of protons in the uncorrelated event originate from
two idependent real events which in general could correspond to different
values of the detector acceptance.
Therefore, in order to derive a correlation function
corrected for the acceptance, we have created a sample of data
that would have been measured with an ideal detector.
For this aim
each experimental event was
multiplied by 1/A(k).
This means that a given reconstructed
event with momentum of k was added to the experimental data sample times.
Based on this corrected data sample
we calculated the two-proton correlation function
according to equation 1.
In order to avoid mixing between the same events, a
”mixing step” in the calculations was set to a value bigger than
the inverse of the lowest acceptance value.
The random repetition of identical combinations
was also omitted by increasing correspondingly the ”mixing step”.
In particular, a lth event, from the acceptance corrected data sample,
was ”mixed” with a (l+n)th
event, where .
If the (l+1)th event was the same as lth,
then this was mixed with a (l+1+2n) event, etc.
2.3 Results and conclusions
The two-proton background-free correlation functions for the and reactions corrected for the acceptances are presented in Figure 3 (full squares). As mentioned in the introduction the shape of the obtained correlation function reflects not only the space-time characteristics of the interaction volume but it may also be strongly modified by the conservation of energy and momentum and by the final state interaction among the ejectiles. In order to estimate the influence on the shape induced by the kinematical bounds we have constructed the correlation functions for both, the and reaction assuming a point-like source using a Monte-Carlo simulation. The results of the simulations are presented in Figure 3 (open squares) and it is apparent that they differ significantly from the experimental correlation function. At the origin the Coulomb repulsion between protons brings the experimental correlation function down to zero.


Next, in order to extract from the experimental data the shape of the correlation function free from the influence of energy and momentum conservation we constructed a double ratio:
| (4) |
where denotes the normalization constant, and indices ’exp’ and ’MC’ refer to the experimental and simulated samples, respectively. The determined double ratios are given in Table 1 and presented in Figure 4. The double ratio is a well established measure of correlations used e.g. by the ALEPH, OPAL and DELPHI collaborations for studying the Bose-Einstein or Fermi-Dirac correlations e.g. in the decays of Z boson [26, 27, 28] or W-pairs [29].

In Figure 4 a significant discrepancy between the two-proton correlation functions determined from inclusive heavy ion reactions (triangles) [25] and from exclusive proton-proton measurements (full squares) is clearly visible. The data from the kinematically exclusive measurement do not reveal a peak structure at 20 MeV/c. Although a similar enhancement is also seen in the invariant mass of the proton-proton distributions [20] it disappears in the correlation function for the and reactions.
At present it is not possible to draw a solid quantitative conclusion about the size of the system since e.g. in the case of the reaction it would require to solve a three-body problem where and [30] interactions are not negligible and both contribute significantly to the proton-proton correlation. However, based on semi-quantitative predictions [31] one can estimate that the system must be unexpectedly large with a radius in the order of 4 fm. This makes the result interesting in context of the predicted quasi-bound state [32] and in view of the hypothesis [14] that at threshold for the reaction the proton-proton pair may be emitted from a large Borromean like object whose radius is about 4 fm.
-
k MeV/c 1.25 —– —– 3.75 —– 0.09 0.03 6.25 0.10 0.04 0.13 0.04 8.75 0.28 0.08 0.15 0.04 11.25 0.42 0.09 0.29 0.05 13.75 0.54 0.10 0.39 0.06 16.25 0.74 0.12 0.50 0.07 18.75 0.91 0.14 0.63 0.08 21.25 0.94 0.13 0.70 0.08 23.75 1.11 0.15 0.79 0.10 26.25 1.08 0.14 0.74 0.09 28.75 1.34 0.17 0.85 0.10 31.25 1.24 0.15 0.87 0.10 33.75 1.12 0.14 0.92 0.10 36.25 1.23 0.15 0.86 0.09 38.75 1.14 0.13 0.89 0.10 41.25 1.18 0.14 0.91 0.10 43.75 1.06 0.13 0.91 0.10 46.25 1.04 0.12 0.87 0.10 48.75 1.04 0.12 0.90 0.10 51.25 1.04 0.12 1.00 0.11 53.75 1.10 0.13 0.92 0.11 56.25 0.95 0.11 1.02 0.11 58.75 0.96 0.12 0.93 0.11 61.25 1.07 0.13 1.00 0.13 63.75 0.97 0.12 1.13 0.14 66.25 0.98 0.13 1.01 0.13 68.75 0.88 0.12 1.11 0.14
Acknowledgements:
The work was partially supported by the
European Community-Research Infrastructure Activity
under the FP6 and FP7 programmes (Hadron Physics,
RII3-CT-2004-506078, PrimeNet No. 227431), by
the Polish Ministry of Science and Higher Education under grants
No. 3240/H03/2006/31, 1202/DFG/2007/03, and 0084/B/H03/2008/34,
by the German Research Foundation (DFG),
and by the FFE grants from the Research Center Jülich, and by the virtual institute ”Spin and strong QCD”
(VH-VP-231).
References
- [1] M. A. Lisa et al 2005 Ann. Rev. Nucl. Part. Sci. 55 357
- [2] R. Lednicky 2004 Nukleonika 49 (Sup. 2) S3
- [3] R. Hanbury Brown and R. Q. Twiss 1954 Phil. Mag. 45 663
- [4] S. E. Koonin 1977 Phys. Lett. B 70 43
- [5] G. I. Kopylov, M. I. Podgoretsky 1972 Sov. J. Nucl. Phys. 15 219
- [6] Z. Chajecki 2007 Eur. Phys. J. C 49 81
- [7] Z. Chajecki, M. Lisa 2007 Braz. J. Phys. 37 1057
- [8] P. Moskal, M. Wolke, A. Khoukaz, W. Oelert 2002 Prog. Part. Nucl. Phys. 49 1
- [9] K. S. Chichak et al. 2004 Science 304 1308
- [10] S. J. Cantrill et al. 2005 Acc. Chem. Res. 38 1
- [11] M. V. Zhukov et al. 1993 Phys. Rept. 231 151
- [12] F. M. Marqués et al. 2001 Phys. Rev. C 64 061301(R)
- [13] C. A. Bertulani, M. S. Hussein 2007 Phys. Rev. C 76 051602
- [14] S. Wycech 1996 Acta Phys. Polon. B 27 2981
- [15] D. Prasuhn et al 2000 Nucl. Instr. and Meth. A 441 167
- [16] H. Dombrowski et al 1997 Nucl. Instr. and Meth. A 386 228
- [17] S. Brauksiepe et al 1996 Nucl. Instr. and Meth. A 376 397; P. Klaja et al 2005 AIP Conf. Proc. 796 160; J. Smyrski et al 2005 Nucl. Instr. and Meth. A 541 574; P. Moskal et al 2001 Nucl. Instr. and Meth. A 466 448
- [18] P. Moskal 2004 e-Print Archive: hep-ph/0408162
- [19] J. Smyrski et al 2000 Phys. Lett. B 474 182
- [20] P. Moskal et al 2004 Phys. Rev. C 69 025203
- [21] D. H. Boal et al 1990 Rev. Mod. Phys. 62 553
- [22] P. Klaja, P. Moskal and A. Deloff 2007 AIP Conf. Proc. 950 156
- [23] 1994 CERN Application Software Group, GEANT 3.2, CERN Program Library Writeup Report No. W5013
- [24] P. Moskal et al 2000 Phys. Lett. B 482 356; P. Moskal et al 2000 Phys. Lett. B 474 416
- [25] G. Verde, A. Chbihi, R. Ghetti, J. Helgesson 2006 Eur. Phys. J. A 30 81
- [26] R. Barate et al 2000 Phys. Lett. B 475 395
- [27] P. Abreu et al 2000 Phys. Lett. B 471 460
- [28] G. Abbiendi et al 2007 Eur. Phys. J. C 52 787
- [29] R. Barate et al 2000 Phys. Lett. B 478 50
- [30] S. Wycech and A.M. Green 2005 Phys. Rev. C 71 014001; ibid 2005 C 72 029902
- [31] A. Deloff 2007 AIP Conf. Proc. 950 150
- [32] T. Ueda 1992 Phys. Lett. B 291 228