Electron Paramagnetic Resonance of Boron Acceptors in Isotopically Purified Silicon
Abstract
The electron paramagnetic resonance (EPR) linewidths of B acceptors in Si are found to reduce dramatically in isotopically purified 28Si single crystals. Moreover, extremely narrow substructures in the EPR spectra are visible corresponding to either an enhancement or a reduction of the absorbed microwave on resonance. The origin of the substructures is attributed to a combination of simultaneous double excitation and spin relaxation in the four level spin system of the acceptors. A spin population model is developed which qualitatively describes the experimental results.
pacs:
71.55.Cn, 76.30.-v, 81.05.Cy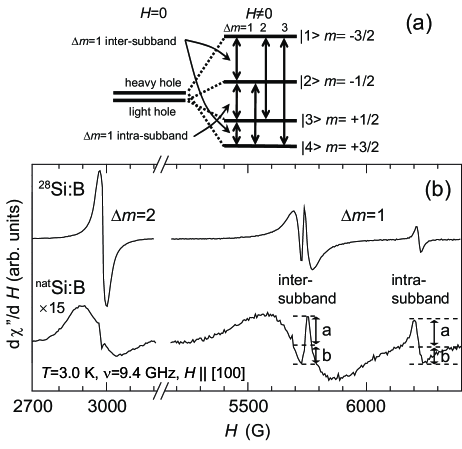
Boron is the most widely employed shallow acceptor in silicon. However, due to the existence of four degenerate energy levels originating from the light and heavy hole bands (shown in Fig. 1 (a)) and their strong sensitivity to perturbations like internal strain Kohn , B exhibits rich optical and electron paramagnetic resonance (EPR) spectra, which are still not fully understood. Recently, some open questions associated with the optical properties of this acceptor have been solved due to the availability of isotopically enriched Si SiIsotope1 ; SiIsotope2 . Using such samples, it has been shown that the random distribution of the different host Si isotopes causes a residual acceptor ground state splitting in natural Si which is experimentally observed in the photoluminescence (PL) spectra of acceptor bound excitons KaraPL and also gives rise to inhomogeneous broadening of the infrared absorption spectra KaraIR ; KaraSim .
Similarly, host isotope effects might also account for various properties of the EPR spectra of B in Si that have not been understood so far. The first successful boron EPR required the application of large homogeneous external stress to diminish the influence of inhomogeneous internal strain fields that are mainly induced by randomly distributed point defects and dislocations. These defects lead to a statistical distribution of ground state splittings, which, depending on the defect concentration, can result in an extremely large inhomogeneous broadening of the EPR resonance lines in externally unstrained Si Feher . The first observation of boron EPR without external stress was finally realized in 1978 Neubrand1 ; Neubrand2 , when Si crystal growth techniques had developed enough to obtain samples of sufficient crystalline quality. However, the experimentally observed EPR linewidths have always been much broader than could be explained solely by the residual defect concentrations in high quality Si. In addition, Neubrand observed sharp substructures in the main resonance peaks, with and without externally applied stress Neubrand1 ; Neubrand2 . More recent studies on acceptor EPR probing dependencies on temperature, external stress, and frequency Kopf ; Scad found the same sharp features, but the origin of these substructures remained unclear.
Here, we present experimental evidence that indeed the random distribution of stable Si isotopes is the major cause of inhomogeneous broadening of boron EPR spectra in natural Si. Moreover, thanks to the sharpening of the main EPR lines, the improved visibility of the sharp substructures allows for detailed studies of their origin. The substructures are shown to arise from an interplay between simultaneous excitation of two EPR transitions and spin relaxation in the four level spin system of B acceptors in Si. A theoretical model based on this assumption is developed to describe the temperature dependence of the substructures.
The experiments were performed with two -type Si single crystals. The first sample, referred to as natSi:B, was float-zone grown, has a natural isotopic composition and a B concentration of 1.41014 cm-3. The isotopically purified sample (99.98 % 28Si), referred to as 28Si:B, comes from the neck of a float-zone crystal and is doped with B to a concentration of 3(1)1014 cm-3.
EPR measurements at a temperature of =1.8 K were performed using a Bruker E580 EPR spectrometer equipped with a flex-line resonator (ED-4118MD5) operating at a microwave frequency =9.6 GHz. An Oxford CF935 helium-flow cryostat was used to maintain the temperature. For experiments at 2.8 K, a Bruker E500 spectrometer in conjunction with a super-high-Q resonator (ER-4122SHQE) was used at =9.4 GHz. In this case, the sample was cooled using an Oxford ESR900 helium-flow cryostat. Lock-in detection using magnetic field modulation leads to the detection of the first derivative of the imaginary part of the magnetic susceptibility with respect to the magnetic field . The absorption curves, which are proportional to , are obtained via numerical integration of the measured spectra.
Figure 1 (b) shows two overview EPR spectra that were measured on the 28Si:B and the natSi:B samples. In both spectra, we observe three distinct B-related resonances. From the angular dependence of the effective g-values Neubrand1 ; Neubrand2 , we assign the resonance at =2980 G to a superposition of the two inter-subband =2 transitions, where is the magnetic quantum number of the total angular momentum =3/2 of the B acceptor. The resonances at =5730 G and =6220 G originate from a superposition of the two inter-subband =1 transitions and and the intra-subband =1 transition , respectively Neubrand1 ; Neubrand2 ; Luttinger . The most prominent difference between the two spectra is the decreased linewidth of all B-related resonances in the isotopically purified sample. This effect is most strongly pronounced for inter-subband transitions. As found by PL in Ref. KaraPL ; KaraSim , local fluctuations of the valence band edge due to the random distribution of the different Si isotopes are responsible for the residual splitting of the B acceptor ground state in natSi in absence of an external magnetic field. A detailed modelling of the influence of the isotope-induced fluctuations on the EPR resonances shows that this effect also accounts quantitatively for the inhomogeneous broadening of B-related EPR signals that could not be explained by point defect-induced random strain fields. This is in marked difference to the broadening of donor EPR lines in Si, which is caused by superhyperfine interaction with 29Si nuclei Feher2 . The quantitative investigation of the broadening mechanism in Si:B is beyond the scope of this paper and will be given elsewhere. Here, we focus on the origin of the sharp substructures that appear in the middle of the inter-subband resonances. The observation of these substructures in 28Si:B establishes that they do not result from an isotopic effect.
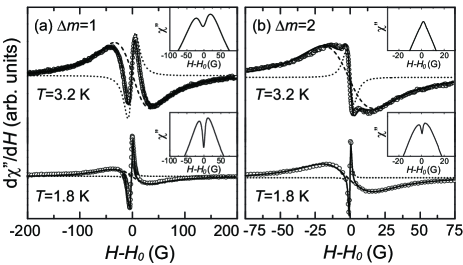
Figure 2 shows the inter-subband resonances on an expanded magnetic field scale as measured for 28Si:B at two different temperatures. The narrow substructure is observed in all four spectra. By cooling from 3.2 to 1.8 K, the linewidth of the substructures decreases substantially, from 15 to 3 G for =1 and from 5 to 1 G for =2. In contrast, the broad underlying signals show much weaker changes in linewidth with temperature (from 78 to 70 G for =1, 36 to 35 G for =2). Thus, even though the line shape of the broad resonances is Lorentzian, the lack of any significant temperature dependence suggests that the lines are inhomogeneously broadened. This broadening is attributed to the distribution of transition energies between different energy levels induced by random local strains, which are well accounted for by the 11016 cm-3 concentration of C impurities as measured by infrared absorption spectroscopy on the 607 cm-1 C local vibrational mode Neubrand2 ; a .
The insets in Fig. 2 show the integrated absorption curves in the magnetic field region of the substructure. We observe the following experimental facts: (1) For the =1 spectra (Fig. 2 (a)), the substructure has a negative sign corresponding to a decrease of the microwave absorption at the center of the broad resonance. The intensity of this dip increases with decreasing temperature. We have exclusively observed a negative sign of the substructure in the =1 resonance for all temperatures investigated. (2) In contrast, for the =2 resonance, the microwave absorption in the substructure is enhanced at high temperatures, giving rise to a sharpened peak of the integrated spectrum measured at =3.2 K. However, when the temperature is decreased to 1.8 K, the sign of the substructure line reverses, and a dip in the absorption spectrum is observed. (3) Microwave power saturation experiments (not shown) reveal that the saturation behavior of the substructure lines strongly deviates from that of the underlying broad signals; the relative intensity of the substructure decreases with increasing microwave power. No power broadening is observed for the substructure lines. (4) As has been pointed out in Ref. Neubrand1 , the resonance fields of the substructure lines do not change when a small external stress is applied. (5) We find that the linewidths of the intra-subband =1 resonance and the substructure of the inter-subband =1 signal are very similar, in particular for temperatures below 3 K. Moreover, in the natSi sample, for each orientation of (not shown) these two resonances have the same asymmetry of the line shape, defined as the a/b ratio in Fig. 1(b), indicating that transitions between and are involved at least in the generation of the =1 substructure.
The experimental observations summarized above strongly argue against a model assuming that the narrow substructure lines arise from a partial overlap of two asymmetric lineshapes, e.g. the and transitions in case of the =1 signal, or the and transitions in case of the =2 signal, as has been already speculated in Ref. Neubrand1 . On the other hand, a similar “substructure” line in the middle of a broad resonance has been reported for Ni2+ centers in MgO Smith . However, the cross-relaxation model invoked there can not account for the positive sign of the =2 substructure observed here for 3.2 K. In what follows, we demonstrate which interplay of spin excitation and relaxation in the four level system of Si:B causes the narrow substructure lines observed.
The centers of the broad resonances, where the substructure lines develop, correspond to B acceptors that experience a strain close to zero. In this case, the energy level scheme of the four level system is symmetric, as shown in the insets of Fig. 3, and the energies of the transitions and [ and ] are equal, so that they are resonantly excited at the same time. This double excitation can lead to a change in the microwave absorption with respect to the situation when only one transition can be excited. The magnitude and sign of this change will depend on the ratios between relaxation and excitation rates in the level system.
To explore this scenario, we have performed a first calculation based on an incoherent spin population model Abragam ; Shikata composed of a set of rate equations. The time evolution of the spin population of each state is given by the sum of all possible excitation and relaxation terms. Relaxation and excitation rates from to are represented by and , respectively.
We use our model to compare the microwave absorption between exactly on and slightly off resonance conditions. For the on resonance condition where the substructure emerges, and [ and ] are assumed to have the same non-zero value for the =1 [=2] resonance, while all the other elements in the excitation matrix are set to zero. The rate equations are solved for the steady state condition (=) using the following assumptions: (i) Boltzmann balance of the relaxation rates, i.e. =, where is the energy difference between the states and and is the Boltzmann constant. (ii) = and =, dictated by the symmetry of the Si:B Hamiltonian when the local strain is close to zero, (iii) =, required for magnetic dipole transitions, and (iv) =1 to conserve the total number of spins. The sum of the resulting population differences, (-)+(-) [(-)+(-)] for the =1 [for =2] transition, is used as a measure for the microwave absorption. To simulate the situation slightly off resonance, where double excitation is not possible, only one excitation at a time is allowed, e.g. 0 [0] is assumed for the =1 [=2] resonance, and the microwave absorption represented by - [-] is added to the microwave absorption - [-] that is obtained by separately considering only the second transition with the excitation 0 [0].
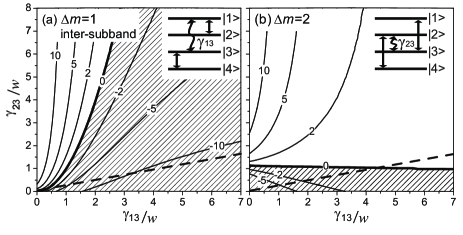
Results of such calculations are shown in contour plots in Fig. 3. The relative change of the microwave absorption due to double excitation, calculated as the population differences between exactly on and slightly off resonance conditions, is plotted as a function of the normalized relaxation rates and (all other relaxation rates were kept constant, e.g. ==1). This calculated change in absorption can be compared with the intensity of the substructure in Fig. 2. The open and shaded regions in Fig. 3 correspond to a suppression (dip substructure) and an enhancement (peak substructure) of microwave absorption, respectively. The dashed line shown in the plot corresponds to a constant ratio of =4/1, motivated by the temperature independent ratio of substructure linewidths, 4, observed experimentally. Assuming all other parameters to only depend moderately on temperature, a variation of the temperature in our experiments can be viewed in a first approximation as a correlated change of and along the dashed line. This picture qualitatively explains the experimentally observed temperature dependence of the substructure line intensity in Fig. 2. For example, we find a negative sign (dip) for the =1 substructure and a positive sign (peak) for the =2 substructure when 4 and 1. Experimentally, this situation corresponds to temperatures 3.2 K. Upon decreasing both and along the dashed line, corresponding to lowering the temperature from 3.2 K to 1.8 K in the experiment, we observe a change of the sign for the =2 substructure from positive to negative. For the =1 substructure, the sign always stays negative for all and along the dashed curve, agreeing with the experimental finding that the sign is always negative at all accessible temperatures.
By simulating the model using a range of parameters we have identified several requirements for the relative magnitude of the in order to reproduce the experimental observations. First, to achieve a substantial effect (e.g. 10 %) from the double excitation requires that all are of the same order of magnitude and also that the applied microwave power is close to saturation, i.e. , as used in Fig. 3. Second, to observe a temperature dependent change of the sign for the =2 substructure requires that . This order of the is unusual and contrasts with usually seen in other high-spin systems where zero-field splitting (ZFS) dominates spin relaxation ZFS . However, we point out that the ZFS Hamiltonian in Si:B is represented by the terms Neubrand1 (in contrast to usual ), and therefore the order of relaxation rates can be different. The results presented here should therefore motivate the development of a detailed theory of relaxation effects in Si:B. Independent of this, we have performed microwave power saturation measurements (not shown) and confirmed that all resonances in Si:B saturate at about the same microwave power. The multiple relaxation pathways in the four level system make a direct interpretation of these saturation experiments difficult. Nevertheless, the fact that microwave power saturation occurs at the same power indicates that at least some of the in Si:B have comparable magnitudes as assumed.
Our model is still somewhat qualitative and does not reproduce all experimental facts. For example, the model predicts that the strongest effect from double excitation should be seen at close to saturation conditions, i.e. 1, which is not in line with experiment. Further improvements to the model could be based on the density matrix formalism and the Redfield relaxation theory to construct the full set of Bloch equations for the =3/2 spin system, also taking into account the specific spin Hamiltonian of Si:B to correctly predict the relaxation rates between different spin levels. Nevertheless, the instructive model constructed here establishes that the substructures in the EPR lines arise from the double excitation among the four levels of B acceptors. The improved understanding of the resonance properties of acceptors and the additional degree of freedom achieved via isotope engineering could make these valence band-derived states versatile competitors to the more thoroughly studied donors also in applications such as spin- or orbitronics.
Acknowledgements.
The work at Keio was supported in part by the JST-DFG Strategic Cooperative Program on Nanoelectronics, in part by Grant-in-Aid for Scientific Research #18001002, by Special Coordination Funds for Promoting Science and Technology, and by a Grant-in-Aid for the Global Center of Excellence at Keio University. Work in Garching was supported by the JST-DFG program (Br 1585/5). Work at Princeton was supported by the NSA/LPS through LBNL (MOD 713106A).References
- (1) W. Kohn, in Solid State Physics, ed. by F. Seitz and D. Turnbull (Academic Press, New York, 1957), vol. 5, p. 257.
- (2) K. M. Itoh et al., Jpn. J. Appl. Phys. 42, 6248 (2003).
- (3) K. Takyu et al., Jpn. J. Appl. Phys. 38, L1493 (1999).
- (4) D. Karaiskaj et al., Phys. Rev. Lett. 89, 016401 (2002).
- (5) D. Karaiskaj et al., Phys. Rev. Lett. 90, 186402 (2003).
- (6) D. Karaiskaj et al., Phys. Rev. Lett. 90, 016404 (2003).
- (7) G. Feher, C. J. Hensel, and E. A. Gere, Phys. Rev. Lett. 5, 309 (1960).
- (8) H. Neubrand, phys. stat. sol. (b) 86, 269 (1978).
- (9) H. Neubrand, phys. stat. sol. (b) 90, 301 (1978).
- (10) A. Köpf and K. Lassmann, Phys. Rev. Lett. 69, 1580 (1992).
- (11) H. Schad and K. Lassmann, Phys. Lett. 56A, 409 (1976).
- (12) J. M. Luttinger, Phys. Rev. 102, 1030 (1956).
- (13) G. Feher, Phys. Rev. 114, 1219 (1959).
- (14) P. G. Sennikov et al., Semiconductors 39, 300 (2005).
- (15) S. R. P. Smith, F. Dravnieks, and J. E. Wertz, Phys. Rev. 178, 471 (1969).
- (16) A. Abragam, , (Clarendon Press, Oxford, 1961)
- (17) H. Shikata, Bull. Chem. Soc. Japan 50, 3084 (1977).
- (18) M. Rubinstein, A. Baram, and Z. Luz, Mol. Phys. 20, 67, (1971).