Rev. Mex. Astron. Astrophys., 2010, 46, 67
Herbig-Haro objects around CG 30
Abstract
In this work we study Herbig-Haro objects located in the region around the head of the cometary globule CG 30. Two sets of optical images are presented. The first set was obtained with the 3.5 m New Technology Telescope in 1995 in three emission lines: H, S II6731,6716 Å and [O II]3729 Å. The second set is an H image of the CG 30/31/38 complex obtained in 2006 with the 8 m Subaru telescope. A proper motion study of the HH objects in the region was performed using the H images from both epochs. Due to the high resolution of our images we were able to, for the first time, resolve the HH 120 object into ten knots and measure proper motions for some of them. We discover several new HH objects and a large bipolar jet, HH 950, emerging from the head of CG 30. We suggest that two previously known submillimeter sources are the driving sources for the HH 120 and HH 950 flows.
1 Introduction
Cometary globules (CGs) are compact interstellar molecular clouds usually associated with H II regions and OB stars. A particularly fine group is located in the Gum Nebula (Hawarden & Brand 1976; Zealey et al. 1983; Reipurth 1983). They show compact and bright-rimmed heads and faint tails that extend from the heads and point away from the nearby bright young photoionizing stars (Fig. 1). Their sizes range between 0.1-0.8 pc, they exhibit high densities, 104-105 cm-3 and temperatures around 10 K. Their typical masses range between 10-100 M⊙. Cometary globules are the sites of star formation (see Reipurth 1983). In some cases, bipolar Herbig-Haro (HH) flows have been observed emerging from the heads of cometary globules (Schwartz 1977; Reipurth 1983; Pettersson 1984).
The largest known optical H II region in the Galaxy is the Gum Nebula (Gum, 1952). It is located in the Galactic plane (=258∘, =-2∘) at a distance of about 450 pc, and is excited by Pup, Vel, and in the past by the progenitor to the Vela pulsar. Its linear diameter is 250 pc. With its apparent diameter of 36∘ it covers a large part of the southern sky in the constellations Vela, Puppis, Pyxis, Canis Major and Carina. One of the most studied groups of CGs in the Gum Nebula is the CG 30/31/38 complex.
1.1 CG 30 and HH 120
In this paper we present two sets of very deep images of CG 30 (see § 2). CG 30 has been studied by various authors at different wavelengths. It has been recognized as a region of star formation due to its association with the Herbig-Haro object HH 120, first noted by Westerlund (1963) and Reipurth (1981).
The earliest spectroscopic measurements of HH 120 were made by Pettersson (1984), who obtained spectra of two different parts of HH 120, one being its brightest condensation (knot A). Its mean radial velocity of -42 km s12 km s-1 is consistent with the value -39 km s-1 obtained by Schwartz & Greene (2003). The electron temperature Te and the electron density ne are found by Pettersson (1984) to be 9100 K400 K and 1700 cm600 cm-3, respectively. Also five IR sources associated with CG 30 were observed. It was argued that one of them, CG30-IRS4 (also known as IRAS 08076-3556), is an energy source for HH 120 and its associated reflection nebula.
Graham & Heyer (1989) imaged HH 120 in the R (0.6 m), J (1.2 m), H (1.6 m) and K (2.2 m) bands. Like Pettersson (1984) they also detected a source CG30-IRS4 in H and K band images.
Scarrott et al. (1990) performed optical polarization studies of a nebula seen against the central dark region of CG 30 that contains HH 120. It was confirmed that the so called CG 30 Nebula is predominantly a reflection nebula illuminated by the IR source CG30-IRS4.
Persi et al. (1994) observed HH 120 and its energy source CG30-IRS4 in the near infrared, mm continuum, and an ammonia line. It was recognized that the IRAS 08076-3556 source is a very young low mass Class I source embedded in a dense core of CG 30. The measurements of the 1.3 mm luminosity and the bolometric luminosity show that their ratio is actually closer to that of the Class 0 sources. The authors stated that the strong 1.3 mm emission is probably due to a circumstellar dust disk around the IRAS source.
Hodapp & Ladd (1995) reported the discovery of eight shocked objects in infrared images in the H2 1-0 S(1) emission line. On the basis of their relative positions the authors concluded that they form parts of two outflows propagating in approximately perpendicular directions. None of the supposed flows could be directly associated with the optical HH 120 object.
Nielsen et al. (1998) observed the cometary globules CG 30/31/38 in 13CO, 12CO and H2 lines. They proposed that CG 30 with a mass of 10 M⊙ is associated with another globule along the line-of-sight having a mass close to 2 M⊙ and moving with a velocity of 4 kms-1 with respect to the local standard of rest. Also a dense molecular outflow associated with CG 30 was detected in the 12CO (J=1-0) line and its total mass was estimated to be 0.28 M⊙. They reported the maximum flow velocity to be 9 kms-1 and its dynamical age to be 1.7104 years. This flow is propagating in a direction perpendicular to the tail of CG 30 and is originating from the position of the CG30-IRS4 source.
Bhatt (1999) discussed the role of magnetic fields in cometary globules. The author found that in the case of the CG 30/31 complex, the light from the stars in the region is polarized in the range from 0.1 to 4 per cent. The polarization vectors seem to be perpendicular to the direction of the tails of CG 30 and 31, but, interestingly, almost aligned with the direction of the molecular flow detected by Nielsen et al. (1998). Bhatt also claimed that if the polarization is caused by dust grains aligned by the magnetic field, then the polarization vectors must be parallel to the projected magnetic field in the region. The tails of CG 30 and 31 are much shorter and more diffuse than the tail of CG 22, where the magnetic field is found to be parallel to the globules’s tail. According to Bhatt, CG morphology depends on the relative orientation of the cloud magnetic field and the radius vector of the CG head from the central source of radiation and the winds that produce the cometary tails. Long and narrow tails are to be observed when the magnetic field is parallel to the radius vector, while short and diffuse tails develop if those two are perpendicular.
In their search for young Solar System analogues, Zinnecker et al. (1999) observed four regions containing low luminosity sources associated with extended reflection nebulosities, among which was also CG 30. The images were obtained in near-IR (J, H and K) broad-bands. In their images they observed the confines of the 0.3 pc diameter dark globule with the very red CG30-IRS4 source at the center and the bluer nebulosity just above it.
While the widely accepted distance of the Gum Nebula is 450 pc, Knude et al. (1999, 2000) and Nielsen et al. (2000) suggested a distance of 200-250 pc on the basis of color-magnitude ((V - I) - V) diagrams and photometry of the stars that appear to be located in the CG 30/31/38 region. The distance to the globules remains under debate, in this paper we adopt 450 pc.
In their survey of Bok Globules, Launhardt et al. (2000) observed CG 30 at submm wavelengths (850 m). They discovered two sources lying along a north-south direction and separated by a projected distance of 9000 AU. The northern condensation was identified as a possible driving source for the HH 120 jet (and with the CG30-IRS4 source) and the southern condensation was proposed to be associated with the larger of the IR flows. The two sources were observed again by Wu et al. (2007) at 350 m.
Nisini et al. (2002) obtained spectra in the 1-2.5 m wavelength span. The most prominent features observed were [Fe II] and H2 lines. On the basis of H2 emission they found that HH 120 consists of multiple temperature components probably due to a slow, J type shock.
Kim et al. (2005) studied the low-star mass formation in the CG 30/31/38 complex. They obtained X-ray, optical and near-IR photometry of the stars in the region and found 14 new pre-main sequence (PMS) stars in addition to the 3 previously known stars in the region. According to the authors, these PMS stars belong to two groups: one group having ages of 5 Myr at 200 pc, with spectral classes K6 - M4, and the other group of F - G type stars with ages of 100 Myr and 2 kpc. They conclude that there were at least two episodes of star formation - ongoing star formation such as in the head of the CG 30 cloud triggered by UV radiation from OB stars, and a formation episode that may have been triggered 5 Myrs ago by preexisting O stars, such as the progenitor of the Vela SNR and Pup.
Chen et al. (2008a) observed CG 30 in the 3 mm dust continuum, in N2H+ (1 - 0) emission line and at 3 - 8 m wavelengths. The authors detected two sub-cores inside CG 30. From the millimeter continuum observations they derived the gas masses of the two sub-cores to be 1.1 M⊙ (northern sub-core) and 0.33 M⊙ (southern sub-core). The authors classified the northern source as a Class I object and the southern source as a Class 0 protostar. The IR observations revealed two perpendicular collimated bipolar jets that coincide with the knots previously discovered by Hodapp & Ladd (1995). The N2H+ (1-0) emission maps revealed two cores spatially associated with the mm continuum dust cores.
In a subsequent study, Chen at al. (2008b) studied CG 30 in the 12CO(2-1) line and 1.3 mm dust continuum. The 12CO(2-1) observations showed the existence of two bipolar molecular flows propagating in almost perpendicular directions. The authors suggested that one of the flows is associated with the northern compact source and the other one with the southern source. The northern flow exhibits the projected length of 27,000 AU and the position angle P.A. 128∘. The projected length of the southern flow is 20,000 AU and its direction of propagation (P.A.) is 57∘. The velocities of the flows are low (12 kms-1).
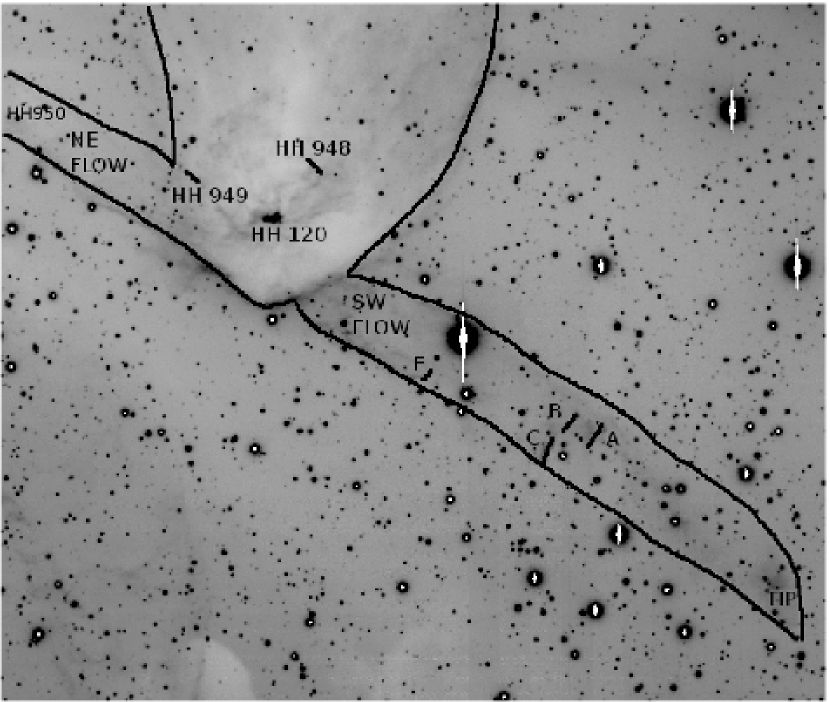
In this work we study the kinematics of the HH objects in CG 30 by measuring their proper motions. We combine our observations with the existing data at IR and submm wavelengths in order to understand the global outflow properties in the globule. Table 2 lists the coordinates of all the HH objects that appear in our images. We have discovered a large bipolar HH flow, which we catalogue as HH 950. This flow is extending 12’2 in the northeast-southwest direction, escaping from the interior of CG 30, and displaying a complex structure with various working surfaces.
This paper is organized as follows. In Section 2 we present our data and the reduction techniques applied. In Section 3 we present our methodology and the results of this work. The latter are discussed in Section 4, and the conclusions are given in Section 5.
2 Observations
2.1 NTT images
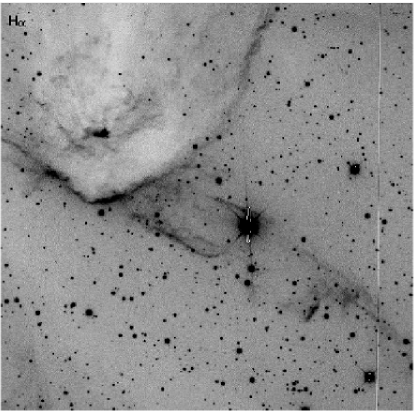
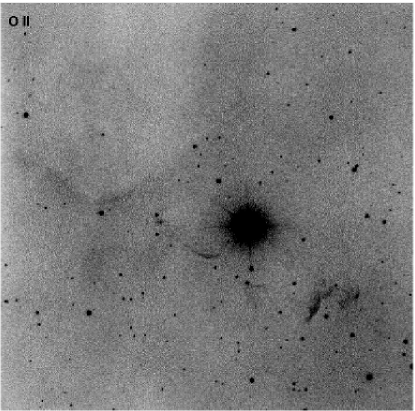
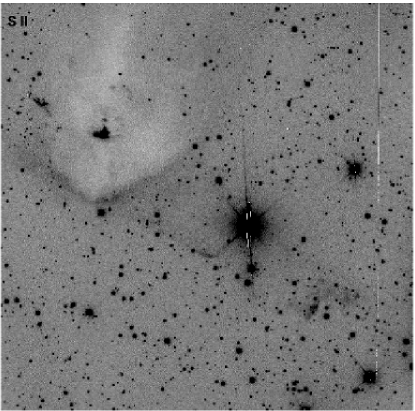
Observations with the ESO New Technology Telescope were carried out on February 7, 1995 using the ESO Multi Mode Instrument (EMMI) and three different narrow-band filters in the H, [O II]3729 Å and [S II]6731,6716 Å emission lines (Figure 2). The central wavelengths and widths of these filters were 6568, 3725, 6728 Å and 33, 69 and 75 Å, respectively. The total integration time for each of the exposures was 30 minutes. The standard basic data reduction procedures were carried out (bias subtraction and flat-fielding). The average FWHM of the stars is 0.7 arcsec. The summary of all of the exposures presented in this paper is given in Table 1.
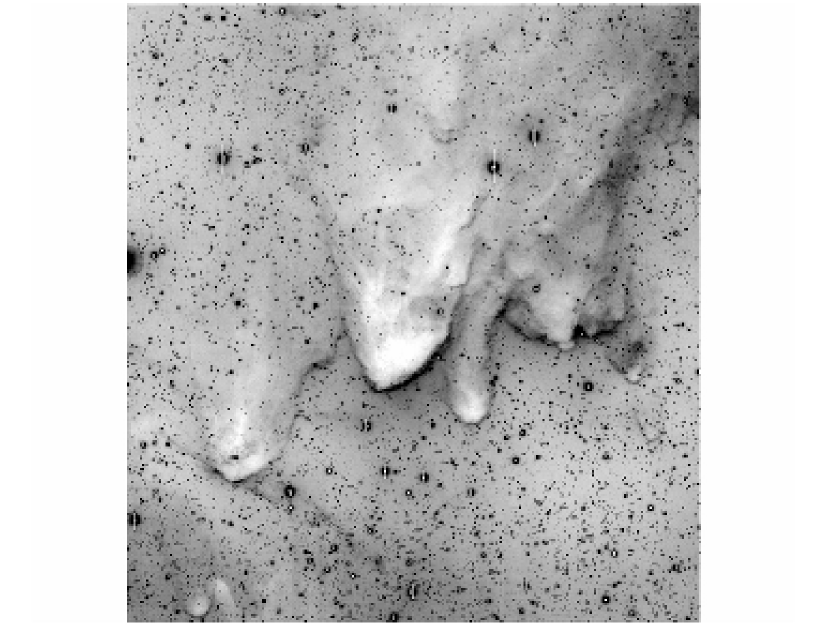
2.2 Subaru images
Observations with the Subaru Telescope were carried out on January 4, 2006 using the Subaru Prime Focus Camera (Suprime-Cam). This camera is a mosaic of ten 2048 4096 pixel CCDs, which are located at the prime focus of the 8m Subaru Telescope. Narrowband filter N-A-L659 with central wavelength 6600 Å and FWHM 100 Å was used, thus including the H line. Five exposures of CG 30 with individual exposure times of 360 seconds were obtained. Data reduction was performed using IRAF. The standard basic data reduction procedures were carried out (i.e. bias and dark subtraction, flat-fielding, and distortion correction). The images were then stacked using the IRAF MSCRED, MSCSETWCS, MSCZERO and GREGISTER packages. Figure 1 shows a region of the CG 30/31/38 complex and is a small subimage of this mosaic. This is the deepest image of CG 30 obtained so far. Its angular resolution is not as good as in the NTT images (the average FWHM of the stars is ), probably due to the fact that for the Subaru telescope CG 30 was observed at high airmass.
| Date | Total | Telescope | Instrument | Central | (Å) |
|---|---|---|---|---|---|
| exposure time | wavelength (Å) | ||||
| February 7 1995 | 30 min | NTT | EMMI | 6568 | 33 |
| February 7 1995 | 30 min | NTT | EMMI | 3725 | 69 |
| February 7 1995 | 30 min | NTT | EMMI | 6728 | 75 |
| January 4 2006 | 30 min | Subaru | Suprime-Cam | 6600 | 100 |
3 Methods and results
3.1 HH flows and objects
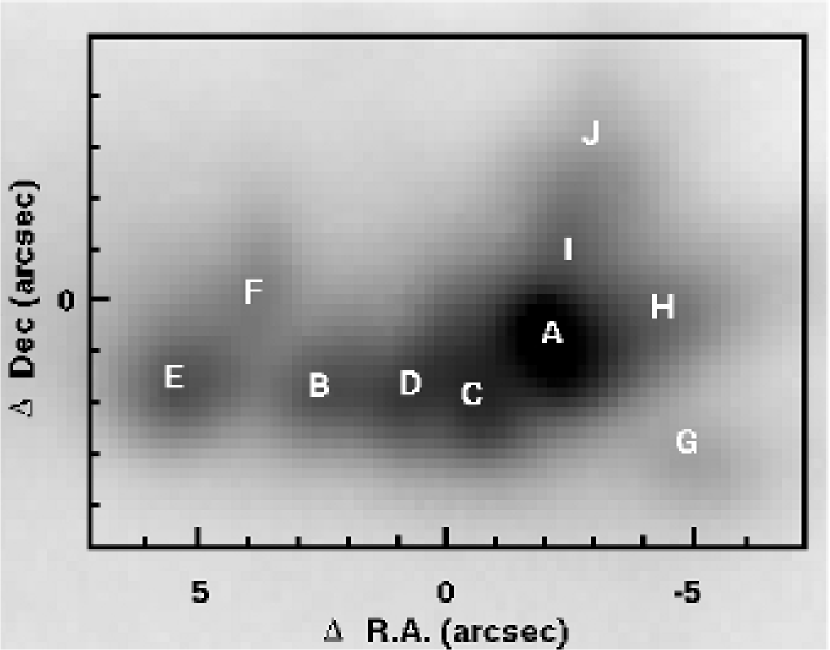
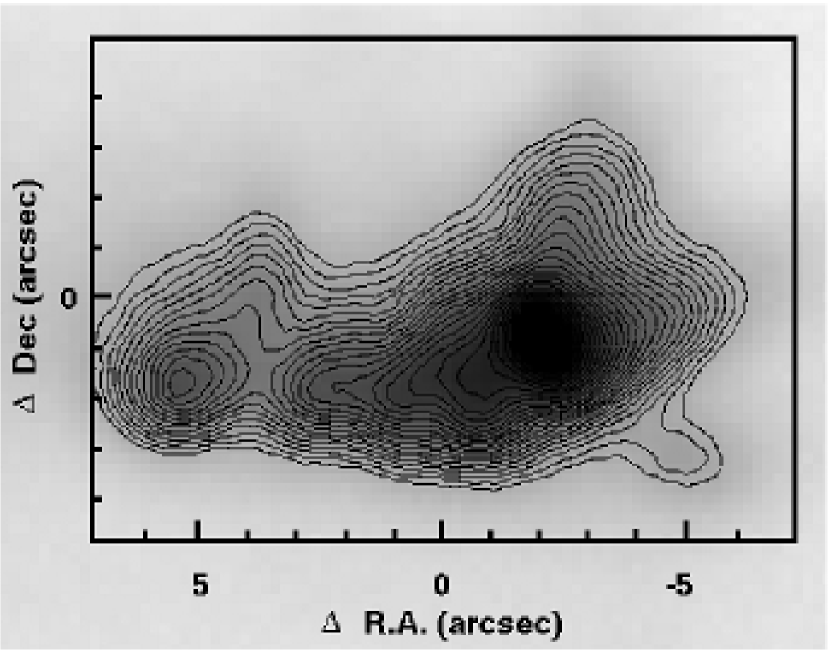
The first HH object discovered in CG 30 was HH 120. Here we present the so far deepest and most detailed images of this HH flow. Pettersson (1984) resolved the object into several knots, and we retain the nomenclature A and B for the two main knots in HH 120. We resolve numerous knots, which we label A to J (see Figure 3). Knot A is the brightest and has been observed previously at infrared wavelengths by Schwartz & Greene (2003). These authors obtained an image of HH 120 in the 1-0 S(1) line of H2. The image was used to locate the slit positions for spectroscopic measurements. It shows two knots the authors call A and B that are 4”6 apart. The IR knot A coincides with the A knot in our H images (Figure 3). The IR knot B does not coincide with any of the knots in the H line, but it lies just northward of our knots C and D. The knots C and D lie between the optical knots A and B and the knot E lies about 7”3 east of the knot A. About 3” northwest of the knot E there is a small knot F. Four faint knots, G, H, I, and J lie very close to the knot A just west of it. Finally, in the Figure 4 can be seen the bright knot K, which lies 11”6 to the north of the knot A.
In the NTT H image all of these knots appear except for the knot F, which blends in the background noise and the knot K, which lies outside the region showed in this image. The lower image in Figure 3 shows a contour plot of HH 120. Only the two major condensations A and E are well resolved by the contours.
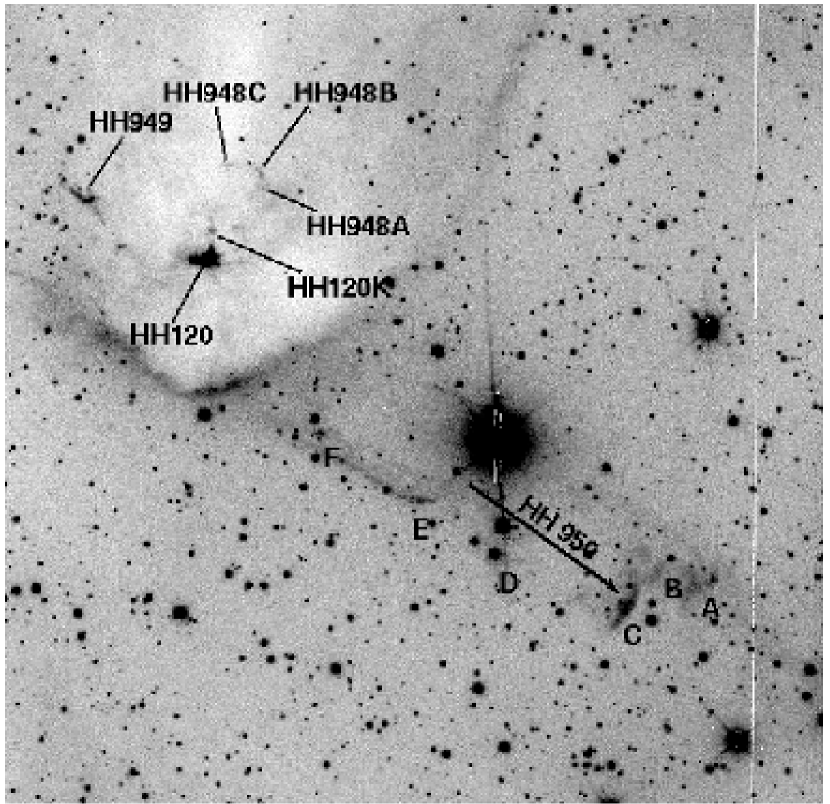
In order to have a better overview of the HH objects in the region, we combined the three NTT images into a single image (see Figure 4). The H image was weighted with a factor . The image in the Figure 4 was obtained by averaging the weighted H image with original [S II] and [O II] images.
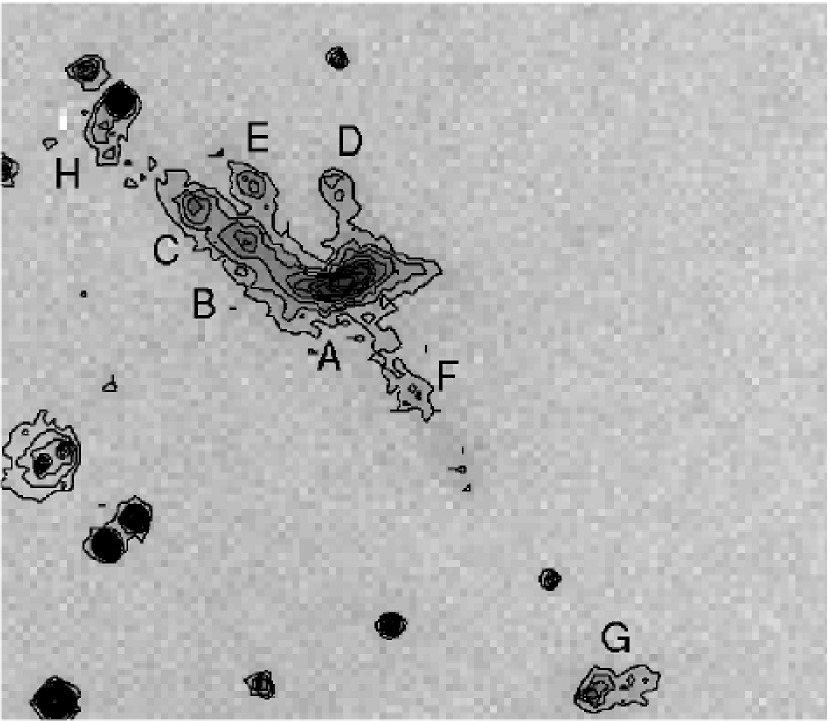
Several new HH objects, here labelled HH 948, 949, and 950, appear in our images. Some of them had already been observed by Hodapp & Ladd (1995) in the near-infrared. In their work the authors labeled detected IR flows with numbers from 1 to 8. We adopt the same notation when we refer to them. Among the IR flows the following appear in our [S II] image: HH 948 (IR knot 2) consists of three knots that are located between 38 and 43” north of the HH 120 knot A. IR knot 6 is located 52” southeast of the HH 120 knot A. HH 949 is composed of eight knots of which six (A to F) were previously known as IR knot 7, one of them (H) as IR knot 8 and one (G) as IR knot 5 (see Figure 5). The knots A to F and H lie between 52” and 72” northeast of HH 120. HH 949G knot (IR knot 5) lies about 39” east of the HH 120 knot A.
None of these features appear in the [O II] image, while most of them (HH 949 and HH 948) do appear in our H images, although they are very faint.
We discovered a new Herbig Haro flow HH 950. It is seen in all of our images. This is a major bipolar flow that is emerging from the head of the CG 30. It extends approximately 10’ in the northeast-southwest direction. It is composed of two lobes - the northeastern and the southwestern lobe. The width of the flow at the position of the HH 950 knot E (see Figure 4) is 1’, which yields a length to width ratio of 10 and an opening angle of 5.7∘. The only feature observed in the northeastern lobe is its rim. The ’forward’ rim is brighter than the ’back’ rim. They both appear in the form of long, thin filaments that are best seen in the H images. The southwestern lobe shows a more complex structure. The filaments are typically about 2” wide and more than 40” long. The flow also contains six knots: the two brightest knots are C and E which lie 4’ and 2’4 from HH 120 along the southwestern lobe. Four smaller knots are visible inside the same flow. They are knots A, B, D and F and lie at an angular distance of 4’3, 3’9, 3’1 and 1’5 from HH 120. Surprisingly they appear brightest in the [O II] image. Both of the lobes are slightly curved in the direction towards the center of the Gum Nebula. The angle of curvature of the southwest lobe is larger and measures about 15∘.
3.2 Kinematics
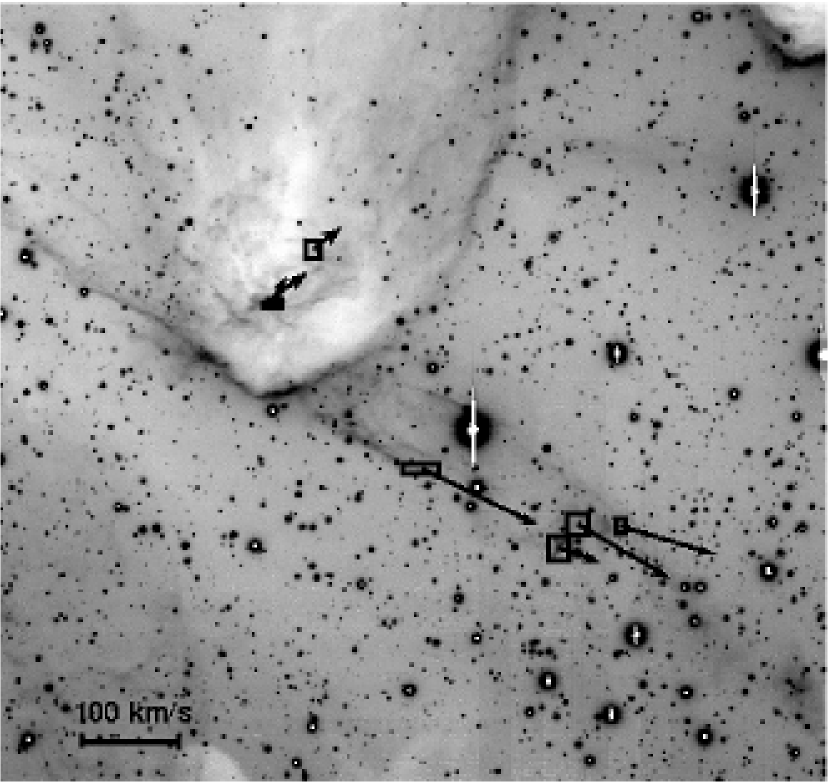
In order to study the kinematics of the outflows in the CG 30 complex, we derived proper motions of HH objects that appear in our images. The two images on which we based our measurements are the H NTT image and the Subaru image. The time elapsed between the images is 10.91 years (3985 days). Both H images were registered so they had the same pixel size, distortion and orientation. This was done by using the IRAF GEOMAP and GREGISTER tasks. In order to calculate the proper motions of chosen features, we used a 2D cross correlation technique. The results are presented in Table 3.
The quantities of the columns in Table 3 are: (1) labels of features, (2) proper motions in arcsec per century, (3) velocities in kms-1 assuming a distance of 450 pc, and (4) position angles of proper motion vectors in degrees.
The values of proper motions of the knots that form parts of the HH 950 flow are between 1.4 and 4”2/century and are oriented towards the southwest (position angles between 240-253∘), while the HH 120 knots propagate in a northwest direction (position angles between 309-332∘) and have proper motion values and /century. At an assumed distance of 450 pc, the projected velocities of the proper motions for the HH 950 knots are between 31 and 107 kms-1 and for the knots associated with HH 120 they are 26 and 45 kms-1.
We divided the HH 120 knots in two groups - knot E as one and all the other knots as the second group. We got two somewhat different proper motion vectors - the knot E seems to be propagating more westward than the other knots. From Figure 7 we see that the proper motion vector of the second group of knots of the HH 120 flow points directly towards HH 948.
Among the IR flows we obtained proper motion vectors for HH 949 (IR knots 5, 7 and 8). The calculated direction of motion is perpendicular to the axis on which six IR knots lie. The previous surveys have not revealed any young stellar object that could be a driving source for this HH object. We believe that this proper motion vector is affected by changes in the structure of the HH flow between the two epochs.
The proper motion vector of HH 948 is of particular interest. The value of the proper motion (/century) and the direction of the proper motion vector (308∘) are very similar to the proper motion vector of the HH 120 knots A, B, C and D (/century and 309∘). Both vectors lie along the line connecting these HH 120 knots and HH 948, and so may be parts of the same HH flow.
4 Discussion
Given the structural complexity of HH 120 together with our proper motion results, we believe that the HH 120 flow consists of at least two outflows, and possibly more. Knots A, I, J and K appear to form one flow. Knot G shows a long streamer to the west. Knots C, A and H could form a bipolar flow, and knot E possibly forms a separate flow. Its proper motion vector points more westward than the proper motion vector for the rest of the HH 120 knots.
Launhardt et al. (2000) discovered two sources in their survey in their submillimeter 850 m survey, lying in a north-south direction, which we call here CG30 SMM-N and SMM-S. The SMM-N source is probably a driving source for HH 120. Since it seems that HH 120 consists of at least two flows, the SMM-N source could actually be a binary or a multiple system.
The proper motion vector calculated for the group of knots that includes the knots C, A and H, points directly towards HH 948. The directions and the absolute values of the proper motions of these knots coincide well with the values of the proper motion of HH 948. We conclude that HH 948 is related to the flow to which knots C, A and H belong. The fact that there are other HH objects present around HH 120 gives further support to the assumption that there must be several outflows coming from SMM-N.
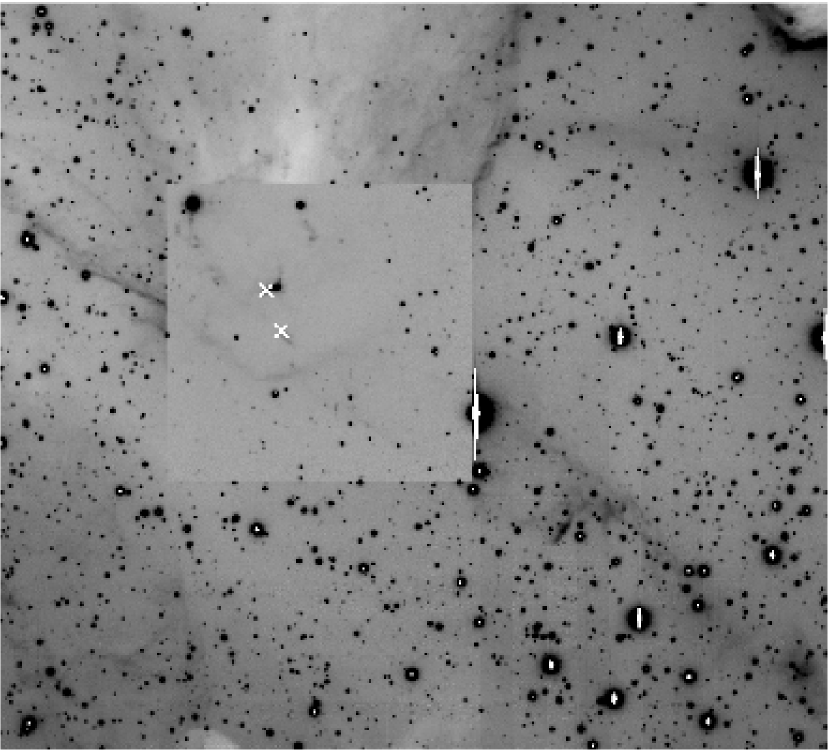
In order to put the IR and optical data in context, we combined both images into a single image (see Figure 8). The IR and optical HH knots are displayed there simultaneously. The two crosses that appear in the image mark the positions of the two submm sources discovered by Launhardt et al. (2000). It can be seen that SMM-S lies exactly on the axis defined by the IR knots 1, 3, 4, 5, 7 and 8. This makes it a perfect candidate for a driving source of this IR flow (as already proposed by Launhardt et al. 2000). However, is it also a driving source of the large HH 950 flow?
When examining the positions of these IR knots and the HH 950 knots at optical wavelengths we see that they do not lie on the same axis. Especially intriguing are the positions of the HH 950 knots B, C and F. The knots B and C are located in parallel positions along the southwestern lobe. The axis formed by the knot F, six IR knots and SMM-S also does not coincide with the one connecting SMM-S to any other feature that belong to the HH 950 flow. We compared the HH 950 flow with the HH 184 (Devine et al. 1999). This object exhibits a very complex and somewhat similar structure. It also shows HH knots that are located parallel along the flow’s axis. The authors of this work argue that the axis of this flow changes because its source is a primary star in a binary system with eccentric orbit. Whenever a secondary star (which emits a smaller jet) approaches the primary the flow’s axis changes rapidly. Because of this some of the knots produced in that moment appear to lie off-axis. When the secondary is further away from the primary (which is the majority of time, due to the high eccentricity of its orbit), the flow’s axis returns to its “normal” position.
If the same explanation applies for the HH 950 jet, then SMM-S also must be a binary system. However our arguments are based only on the structure of the HH 950 jet. We do not see a secondary jet that would confirm the binary nature of the HH 950 source.
There is also a question of the curvature of the HH 950 jet. It is slightly curved in the direction of the center of the Gum Nebula. This could be another indication that the driving source is a binary.
5 Conclusions
In this work we have studied Herbig-Haro objects associated with CG 30. We find that most of the HH objects belong to two flows: HH 120 and HH 950. The proper motions of the knots in HH 120 suggest that this object is actually composed of at least two outflows. The candidate for the driving source of HH 120 is the northern submm source CG30 SMM-N discoverd by Launhardt et al. (2000), which must therefore be a binary or a multiple system.
The southern submm source CG30 SMM-S is located exactly on the axis defined by six IR objects discovered by Hodapp & Ladd (1995). This leaves no doubt that these objects really do form one flow and that this submm source is its driving source (as was already suggested by Launhardt et al. 2000).
We propose that this flow forms a part of the large HH 950 flow that appears in our optical images. HH 950 consists of two lobes - while its northeastern lobe is almost featureless (the only visible feature is its bright rim), the southwestern lobe shows a complex structure made of fine filaments and knots. Interesting is the fact that the HH knots in this lobe do not all lie on the same axis. It seems that the axis swiftly changed toward the south at the time the knots B and C were produced. We argue that CG30 SMM-S could be a binary system. At least one member of the system is a young star emitting the HH 950 jet. The interaction of both objects causes the change of direction of the HH 950 axis.
Acknowledgments
We are grateful to an anonymous referee for a very careful and
helpful report. We thank Ralf Launhardt for providing the accurate
positions of the submillimeter sources and Klaus Hodapp for providing
us with the original infrared image of the CG 30. Primož
Kajdič acknowledges the Dirección General de Estudios de
Posgrado of the UNAM for a scholarship supporting his graduate
studies. This study has been supported by the NSF through grant
AST0407005. This material is based upon work supported by the
National Aeronautics and Space Administration through the NASA
Astrobiology Institute under Cooperative Agreement No. NNA04CC08A
issued through the Office of Space Science.
| Feature name | R.A. (hh:mm:ss.s) | Dec. (dd:mm:ss) |
|---|---|---|
| HH 948 | ||
| A | 08:09:30.6 | -36:04:25 |
| B | 08:09:30.6 | -36:04:19 |
| C | 08:09:31.8 | -36:04:16 |
| HH 949 | ||
| A | 08:09:36.8 | -36:04:29 |
| B | 08:09:37.2 | -36:04:27 |
| C | 08:09:37.4 | -36:04:26 |
| D | 08:09:36.8 | -36:04:25 |
| E | 08:09:37.2 | -36:04:25 |
| F | 08:09:36.5 | -36:04:35 |
| G | 08:09:35.7 | -36:04:50 |
| H | 08:09:37.7 | -36:04:20 |
| HH 120 | ||
| A | 08:09:32.5 | -36:04:55 |
| B | 08:09:32.9 | -36:04:56 |
| C | 08:09:32.6 | -36:04:56 |
| D | 08:09:32.8 | -36:04:56 |
| E | 08:09:33.1 | -36:04:56 |
| F | 08:09:33.0 | -36:04:55 |
| G | 08:09:32.3 | -36:04:58 |
| H | 08:09:32.3 | -36:04:55 |
| I | 08:09:32.5 | -36:04:53 |
| J | 08:09:32.5 | -36:04:51 |
| K | 08:09:32.4 | -36:04:44 |
| HH 950 | ||
| A | 08:09:14.6 | -36:07:15 |
| B | 08:09:16.5 | -36:07:12 |
| C | 08:09:17.8 | -36:07:27 |
| D | 08:09:22.1 | -36:07:07 |
| E | 08:09:24.6 | -36:06:40 |
| F | 08:09:28.6 | -36:06:10 |
| The submm sources (from Wu et al. (2007)). | ||
| North | 08:09:32.87 | -36:04:56.3 |
| South | 08:09:32.55 | -36:05:16.6 |
| Feature | Proper motion ( ”/century) | kms-1 | P.A. (degrees) |
|---|---|---|---|
| HH 120A, B, C, D | 1.3 | 26 | 332 |
| HH 120E | 2.1 | 45 | 309 |
| HH 948B | 1.4 | 31 | 308 |
| HH 950A | 3.8 | 82 | 253 |
| HH 950C | 4.2 | 89 | 240 |
| HH 950D | 1.8 | 38 | 250 |
| HH 950E | 5.0 | 107 | 244 |
 |
 |
 |
 |
 |
References
- [1] []bhatt99 Bhatt, H. C. 1999, MNRAS, 308, 40
- [2] []Chen99a Chen, X. P., Launhardt, R., Bourke, L. T. et al. 2008a, ApJ, 683, 862
- [3] []Chen99b Chen, X. P., Bourke, T.L., Launhardt, R., Henning, T. 2008b, ApJ, 686, L107
- [4] []Devine99 Devine, D., Reipurth, B., Bally, J., Balonek, T. J. 1999, AJ, 117, 2931
- [5] []graham89 Graham, J. R., Heyer, M. H. 1989, PASP, 101, 573
- [6] []Gum52 Gum, C. S., Obs, 72, 151
- [7] []Hawarden76 Hawarden, T. G., Brand, P. W. J. L. 1976, MNRAS, 175, 19
- [8] []Hodapp95 Hodapp, K. W., Ladd, E. F. 1995, ApJ, 453, 715
- [9] []kim05 Kim, J. S., Walter, F. M., Wolk, S. J. 2005, ApJ, 129, 1564
- [10] []knude99 Knude, J., Jønch-Sørensen, H., Nielsen, A. S. 1999, A&A, 350, 985
- [11] []knude00 Knude, J., Nielsen, A. S. 2000, A&A, 362, 1142
- [12] []Launhardt00 Launhardt, R., Sargent, A. I., Henning, Th., Zylka, R., Zinnecker, H. 2000, Birth and Evolution of Binary Stars, poster proceedings of IAU Symp. No. 200, eds. B. Reipurth & H. Zinnecker, p. 103
- [13] []Nielsen98 Nielsen, A. C., Olberg, M., Knude, J., Booth, R. S. 1998, A&A, 336, 329
- [14] []nielsen00 Nielsen, A. S., Jønch-Sørensen, H., Knude, J. 2000, A&A, 358, 1077
- [15] []nisini02 Nisini, B., Garatti, C. A., Giannini, T., Lorenzetti, D. 2002, A&A, 393, 1035
- [16] []persi94 Persi, P., Ferrari-Toniolo, M., Marenzi, A. R., Anglada, G., Chini, R., Krügel, E., Sepúveda, I. 1994, A&A, 282, 233
- [17] []Pettersson84 Pettersson, B. 1984, A&A, 139, 135
- [18] []Reipurth81 Reipurth, B. 1981, A&AS, 44, 379
- [19] []Reipurth83 Reipurth, B. 1983, A&A, 117, 183
- [20] []scarrott90 Scarrott, S. M., Gledhill, T. M., Rolph, C. D., Wolstencroft, R. D. 1990, MNRAS, 242, 419
- [21] []Schwartz77 Schwartz, R. D. 1977, ApJ, 212, 25
- [22] []Schwartz03 Schwartz, R. D., Greene, T. P. 2003, AJ, 126, 339
- [23] []Westerlund63 Westerlund, B. E. 1963, MNRAS, 127, 71
- [24] []Wu07 Wu, J., Dunham, M. M., Evans, N. J. II, Bourke, T. L., Young, C. H. 2007, AJ, 133, 1560
- [25] []Zealey83 Zealey, W. J., Ninkov, Z., Rice, E., Hartley, M., Tritton, S. B 1983, ApL, 23, 119
- [26] []zinnecker99 Zinnecker, H., Krabbe, A., McCaughrean, M. J., Stanke, T., Stecklum, B., Brandner, W., Padgett, D. L., Stapelfeldt, K. R., Yorke, H. W. 1999, A&A, 352, L73