Graph Creation, Visualisation and Transformation
Abstract
We describe a tool to create, edit, visualise and compute with interaction nets — a form of graph rewriting systems. The editor, called GraphPaper, allows users to create and edit graphs and their transformation rules using an intuitive user interface. The editor uses the functionalities of the TULIP system, which gives us access to a wealth of visualisation algorithms. Interaction nets are not only a formalism for the specification of graphs, but also a rewrite-based computation model. We discuss graph rewriting strategies and a language to express them in order to perform strategic interaction net rewriting.
1 Introduction
Graph representation and graph transformations are important in Computer Science. It is well known that graphical formalisms have clear advantages as modelling tools, in particular in the earlier phases of system specification and development. Graphical formalisms are more intuitive and make it easier to visualise the system, whether in theoretical or practical domains. For example, consider the textual representation of proofs in the sequent calculus [6] versus proof nets [7], the entity-relationship diagrams [3] used to specify a relational database versus the tables, etc.
On the negative side, there are some well-known implementation problems when dealing with graphical formalisms (pattern-matching is not an easy problem, see for instance [13]), and graph rewriting can be inefficient in general. Graphical editors and graphical programming environments exist, but none of the available tools to manipulate graphs provides a unified framework to create, edit and visualise graphs, and to define dynamic transformations. Ideally, such a tool should allow users to create graphs, edit them and define different views, export to different formats (e.g., image files, encapsulated postscript, latex macros, etc.), and should also be able to model some notion of computation, allowing the user to evaluate parts of their graphs using transformation rules plugged into the tool.
In this paper, we describe the design of an editor to draw graphs and their transformation rules, and its integration into a tool that can be used to visualise graphs and their associated computations. The editor, called GraphPaper, is tailored for the design of interaction net [11] systems. These are graph rewriting systems where nodes are connected by edges attached to ports, and the rewriting rules are constrained in order to ensure useful rewriting properties, such as confluence, by construction. The user interface of GraphPaper mimics the operations that users perform to draw graphs manually in paper. Several checks are automatically performed to facilitate the construction of interaction nets and rewriting rules.
Graph rewriting needs complex pattern matching, but in the case of interaction nets, the pattern-matching algorithm is simpler due to the restricted form of the left-hand sides of the rules. Still, there are several problems that have to be solved in a graphical editor, due to the changes in the layout that may arise after a rewriting step. Furthermore, users of graph rewriting systems often need to define specific strategies dictating how and when rules are applied, thus a formal language is needed to express these strategies.
The GraphPaper editor simplifies the task of creating interaction nets and rules, and provides an interface with the TULIP111http://www.tulip-software.org system for analysis and visualisation. Strategic interaction net rewriting, tracing and debugging are implemented as extensions of the TULIP system.
TULIP is an environment for graph visualisation which provides us with algorithms to display graphs in various formats, and to check static properties of graphs. We use GraphPaper to create and edit our graph systems, which are then exported to TULIP. Although TULIP provides powerful visualisation and analysis algorithms, the standard version of TULIP has no features relating to graph rewriting and the notion of port, which is essential to our rewriting systems, is not available. However, TULIP is extensible and plugins can be added to implement graphs with ports, such as interaction nets, as well as pattern matching and rewriting. We describe the main components of the system below.
In future work, we will also include a mechanism for tracing graphs during the rewriting process to allow greater control and facilitate the debugging of the rewriting system. This is work in progress within the PORGY collaboration between INRIA Bordeaux and King’s College London, which focuses on graph visualisation and rewriting strategies for interaction nets and port graphs [10] in general.
Related Work
There are many graphical editors available, but only a few of them allow the user to specify dynamic information in the form of graph rewriting rules. Below we discuss four systems that include this functionality and are directly related to our work.
The Interaction Net Laboratory (INL)222http://inl.sourceforge.net/ developed by De Falco is a graphical editor for interaction nets. It has a rich feature set with a Net editor and a Rule editor. Cells can be created and have properties such as “title” and “colour”. Feature wise, INL is quite complete for creating and editing nets and rules but the user-interface has some limitations. Clicking on objects does not result in immediate visual feedback. To add cells to the net the user has to click on the cell in the list to the left and then click somewhere on the net. To add more than one of the same kind of cell, one has to keep on re-clicking on the cell that is in the list.
The Graphical Interpreter for Interaction Nets developed by Lippi [12] imports a text based representation of a net and a set of reduction rules and creates a graphical net. The user can then choose to reduce the net step by step or to perform all possible reductions in one go. While this program is useful for displaying a net and visualising its reduced form, the user still needs to input and edit the nets using a text-based language.
INblobs333http://haskell.di.uminho.pt/jmvilaca/INblobs/ developed by Vilaça et al. [2] defines itself as an editor and interpreter for Interaction Nets. Feature wise, INblobs is on par with INL but suffers from similar problems.
PROGRES is a programming environment based on graph grammars developed at the University of Technology Aachen444See http://www-i3.informatik.rwth-aachen.de/tikiwiki/tiki-index.php. It is built around an executable specification language based on a specific kind of graph rewriting rules. The environment provides a graphical editor for the specification language and a translator into C and Tcl/Tk-code. The tool seems to focus on the specification language, which is expressive enough to allow the user to model complex systems using graphs. Our goals are different: we focus on the graphical editor and in the principles behind the design of a graphical interface for the representation of graphs.
Overview of the paper
Section 2 provides a concise introduction to interaction nets and rewriting strategies. In Section 3 we describe GraphPaper’s novel “digital paper” user interface. Section 4 deals with visualisation and rewriting; we describe the architecture of the system and its implementation via TULIP. Section 5 contains conclusions and directions for future work.
2 Preliminaries
2.1 Interaction Nets
A system of interaction nets is specified by a set of symbols with fixed arities, and a set of interaction rules. An occurrence of a symbol is called an agent. If the arity of is , then the agent has ports: a principal port depicted by an arrow, and auxiliary ports. Such an agent will be drawn in the following way:
Intuitively, a net is a graph (not necessarily connected) with agents at the vertices and each edge connecting at most 2 ports. The ports that are not connected to another agent are free. There are two special instances of a net: a wiring (no agents) and the empty net; the extremes of wirings are also called free ports. The interface of a net is its set of free ports.
An interaction rule replaces a pair of agents connected together on their principal ports (an active pair or redex, written ) by a net with the same interface. Rules must satisfy two conditions: all free ports are preserved during reduction (reduction is local, i.e. only the part of the net corresponding to the redex is modified, no global modifications are required), and there is at most one rule for each pair of agents. Because of this last restriction, a rule is fully determined by its left hand-side; such a rule will thus be sometimes denoted by as well. The following diagram shows the format of interaction rules ( can be any net built from ).
We use the notation for the one-step reduction relation, or if we want to be explicit about the rule used, and for its transitive and reflexive closure. If a net does not contain any active pairs then we say that it is in normal form. The key property of interaction nets, besides locality of reduction, is that reduction is strongly confluent. Indeed, all reduction sequences are permutation equivalent and standard results from rewriting theory tell us that weak and strong normalisation coincide (if one reduction sequence terminates, then all reduction sequences terminate). We refer the reader to [11] for more details and examples.
2.2 Rewriting Strategies
A graph rewriting system may have a potentially large set of rules to apply to a graph. The order in which rules are applied can greatly alter the end graph when general graph rewriting is considered. In the case of interaction nets, the strong confluence property ensures that all reduction sequences to full normal form are equivalent. However, this is not the case if we use a notion of reduction that does not reach a full normal form (for instance, reduction to interface normal form [5]). Also, for interaction nets, even if the end graph does not change, the size and layout of the graph during the rewriting process can differ depending on what rules and where they are applied first. Users may therefore want to not just blindly apply rules but to create a strategy around these rules to direct the rewriting.
Strategic rewriting has been studied for term rewriting systems, and there are languages that allow the user to specify a strategy and to apply it [4, 14]. In this paper we will define a language to define strategies for graph rewriting systems, where not only the strategy needs to take into account rules and sequences of rules but also location and propagation in a graph (the latter is complicated by the fact that in a graph there is no notion of a root, so standard term rewriting strategies based on top-down or bottom-up traversals do not make sense in this setting). Because of this, we develop a specific language to deal with strategies for interaction nets, which can be also applied to general graph rewriting systems.
3 GraphPaper
3.1 Digital Paper
In the past few years, new technology has shown that new Human Interface Devices (HID) can be an efficient way of dealing with digital information. There is the example of video games with Nintendo’s Wii and DS consoles. One allows users to perform natural motions to convey commands (swinging your arm to swing a sword) while the other lets the user draw to the screen using a tablet. These methods of interaction have been hugely popular across all sorts of demographics. Also many new mobile devices now come with touch-screen and therefore software makers have had to rethink the way users interact with their phones. Much like the Nintendo consoles, touch screen phones (like the Apple iPhone) have also been very popular across all demographics.
It is indeed more natural to push and pinch a map around on a touch screen to move it than it is using a mouse and icons. This is because these new HID mimic natural motions. The data that are represented in this case are graphs where the natural instinct is to use a pen and paper to draw them. We will take this intuition and try to apply it to the HCI ideology of GraphPaper. A user should feel like (s)he is using a pen and paper but with the dynamic advantages of a computer.
For graphs, agents and edges are the two types of data that the user will interact with. This allows the tool to have a simple interface. There is no need to have a toolbar to activate whether the user is trying to interact with agents or edges; it is possible for the tool to deduce what the user is interacting with based on the context of the interaction. For example, edges need to be created between ports so cannot be created independently. This means that if the user is trying to work on an empty part of the canvas, they are trying to create agents or a wiring. When the user tries to interact with ports of an agent, then we know that the goal is to create or edit edges to and from that agent. For more complex operations on graphs shape recognition is needed (see, for instance, [8]). Once a shape is recognised, the user’s intention can be deduced by the context and location where the shape was drawn.
Here is an outline of shapes and some of their actions depending on context:
-
•
Circular: In GraphPaper, circular shapes are used to represent nodes in the graph, but may also have other meanings, depending on the state of the canvas where the shape is being created. We show below two examples.
![[Uncaptioned image]](/html/1003.4326/assets/x1.png)
If created on an empty space then a new agent is created there.
![[Uncaptioned image]](/html/1003.4326/assets/x2.png)
If other agents are inside the bounds of the circle, the user’s intention was to select those agents. The circle becomes a lasso selection tool.
-
•
Line: In GraphPaper, lines are interpreted in different ways depending on the context. We give two examples below.
![[Uncaptioned image]](/html/1003.4326/assets/x3.png)
If a line is drawn between two ports, an edge is created between them
![[Uncaptioned image]](/html/1003.4326/assets/x4.png)
If a line is drawn from inside an agent to just outside of it, then a port is created at that location on the agent.
In the case of interaction nets, all agents must have one principal port and zero or more auxiliary ports. In this case, when agents are created, a principal port is automatically added.
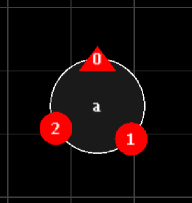
Users can label nodes with names simply by writing the name inside the circle that represents the agent. When another node with the same name is created, GraphPaper automatically adds the corresponding number of ports. Ports are uniquely numbered with port 0 representing the principal port. To easily distinguish this port visually from the auxiliary ports, GraphPaper draws it as a triangle, as depicted in Figure 1.
GraphPaper has two states that the user can be in when it comes to the creation of graphs. A view/edit state and a draw state:
-
•
The view/edit state will allow the user to modify already created agents and edges. For example, moving agents around, renaming agents and ports, etc. The user will also be able to modify the view by panning around and zooming in and out.
-
•
The draw state is where the user can create and delete new objects by drawing to the screen. See the previous examples of creation.
3.2 Drawing Rules
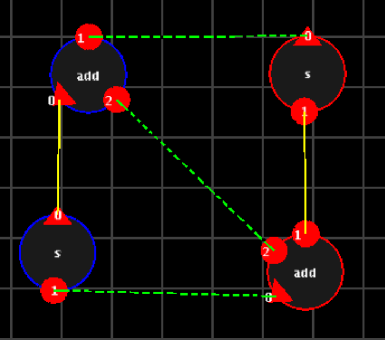
Graph rewriting rules consist of a left hand side graph and a right hand side graph, and a mapping that defines the relation between the interfaces of the graphs. In the case of interaction nets, both sides must have the same interface, and the left hand side must be a graph consisting of two agents connected through their principal ports. To draw an interaction rule using GraphPaper, the user simply draws the two agents in the left hand side in the standard way, and then lasso selects them. In this way GraphPaper moves to the rule drawing mode, and the user can continue drawing the right hand side. The correspondence between ports of the interface in the left hand side and in the right hand side is explicitely indicated by joining the ports (GraphPaper will show these links in a different colour). GraphPaper will then deduce this is a rule, and will isolate it to a part of the paper where users can still have access to it if they need to modify it.
Figure 2 shows an example screen of a rule. Green dotted wires represent the correspondences between interface ports in the left-hand side and right-hand side nets.
4 Graph Rewriting
For the visualisation and transformation of graphs, GraphPaper uses the functionalities available through the TULIP555http://www.tulip-software.org tool developed at INRIA Bordeaux. We describe below the main features of GraphPaper as a graph rewriting tool.
-
•
Pattern Matching: the current version of TULIP does not provide a pattern-matching algorithm, but it has a built in search function that can iterate through a graph of potentially very large size. Using this iteration function, we can then build a pattern matching algorithm to find possible reductions in a graph. In the case of general graphs, the high complexity for pattern matching is greatly aided by the efficient iteration that TULIP provides. For Interaction Nets, it is simply a case of iterating through all the edges, finding the ones that connect two principal ports and adding them to a list. After every reduction, we then just need to iterate through that new sub-graph and its neighbours to find new active edges and add those to the list. There is no need to search the entire graph for new active edges since the reduction only affects the new sub-graph and its neighbours.
-
•
TULIP is capable of displaying graphs with over 1,000,000 elements and can display graphs of that size in real time. GraphPaper inherits this power, allowing the user to work with graph rewriting systems where graphs grow after each rewrite step.
-
•
Visualisation: TULIP provides dynamic visualisation of graphs, that is to say if a sub-graph is added or removed, the remaining graph dynamically changes its appearance to a chosen visual model (for example a cone tree, circular, planar). This is particularly useful in the case of rewriting graphs since once a rewrite occurs, the graph might need to be redrawn to accommodate for extra or lack of spacing.
-
•
Strategies: As discussed in Section 2.2, strategies for graph rewriting need to specify the way rules will be applied and must also be aware of location. We propose to use expressions generated by the following grammar:
where is the identity (which never fails and always leaves the graph unchanged); is a strategy that always fails (it leaves the graph unchanged and returns failure); is an expression of the form that denotes the application of rule in the graph (which can be selected using the graphical interface) or its neighbours up to the given depth (as explained below), this strategy may fail is the rule is not applicable in the designated subgraph; represents sequential application: apply and if successful then apply (if either of them was unsuccessful the result is a failure); represents simultaneous application (both strategies must be applied at the same time); means “apply S as many times as possible in a row”; and means apply , if it fails then apply (not both). Note that when defining a graph rewriting strategy as a parallel composition (i.e., simultaneous application of two strategies), conflicts may arise. However, in the case of interaction nets, the constraints on interaction rules imply that each pair of agents can only be involved in one interaction rule, hence all redexes can be simultaneously reduced without conflict.
The basic blocks to build a strategy are a rule and the identity. When we indicate that a rule will be applied, we must also provide the location where the rule should be applied. This is given by the arguments and , i.e., we specify a subgraph, and the represents how far one should look through the ’s neighbours for a possible application of the rule. If we want it to be strict, i.e. apply the rule in the given subgraph only, we use . To look as far as possible starting from the given subgraph we use the value . The expression indicates that we want to apply the rule in the subgraph that includes and all the neighbours at distance 1. To look steps out of the then set to . In the case of interaction nets, the search only follows principal ports of the nodes.
For convenience, when composing strategies we allow the user to factor out the common sub-expressions: If we compose strategies that have the same location (same subgraph and depth) we can write these parameters only once (e.g. indicates that we want to apply and then to the subgraph ), and if we wish to apply the same strategy at several locations in the graph, we can write for example , meaning that we need to apply followed by in and also in .
We also define auxiliary functions () which returns a graph containing the interface nodes of , and . The first, used with , allows the user to easily write strategies that give priority to rewriting steps at the interface of the : for example, tries to apply on nodes of the interface and their neighbours. This is useful when computing interface normal forms of interaction nets.
As an example the following strategy is a strategy that will take the strict interface of the subgraph and either apply or once and then apply as many times as possible.
-
•
Trace: Each time a rewrite is performed, a new graph is created. To keep track of the rewriting history, we use a Trace that will store all the different graphs, and if one graph is the result of a rewrite of another then an edge is created from the latter to the former with the rule and location of the rewriting as its label. Since more than one rewrite is possible at any one time, the Trace will branch for each one, allowing the user to see all the possibilities. The Trace will therefore take on the shape of a tree, as depicted in Figure 3, where the main components of the system are shown.
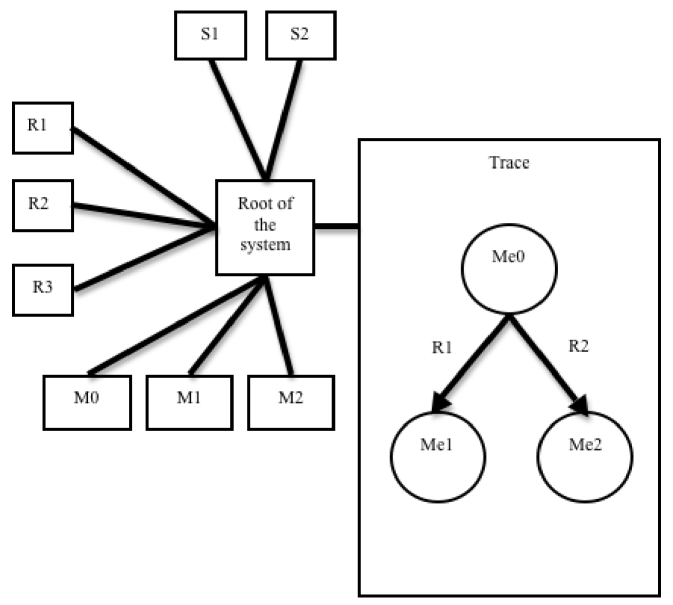
Figure 3: A schematic description of the main components of the system. -
•
Architecture: Since TULIP is very efficient when it comes to storing graphs, we define and represent everything using a main graph which we call root graph, see Figure 3. The set of rules () and strategies () are also stored as subgraphs of the root graph and each have a unique name. A base model M0 is also created as a subgraph of the root graph and holds the initial state of the graph the user will be rewriting on. The trace is also subgraph of the root. Below we show a GUI concept for TULIP perspective with an example trace:
![[Uncaptioned image]](/html/1003.4326/assets/x8.png)
In this particular example, a graph was created by the user (stored as in the trace) and rules and were applied to . The user then selected in the to get a closer look at .
5 Conclusion and Future Work
GraphPaper functions as a stand-alone tool used specifically to create and edit graphs and their rules and strategies. The graph system created can then be exported into TULIP where the rewriting will happen based on a selected strategy. The tool will generate a of the rewriting as it happens and then allow the user to observe any point of the rewrite in more detail. The ease of use of GraphPaper combined with the power of TULIP and the detailed information provided by the Trace gives the user an environment to work on graph rewriting systems, and interaction nets in particular, efficiently and intuitively. In particular, GraphPaper can serve as an editor for visual programming languages based on interaction nets (see [9]).
In future and within the PORGY collaboration, we hope to develop the tools to support more general forms of graph rewriting by implementing a more complex and versatile pattern matching algorithm. We will also extend the interface for rule definition in GraphPaper, in order to represent more general kinds of rules, such as the ones used in PortGraph systems [10].
References
- [1]
- [2] José Bacelar Almeida, Jorge Sousa Pinto & Miguel Vilaça (2007): A Tool for Programming with Interaction Nets. In: Joost Visser & Victor Winter, editors: Proceedings of the Eighth International Workshop on Rule-Based Programming. Elsevier. To appear in Electronic Notes in Theoretical Computer Science.
- [3] Richard Barker: Case*Method: Entity Relationship Modelling. Addison-Wesley.
- [4] Peter Borovansky, Claude Kirchner, Hélène Kirchner, Pierre-Etienne Moreau & Christophe Ringeissen (1998): An Overview of ELAN. In: Hélène Kirchner, Claude & Kirchner, editor: Second Workshop on Rewriting Logic and its Applications - WRLA’98 Electronic Notes in Theoretical Computer Science, Electronic Notes in Theoretical Computer Science 15. Elsevier Science B. V., Pont-à-Mousson, France, p. 16 p. Available at http://hal.inria.fr/inria-00098518/en/. Colloque avec actes et comité de lecture.
- [5] Maribel Fernández & Ian Mackie (1999): A Calculus for Interaction Nets. In: Proceedings of PPDP’99, Paris, number 1702 in Lecture Notes in Computer Science. Springer.
- [6] G. Gentzen (1969): Investigations into Logical Deduction. In: M. E. Szabo, editor: The Collected Papers of Gerhard Gentzen. North-Holland.
- [7] Jean-Yves Girard (1987): Linear Logic. Theoretical Computer Science 50(1), pp. 1–102.
- [8] T. Hammond (2007). LADDER: A Perceptually-Based Language to Simplify Sketch Recognition User Interfaces Development. MIT PhD Thesis.
- [9] Abubakar Hassan, Ian Mackie & Jorge Sousa Pinto (2008): Visual Programming with Interaction Nets. In: Gem Stapleton, John Howse & John Lee, editors: Diagrammatic Representation and Inference, 5th International Conference, Diagrams 2008, Herrsching, Germany, September 19-21, 2008. Proceedings, Lecture Notes in Computer Science 5223. Springer, pp. 165–171.
- [10] Hélène Kirchner & Oana Andrei (2007): A Rewriting Calculus for Multigraphs with Ports. Proc.8th Int. Workshop on Rule-Based Programming (RULE07) .
- [11] Yves Lafont (1990): Interaction Nets. In: Proceedings of the 17th ACM Symposium on Principles of Programming Languages (POPL’90). ACM Press, pp. 95–108.
- [12] Sylvain Lippi (2002): in2: A Graphical Interpreter for Interaction Nets. In: RTA ’02: Proceedings of the 13th International Conference on Rewriting Techniques and Applications. Springer-Verlag, London, UK, pp. 380–386.
- [13] J.R. Ullman (1976): An Algorithm for Subgraph Isomorphism. Journal of the ACM 23(1), pp. 31–42.
- [14] Eelco Visser (2001): Stratego: A Language for Program Transformation based on Rewriting Strategies. System Description of Stratego 0.5. In: A. Middeldorp, editor: Rewriting Techniques and Applications (RTA’01), Lecture Notes in Computer Science 2051. Springer-Verlag, pp. 357–361.