Criticality in Trapped Atomic Systems
Abstract
We discuss generic limits posed by the trap in atomic systems on the accurate determination of critical parameters for second-order phase transitions, from which we deduce optimal protocols to extract them. We show that under current experimental conditions the in-situ density profiles are barely suitable for an accurate study of critical points in the strongly correlated regime. Contrary to recent claims, the proper analysis of time-of-fight images yields critical parameters accurately.
pacs:
64.70.Tg, 03.67.Ac, 67.85.Hj, 74.20.-zRecent breakthroughs in cold atom lattice experiments have paved the road to reliable studies of condensed matter physics by emulating its intractable models. Although the identification of phases in present experiments is nearly universally accepted, the mesoscopic size and the presence of a curved potential have long plagued our understanding of criticality in optical lattice experiments. This has sparked vivid debates Diener07 ; Gerbier07 ; Kato08 ; Zhou09 ; Trotzky09 for even the simple normal-to-superfluid (N-SF) U(1) symmetry breaking transition for interacting bosons. In order to be reliable quantum emulators, cold atom experiments need a generic protocol for studying critical behavior, and they need to do so without invoking numerical simulations.
The original experiments in optical lattices Greiner02 were based on time-of-flight (TOF) images and the emergence of a ‘sharp’ peak in the momentum distribution. The approach is adequate for identifying superfluid and normal phases, but it lacks an explicit procedure for locating the phase boundary, since peaks already develop in the normal phase due to an increasing correlation length Kashurnikov02 ; Wessel04 ; Pollet04 ; Schroll04 . It has been proposed in Ref. Kollath04 that one should trace the evolution of the peak shape, and use the increase in the peak width as the transition signature. The peak width keeps decreasing across the transition point however, and this leaves room for subjective data analysis and thus increased error bars. Monitoring both the peak width and the number of particles in the low-momentum peak has been used recently in measuring the N-SF transition temperature and its suppression on approach to the Mott insulating phase Trotzky09 .
Difficulties with the analysis of TOF images and advances in single-site resolution detection methods Gemelke09 ; Bakr09 prompted the authors of Ref. Zhou09 to propose that finite-temperature critical points of strongly correlated quantum models emulated by an optical lattice experiment can be generically deduced from cusps in the derivative of the density profile of atoms in the trap with respect to the external potential, . Within the local density approximation (LDA) approach this quantity coincides with the compressibility . However, the proposal of Ref. Zhou09 was shown not to work under realistic experimental conditions Comment .
The goal of this Letter is to answer qualitatively and quantitatively whether determining critical parameters in a trapped system using available experimental techniques is feasible. First, we employ the theory of finite-size effects in critical phenomena discussed recently for trapped systems by Campostrini and Vicari ettore to set theoretical limits on the accurate location of phase transition points in a given trap for a generic, strongly correlated system. Second, we demonstrate that LDA violations in density profiles indicate critical behavior, not LDA itself. The calculations show, however, that experimental data should have extremely small error bars, well below what is currently available. Taking the numerical derivative of the density profiles is of no help, and is always either too noisy or lacking features associated with criticality. Third, we demonstrate that detection methods coupling directly to critical modes, e.g., TOF images in the case of the N-SF transition, do allow one to reach the theoretical limit. From the analysis of the central peak shape width we construct a quantity with a sharp minimum at the critical point. Our considerations apply to any scale-invariant second-order phase transition.
We simulate the 3D Bose-Hubbard model,
| (1) |
where is the matrix element describing the hopping of bosons between nearest-neighbor sites, is the on-site repulsion, is the trapping potential, and is the on-site occupation number in terms of bosonic creation and annihilation operators. In what follows, we use as the unit of energy.
Let the phase transition occur around the chemical potential , where is the critical point in a homogeneous system, and is situated away from the trap center. By the very nature of second-order phase transitions, characterized by a divergent correlation radius at , there exists a finite shell centered at in which LDA fails. Indeed, LDA implies quasi-homogeneity of the system when the change of thermodynamic properties of the system is negligible at the distance of the order of correlation radius. Clearly, the quasi-homogeneity is preserved as long as , and is violated otherwise, the latter inevitably happening when , where we have used the shorthand notation . The condition
| (2) |
defines the position of the boundaries of the LDA violated region, and the largest possible correlation radius. The value of controls the rounding effects, similar to a finite-size system, leading to an intrinsic uncertainty in determining critical parameters: , where is the correlation length exponent. To cast all relations in dimensionless form we introduce a typical scale for the chemical potential, , which we choose such that when is changed by the system density changes by a factor of two. We also introduce the healing length as the typical length scale. Then, .
In a constant potential gradient, Eq. (2) implies
| (3) |
Assuming spherically symmetric harmonic confinement, we have . By introducing the typical cloud size using , the final estimate for can be identically rewritten as
| (4) |
Obviously, the best accuracy is found when the critical point is located at the trap center where the chemical potential gradient is zero. In this case the derivation has to be repeated along the same lines using for the change of the chemical potential over the correlation length. The self-consistent solution then takes the form
| (5) |
reproducing the result of Ref. ettore for scaling of the correlation length with the trap size. For the N-SF transition () in the strongly correlated Bose lattice system, the size is , which leads to the conclusion that the critical point may, in principle, be determined with a relative accuracy of a few percent. Note that this estimate is assuming that system properties are known exactly, i.e., it does not take into account experimental noise which we consider next.
Density profiles can be measured with single-site resolution Gemelke09 ; Bakr09 , and, under ideal experimental conditions, further averaged over about a hundred shots. Unfortunately, the density and its derivative are continuous functions across the N-SF transition point. More precisely, the critical contribution to compressibility, , is of the form , where with slightly different amplitudes on the two sides of the transition. For the , example considered below the value of is about . To understand the effect of critical fluctuations on density profiles we invert the definition of compressibility and calculate the deviation of the density at point from the thermodynamic limit value as
| (6) |
This equation accounts for LDA violations due to the difference between the thermodynamic expression for the critical part of compressibility and its maximal value in a system of size . Given the small value of for most continuous phase transitions we can write
| (7) |
which allows us to estimate the size of the effect in realistic traps using Eqs. (4) and (5). The largest LDA violation is expected at the trap perimeter where the chemical potential gradients are large.
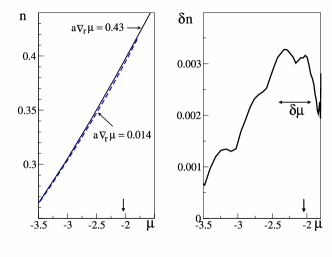
Since the critical value of the density is not known a priori, one should measure density profiles with different global chemical potentials , or in traps with different confinement frequencies , convert them to curves, and plot them in the same figure. The expectation is that densities measured at different chemical potential gradients will show the largest deviation from each other in the critical region. Unfortunately, the size of the effect is supposed to be rather small in the strongly correlated regime where is not large, see Eq. (7). The best possible contrast can be found when the profile with the critical region in the center is subtracted from the profile with the critical region in the perimeter , yielding , and thus using the system with the smallest size of the critical region as the reference curve. From Eqs. (4), (5), and (7) we deduce that obtained for profiles with the critical point at the trap perimeter and the trap center is about
| (8) |
which for the N-SF transition with size is as small as , i.e., it is about a few tenths of a percent only! In Fig. 1 we show the result of the Monte Carlo simulation Prokofev98 ; Pollet07 of a trapped system for , , and , where is the lattice constant. As expected, the largest LDA violations are observed for the curve with the critical point closest to the trap center. From the position of the maximum we deduce that , and .
It is thus possible, in principle, to determine critical points with an accuracy of about 10-20% by examining LDA violations in density profiles provided they are measured with extremely high accuracy at the trap center. [Note that we implicitly assume that experiments are able to determine the system temperature and chemical potential by other methods, e.g., using the equation of state at the trap perimeter, entropy matching, etc.] It is evident from Fig. 1 that density profiles have to be measured with a relative accuracy of . As far as we know such accuracy is not available in current experiments. The noise in the density at the trap center is determined by the number of experimental runs because in one measurement . Optimistically, the error bars on radial density are about at the trap center, quickly reducing to at a distance due to radial averaging. Hypothetically, it would be possible to have data in three-dimensional systems with accuracy of at a distance with signal-to-noise ration close to unity if all other experimental uncertainties are eliminated.
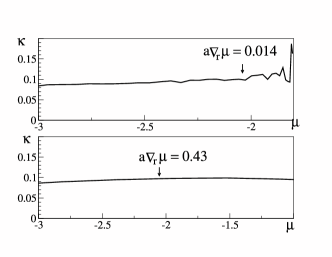
Our final note concerns density profile derivatives . It is clear from the beginning that measures based on integrals of , i.e., the LDA violations discussed above, contain all the information and are more sensitive because they efficiently average out the noise in numerical derivatives. Indeed, in the upper panel of Fig. 2 we show that deduced from the profile giving the largest signal in Fig. 1 is meaningless. Derivatives taken away from the trap center are less noisy, but they also lack any signature of the critical point due to the rounding of critical singularities by large chemical potential gradients, see the lower panel in Fig. 2. In general, LDA violations are a direct consequence of a diverging length scale while rounded peaks in derivatives are not necessarily originating from criticality and may thus be misleading, especially when searching for novel phases.
There is thus no viable alternative to directly studying critical modes. For the N-SF transition they are encoded in the low-momentum part of the distribution measured in TOF images. Here, we discuss the best case for the accuracy when the phase transition starts in the middle of the trap. In a homogeneous system, on approach to the critical point from the normal phase the peak in the momentum distribution around is described by
| (9) |
where is the correlation function exponent (for most critical points is positive and small; for the N-SF transition ). In a trap, we have to account for the fact that depends on the position in space since for a given detuning at the trap center, , we have at some distance . Although shells away from the center have smaller (in the normal phase) they have an increasingly larger volume. Curiously, in a wide trap the peak amplitude, , at the critical point is determined by regions with short correlation length because the LDA integral for
| (10) |
diverges at large meaning that the major contribution comes from a region with , a posteriori justifying the use of LDA for evaluating the peak amplitude.
Thus, at the TOF image remains relatively broad and the critical region at the trap center is not dominating in the signal amplitude in the theoretical limit of a very broad trap. [ As we show in Fig. 3, it remains a sizable of the total signal for a realistic trap with ]. Past the critical point, the low-momentum part of the distribution develops the condensate peak smeared out by the presence of the trapping potential and the finite size of the SF domain superimposed on the broader peak representing the critical shell separating normal and superfluid phases.
The all-decisive question is how to “read out” the critical point.
Our proposal is
based on monitoring the development of the bimodal structure
at low momenta across the transition point.
We note that the shape (in contrast to the value of the signal) of at small momenta is
determined by the critical region at the center because
the first (and also higher-order) derivative, ,
is described by an integral over which diverges
at the lower limit! This suggests the following protocol
for analyzing the data:
(i) find the momentum at which the absolute value of the first derivative
has a maximum;
(ii) construct the “amplitude of the critical signal” as the difference
;
(iii) plot , with some exponent ,
as a function of temperature to “read out” the critical point from the
minimum in .
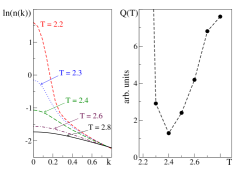
By construction, and , and thus the choice of is ensuring that is decreasing on the normal side of the transition as approaches . On the superfluid side, the formation of the condensate at the trap center results in a sharp increase of the peak amplitude and thus . The critical point is then estimated from the position of the minimum in . In Fig. 3 we present results of Monte Carlo simulations for our reference system, , done at various temperatures in a trap with , and . The original data for shown in the left panel were analyzed to produce the curve shown in the right panel. The position of the minimum at gives the correct value of the critical temperature with an accuracy of limited by the temperature grid; otherwise the error bars are obtained from the FWHM of .
If the momentum resolution of TOF images is better than the limit set by Eq. (5), including finite time-of-flight Gerbier08 , optical broadening and resolution effects Trotzky09 , then we believe the same accuracy would be possible experimentally. For columnar images, the exponent can be reduced to .
In conclusion, critical points in strongly correlated states of trapped atomic systems can be measured with relative accuracy of a few percent. The most sensitive signal-to-noise probes are based on critical modes with diverging correlation functions.
This work was supported by the Swiss National Science Foundation, the National Science Foundation under Grant PHY-0653183, and a grant from the Army Research Office with funding from the DARPA OLE program. Simulations were performed on the CM cluster at UMass, Amherst, and Brutus cluster at ETH Zurich; use was made of the ALPS libraries for the error evaluation ALPS .
References
- (1) R. B. Diener, Q. Zhou, H. Zhai, and T.-L. Ho, Phys. Rev. Lett. 98, 180404 (2007).
- (2) F. Gerbier, S. Fölling, A. Widera, and I. Bloch, arXiv:cond-mat/0701420 (2007).
- (3) Y. Kato, Q. Zhou, N. Kawashima, and N. Trivedi, Nature Physics 4, 617 ( 2008).
- (4) Q. Zhou, Y. Kato, N. Kawashima, and N. Trivedi, Phys. Rev. Lett. 103, 085701 (2009).
- (5) S. Trotzky, L. Pollet, F. Gerbier, U. Schnorrberger, I. Bloch, N. V. Prokof’ev, B. V. Svistunov, and M. Troyer, arXiv:0905.4882.
- (6) M. Greiner, O. Mandel, T. Esslinger, T. W. Hänsch, and I. Bloch, Nature 415, 39 (2002).
- (7) V. A. Kashurnikov, N. V. Prokof’ev, and B. V. Svistunov, Phys. Rev. A 66, 031601(R), (2002); N.V. Prokof’ev and B.V. Svistunov, Physics Today 55, 85 (2002).
- (8) S. Wessel, F. Alet, M. Troyer, and G. G. Batrouni, Phys. Rev. A 70, 053615 (2004).
- (9) L. Pollet, S. Rombouts, and K. Heyde, J. Dukelsky, Phys. Rev. A 69, 043601 (2004).
- (10) C. Schroll, F. Marquardt, and C. Bruder, Phys. Rev. A 70, 053609 (2004).
- (11) C. Kollath, U. Schollwöck, J. von Delft, and W. Zwerger, Phys. Rev. A 69, 031601(R) (2004).
- (12) N. Gemelke, X. Zhang, C.-L. Hung, C. Chin, Nature 460, 995 (2009).
- (13) W. S. Bakr, J. I. Gillen, A. Peng, S. Fölling, and M. Greiner, Nature 462, 74-77 (2009).
- (14) L. Pollet, N. V. Prokof’ev, and B. V. Svistunov, Comment on Ref. Zhou09 .
- (15) M. Campostrini and E. Vicari, Phys. Rev. Lett. 102, 240601 (2009); Phys. Rev. A, 81, 023606 (2010).
- (16) N. V. Prokof’ev, B. V. Svistunov, and I. S. Tupitsyn, JETP 87, 310 (1998).
- (17) L. Pollet, K. Van Houcke, and S. Rombouts, J. Comp. Phys. 225, 2249 (2007).
- (18) F. Gerbier et al., Phys. Rev. Lett. 101, 155303 (2008).
- (19) A. F. Albuquerque, F. Alet, P. Corboz, et al., Journal of Magnetism and Magnetic Materials 310, 1187 (2007).