Shapes of Gas, Gravitational Potential and Dark Matter in CDM Clusters
Abstract
We present analysis of the three-dimensional shape of intracluster gas in clusters formed in cosmological simulations of the CDM cosmology and compare it to the shape of dark matter (DM) distribution and the shape of the overall isopotential surfaces. We find that in simulations with radiative cooling, star formation and stellar feedback (CSF) intracluster gas outside the cluster core () is more spherical compared to non-radiative (NR) simulations, while in the core the gas in the CSF runs is more triaxial and has a distinctly oblate shape. The latter reflects the ongoing cooling of gas, which settles into a thick oblate ellipsoid as it loses thermal energy. The shape of the gas in the inner regions of clusters can therefore be a useful diagnostic of gas cooling. We find that gas traces the shape of the underlying potential rather well outside the core, as expected in hydrostatic equilibrium. At smaller radii, however, the gas and potential shapes differ significantly. In the CSF runs, the difference reflects the fact that gas is partly rotationally supported. Interestingly, we find that in non-radiative simulations the difference between gas and potential shape at small radii is due to random gas motions, which make the gas distribution more spherical than the equipotential surfaces. Finally, we use mock Chandra X-ray maps to show that the differences in shapes observed in three-dimensional distribution of gas are discernible in the ellipticity of X-ray isophotes. Contrasting the ellipticities measured in simulated clusters against observations can therefore constrain the amount of cooling in the intracluster medium and the presence of random gas motions in cluster cores.
Subject headings:
cosmology: theory, – galaxies: clusters: general – X-rays: galaxies: clusters – methods: numerical1. Introduction
In the prevailing, hierarchical cold dark matter (CDM) paradigm of cosmological structure formation, galaxy- and cluster-sized CDM halos are formed via accretion and merging with smaller halos. The CDM paradigm predicts that DM halos are generally triaxial and are elongated along the direction of their most recent major mergers. The triaxiality of DM halos has been demonstrated in a number of studies using numerical simulations (Frenk et al., 1988; Dubinski & Carlberg, 1991; Warren et al., 1992; Thomas et al., 1998; Jing & Suto, 2002; Suwa et al., 2003; Hopkins et al., 2005; Kasun & Evrard, 2005; Allgood et al., 2006; Bett et al., 2007; Gottlöber & Yepes, 2007; Paz et al., 2008) and arises due to anisotropic accretion and merging along filamentary structures. The degree of triaxiality strongly correlates with the halo formation time (e.g., Allgood et al., 2006; Ho et al., 2006; Wray et al., 2006), which implies that at a given epoch more massive halos are more triaxial. For the same reason, triaxiality is sensitive to the linear structure growth function and is higher in cosmological models in which halos form more recently (e.g., Macciò et al., 2008).
Although shapes of DM halos have been studied extensively in dissipationless -body cosmological simulations, DM shape is difficult to probe observationally, though some handle on shape is provided by lensing studies (e.g., Hoekstra et al., 2004; Parker et al., 2007; Rozo et al., 2007; Evans & Bridle, 2009; Hawken & Bridle, 2009). Moreover, it is well known that including baryons in simulations modifies the shapes of DM halos, especially in the case of significant gas dissipation during galaxy formation (Katz & Gunn, 1991; Evrard et al., 1994; Dubinski, 1994; Kazantzidis et al., 2004; Springel et al., 2004; Hayashi et al., 2007; Tissera et al., 2010, see Debattista et al. 2008 and Valluri et al. 2010 for discussion of the physical nature of this effect). It is therefore of paramount importance to examine predictions for halo shapes using cosmological simulations that include gas dynamics and dissipative processes accompanying galaxy formation. Further, the shape of the gas itself can be examined in such simulations and compared to the shape of the underlying potential, sourced predominantly by DM. Gas is expected to follow isopotential surfaces in hydrostatic equilibrium, so simulations may test whether cluster gas is in equilibrium on average and whether it can be used as a reliable tracer of the shape of the underlying potential (Buote & Tsai, 1995; Lee & Suto, 2003; Flores et al., 2007; Kawahara, 2010).
Probing the shape of the gravitational potential via gas, as was first suggested by Binney & Strimpel (1978) and observationally tested by Fabricant et al. (1984) and Buote & Canizares (1996), can open interesting avenues for using the shapes of DM halos around observed galaxy clusters to both test the CDM paradigm and constrain the amount of halo gas that dissipated and was converted into stars during halo formation. This is particularly relevant for galaxy clusters, where high-quality X-ray imaging data now exists for large samples of clusters. Kawahara (2010) recently analyzed axis ratios of X-ray clusters from the XMM-Newton catalogue and found relatively good agreement with the CDM predictions of Jing & Suto (2002) based on dissipationless simulations of a large cluster sample, confirming findings of Buote & Tsai (1995) and Flores et al. (2007) based on a single simulated system.111A similar test of the shape determined using the observed projected galaxy distribution of clusters have been presented by Plionis et al. (2006). Buote & Tsai (1995) were also the first to show that for the simulated cluster they studied the shape of the X-ray isophotes reflected the shape of the underlying three-dimensional gas distribution and potential.
Fang et al. (2009) compared the ellipticities of X-ray surface brightness isophotes of clusters simulated with and without radiative cooling and star formation. Focusing on a single cluster from the sample we analyze in this paper, they showed that the shape of gas can be quite flattened when gas cools significantly and settles into rotating thick disk. They also showed that this flattening is detectable in the shape of X-ray isophotes. Fang et al. (2009) also argued that the flattened shape of the gas distribution in the simulated cluster implies that gas does not trace potential in the inner regions due to rotational support. Their results therefore demonstrate that shapes of X-ray isophotes in cluster cores are a useful diagnostic of amount of cooling and gas motions in cluster cores. Fang et al. (2009) have also compared isophote shapes for synthetic Chandra observations of a sample of clusters simulated with cooling to observations and concluded that ellipticity profiles in runs with radiative cooling do not match observations. They attributed the discrepancy to ongoing, significant cooling in the cores of simulated clusters that is absent from the cores of real clusters (e.g., Peterson & Fabian, 2006).
In this paper we present analysis of the three-dimensional shapes of intracluster gas, DM, and underlying gravitational potential using high-resolution cosmological simulations of galaxy clusters formed in the CDM cosmology. Our work extends the work of Fang et al. (2009) by presenting more detailed analysis of three-dimensional shape profiles of gas, DM, and gravitational potential for the full sample of clusters. In addition, we focus on the effects of cumulative cooling and dissipation during the entire cluster evolution on the shape of potential and gas distribution at intermediate radii (), where dissipation makes potential more spherical (e.g., Kazantzidis et al., 2004). This effect was not investigated in Fang et al. (2009). We show explicitly that dissipation leads to more spherical shapes for ICM gas outside cluster cores ()222Here and throughout this paper denotes the cluster-centric radius enclosing a mean overdensity of , where is the critical density of the universe at the redshift of analysis., reflecting the corresponding effect on the DM distribution. We also find that the shape of gas matches the shape of the gravitational potential at these radii in general, but deviates from it at smaller radii and at where assumption of the hydrostatic equilibrium breaks down. At smaller radii () gas distributions in simulations with cooling become oblate, reflecting the partially rotation-supported thick disks into which gas settles as it loses its thermal energy by cooling, a result that is qualitatively consistent with Fang et al. (2009). We predict gas shapes as may be determined observationally by estimating ellipticities from mock X-ray maps of the same clusters and show that one can constrain cluster gas physics by comparing ellipticity profiles of simulations with and without dissipation to those of observations.
This paper is organized as follows. In Section 2 we describe our cluster simulations. In Section 3 we describe the method of estimating axis ratios and the results for the three dimensional shapes of clusters. We give our estimates for ellipticities of mock X-ray maps as an observable prediction in Section 4. We provide a summary and discussion of our results in Section 5.
2. The Simulations
| Cluster ID | Relaxed (1)/Unrelaxed(0) | ||
|---|---|---|---|
| (1014 ) | ( Mpc) | ||
| CL101 | 9.02 | 1.16 | 000 |
| CL102 | 5.45 | 0.98 | 000 |
| CL103 | 5.70 | 0.99 | 000 |
| CL104 | 5.40 | 0.98 | 111 |
| CL105 | 4.86 | 0.94 | 001 |
| CL106 | 3.47 | 0.84 | 000 |
| CL107 | 2.57 | 0.76 | 100 |
| CL3 | 2.09 | 0.71 | 111 |
| CL5 | 1.31 | 0.61 | 111 |
| CL6 | 1.68 | 0.66 | 000 |
| CL7 | 1.42 | 0.63 | 111 |
| CL9 | 0.83 | 0.52 | 000 |
| CL10 | 0.67 | 0.49 | 111 |
| CL11 | 0.90 | 0.54 | 000 |
| CL14 | 0.77 | 0.51 | 111 |
| CL24 | 0.35 | 0.39 | 010 |
We analyze high-resolution cosmological simulations of 16 cluster-sized systems in a flat CDM model: , , and , where the Hubble constant is defined as , and is the mass variance within spheres of radius Mpc and serves to normalize the power spectrum. The simulations were performed using the Adaptive Refinement Tree -bodygasdynamics code (Kravtsov, 1999; Kravtsov et al., 2002), an Eulerian code that uses adaptive refinement in space and time, and (non-adaptive) refinement in mass (Klypin et al., 2001) to reach the high dynamic ranges required to resolve the cores of halos formed in self-consistent cosmological simulations. The simulations presented here are discussed in detail in Nagai et al. (2007a) and Nagai et al. (2007b) and we refer the reader to these papers for more details. Here we summarize the relevant parameters of the simulations.
In order to assess the effects of gas cooling and star formation on the cluster shapes, we conducted each cluster simulation with two different prescriptions for gasdynamics. In one set of runs we treated only the standard gasdynamics for the baryonic component without either radiative cooling or star formation. We refer to these as non-radiative (NR) runs. In the second set of runs, we included gas cooling and star formation (CSF). In the CSF runs, several physical processes critical to various aspects of galaxy formation are included: star formation, metal enrichment and thermal feedback due to supernovae Type II and Type Ia, self-consistent advection of metals, metallicity-dependent radiative cooling and UV heating due to a cosmological ionizing background (see Nagai et al., 2007b, for details of the metallicity-dependent radiative cooling and star formation). These simulations therefore follow the formation of galaxy clusters starting from well-defined cosmological initial conditions and capture the dynamics and properties of the intracluster medium (ICM) in a realistic cosmological context. However, some potentially relevant physical processes, such as active galactic nuclei (AGNs) bubbles, magnetic fields, and cosmic rays, are not included. Consequently, the simulated cluster properties have limited application to real systems, most notably in the innermost cluster regions, where these processes are likely to be more important.
We ran our high-resolution simulations using a uniform 1283 grid and eight levels of mesh refinement in computational boxes of Mpc comoving on a side for CL101–107 and Mpc for CL3–24. These simulations achieve a dynamic range of and a formal peak resolution of kpc and kpc, corresponding to an actual resolution of kpc and kpc, for the 120 and Mpc boxes, respectively. Only regions of Mpc surrounding each cluster were adaptively refined. The remaining volume was followed on the uniform grid. The particle mass, , corresponds to an effective particles in the entire box, or a Nyquist wavelength of Mpc and Mpc comoving for CL101–107 and CL3–24, respectively. These correspond to Mpc and Mpc in physical units at the initial redshifts of the simulations. The DM particle mass in the region around each cluster was for CL101–107 and for CL3–24, while other regions were simulated with lower mass resolution. For this paper, we only report values at cluster-centric distances larger than where all clusters are well resolved.
In order to test our simulation results against observations, we created mock Chandra X-ray images along three orthogonal projections for each simulated cluster. To minimize statistical fluctuation due to the Poisson noise, each image has an exposure time of 100 ks, corresponding to deep X-ray observations. Instrumental responses of Chandra were included in the mock image data. An overview of the methods used to generate the mock images is given in Section 4. Detailed descriptions of these mock images can be found in Section 3.1 of Nagai et al. (2007b).
To investigate the dependence of gas and halo shapes on the dynamical states of the clusters in our simulation set, we divided our sample into relaxed and unrelaxed clusters based on visual examinations of their mock X-ray images. A typical relaxed cluster is an object in which all three of its orthogonal images have a regular morphology and prominent substructures are absent. Details of the classification can be found in Nagai et al. (2007a).
In Table 1 we report (the mass within ), , and our classification of each of the X-ray images along the three orthogonal projections as relaxed or unrelaxed for our sample of 16 clusters.
3. Three Dimensional Shapes
3.1. Methods
We estimate axis ratios following Dubinski & Carlberg (1991) and Kazantzidis et al. (2004). For DM particles, we compute the inertia tensor
| (1) |
where is the coordinate of particle , is the particle mass, and the sum is over all particles in a shell of width . The principal axis lengths are obtained by diagonalizing using an iterative scheme. We begin by computing the inertia tensor in spherical shells and computing the axis ratios and using the eigenvalues of the inertia tensor (we adopt by convention). In the subsequent iterations, we compute principal axes at a given radius by summing over particles within ellipsoidal shells of width , defined using orientations and values of the principal axes from the previous iteration. The generalized ellipsoidal distance of particle is
| (2) |
where the primed coordinates are particle positions rotated into the frame of the principal axes of the inertia tensor. The centers of all ellipsoids are fixed to be the center of the cluster, defined as the location of the most bound particle. This process is continued until convergence of and to better than .
Note that Dubinski & Carlberg (1991) weighted each term in their calculation of the inertia tensor by , to mitigate the influence of substructures, prevalent at the outskirts of halos, on axis ratios computed within a certain radius. As in Kazantzidis et al. (2004), we find that this weighting makes only a small difference for axis ratios computed within narrow radial bins so we do not employ this weighting in our analysis. In this paper we use the mean (Equation (2))of particles within each ellipsoidal shell (equivalent to the length of the major axis of the shell) as our measure of cluster-centric distance, unless stated otherwise.
We estimate the axis ratios for gas in a similar way with weights , where and are the gas density and volume of the -th grid cell. We estimate the axis ratios of the surfaces of constant gravitational potential by computing the inertia tensor of all cells with potential within some range , taking for all such cells.
Large subhalos can bias the axis ratios in a given radial bin to lower values, generating a local fluctuation in the axis ratio profile. To minimize fluctuations due to substructures we remove particles bound to subhalos of masses . The identification of subhalos and bound particles follows the procedure described in Kravtsov et al. (2004).
3.2. Results
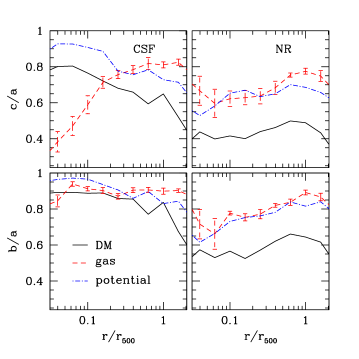
Figure 1 shows the axis ratio profiles for dark matter, gas, and gravitational potential averaged over the relaxed clusters at for the CSF and NR runs respectively. Results are similar for unrelaxed clusters but with considerable scatter. In both CSF and NR runs, gravitational potential is much more spherical than DM. The potential of a given thin triaxial mass shell with axis ratios and (the homeoid) is constant within the shell and has a triaxial shape outside of isopotential surfaces defined by the ellipsoid (e.g., Binney & Tremaine, 2008):
where is the label of the surface. The shape of the isopotential surfaces corresponding to a given ellipsoidal shell therefore becomes more spherical as the distance from the shell increases. Total potential at a given distance from the cluster is the superposition of the potentials generated by ellipsoidal shells within this distance and a constant potential generated by ellipsoidal shells outside. The shape of the isopotential surfaces therefore will always be more spherical than the shape of the underlying mass distribution that gives rise to the potential.
Figure 1 shows that at the shapes of DM, gravitational potential, and gas are more spherical in the relaxed CSF clusters than in the relaxed NR clusters, an effect identified previously in several studies (see Section 1). This effect appears to be due to the fact that potential becomes more spherical at large radii for a more concentrated mass distribution resulting from baryon dissipation and adiabatic response of the particle orbits to such change of potential (Debattista et al., 2008; Valluri et al., 2010).
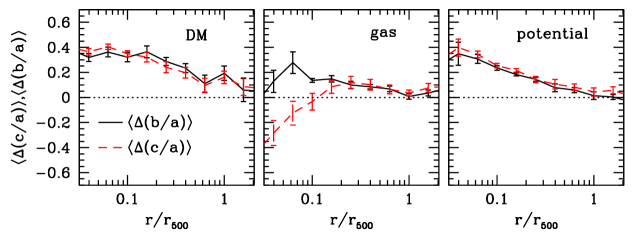
The effect is more apparent in Figure 2, which shows the differences in axis ratios between the relaxed CSF and NR clusters defined as
| (3) |
and similarly for . It is evident that baryonic dissipation causes relaxed DM halos to become significantly more spherical in their inner regions, an effect that remains significant out to and beyond. The average axis ratio shifts drop from at to at . Changes in and are very nearly the same at all radii.
For gas, the average change in both axis ratios is at , and is decreasing slowly to zero at . However, at smaller radii, , there is a positive change in the intermediate axis ratio and a negative change in the short-to-long axis ratio . At , and continues to decrease with radius, while increases to at and decreases inward. The significant decrease in indicates that the gas assumes an oblate shape in the inner regions of the relaxed CSF clusters compared to the prolate gas shapes in their NR counterparts. This is consistent with the expectation that ongoing cooling in the inner cluster region leads to formation of a thick oblate disk (Fang et al., 2009).
The difference between the shapes of the gravitational potential of relaxed CSF and NR clusters is qualitatively similar to that of the DM. The average change in axis ratios is at , and decreases to nearly zero at . There is little difference between and .
Finally, Figure 1 shows that gas traces the shape of gravitational potential for relaxed NR clusters in the radial range , indicating that gas is in approximate hydrostatic equilibrium within the potential. However, in the relaxed CSF clusters the gas and potential shapes only match at over a relatively narrow range of radii, , signaling departures from hydrostatic equilibrium. We discuss this further in Section 3.3.
| 0.1 | 0.5 | 1.0 | 2.0 | 0.1 | 0.5 | 1.0 | 2.0 | |||
|---|---|---|---|---|---|---|---|---|---|---|
| All | DM | CSF | ||||||||
| NR | ||||||||||
| potential | CSF | |||||||||
| NR | ||||||||||
| gas | CSF | |||||||||
| NR | ||||||||||
| Relaxed | DM | CSF | ||||||||
| NR | ||||||||||
| potential | CSF | |||||||||
| NR | ||||||||||
| gas | CSF | |||||||||
| NR | ||||||||||
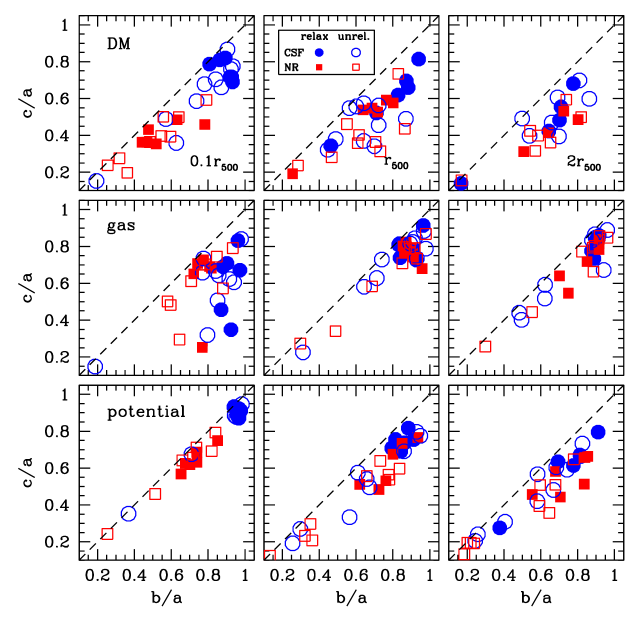
Figure 3 shows versus at for our relaxed and unrelaxed cluster samples. The average values are summarized in Table 2. As could be expected, the DM distribution in unrelaxed clusters is more triaxial on average compared to relaxed clusters. The DM halos in the NR clusters become more triaxial at smaller cluster-centric radii, consistent with previous findings in dissipationless simulations (e.g., Allgood et al., 2006). Conversely, the CSF clusters are rounder at small radii due to the effects of baryonic dissipation on halo shapes which are most prominent near halo centers (e.g. Kazantzidis et al., 2004).
Intracluster gas is very spherical at large radii in almost all relaxed NR and CSF clusters. Unrelaxed clusters tend to have more triaxial gas distribution compared to relaxed clusters. A similar trend can be seen for potential.
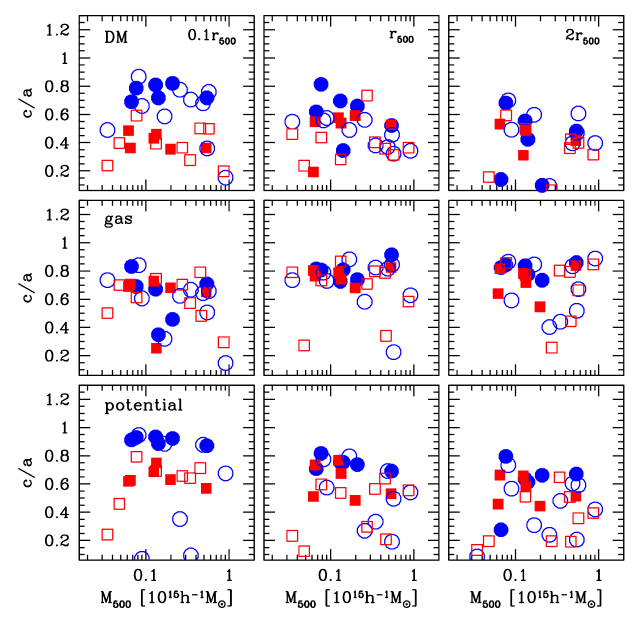
Figure 4 shows as a function of cluster mass . There is at most only a weak trend of decreasing with cluster mass for both the CSF and NR relaxed clusters seen in DM and potential. This is consistent with the results of studies based on large statistical samples of halos in dissipationless simulations (Kasun & Evrard, 2005; Allgood et al., 2006; Gottlöber & Yepes, 2007; Ragone-Figueroa & Plionis, 2007; Macciò et al., 2008) which find . Our sample of clusters is too small to detect such a trend.
3.3. Comparing the Shape of Intracluster Gas to the Shape of Gravitational Potential
In hydrostatic equilibrium, the isodensity surfaces of gas should trace the isopotential surfaces. Consequently, any differences between the measured shapes of gas and potential indicate deviations from hydrostatic equilibrium. Figure 1 shows that such differences are present at small radii in relaxed NR and in relaxed CSF clusters, and at larger radii and in the NR and CSF runs, respectively. All of these differences are due to the presence of gas bulk motions, although the nature and origin of these motions is different at small and large radii and in NR and CSF runs (see Lau et al., 2009).
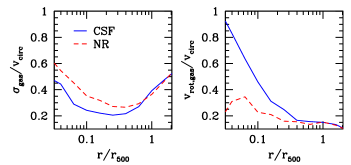
Figure 5 shows the ratio of the isotropic gas velocity dispersion and gas rotational velocity (calculated within each ellipsoidal gas shell) to the circular velocity (defined as , where is the mean ellipsoidal radius of the shell (Equation (2)). This ratio indicates the relative contribution of random gas motions in support against gravity. For gas in perfect hydrostatic equilibrium should be zero. However, we see that in both the NR and CSF clusters for , corresponding to a fraction of pressure support due to random gas motion of about 16%. These motions are dynamical in origin (due to accretion of gas and motions of cluster galaxies) and are not affected by cooling.
The gas motions do not affect the shape of the gas significantly at radii where , but have significant effect for larger values of , as is apparent from the differences between the shapes of gas and potential at small and large radii in the NR clusters. The net effect of these motions is relatively rounder gas distributions compared to the shapes of isopotential surfaces.
In addition to random motions, the gas in the CSF runs exhibits significant ordered rotational motions at . These motions arise due to the angular momentum of the ICM gas, which leads to rotation as gas cools and contracts. These motions are responsible for the deviations between the shapes of gas and potential at these radii. As we can see in Figure 1, the effect of the ordered motions is opposite to that of random motions, namely, rotational motions lead to gas distributions that are more flattened compared to isopotential surfaces.
The effect of cooling, and the ordered rotational motions that result from cooling, manifests as a rapid decrease of at small radii, even as remains approximately constant. The effect of random gas motions results in a rapid increase of both the and ratios. Measurements of the ellipticity profiles in clusters can therefore constrain the cooling of gas and magnitude of residual gas motions in their cores. Although X-ray spectroscopy is a much more sensitive tool to constrain the contemporary cooling, rotational motions and their effect on gas ellipticity also constrain the net cooling that has been occurred in the past. They can therefore provide potentially useful and complementary constraints on the thermal history of gas in cluster cores over the past several billion years. However, in order to make sure that such constraints are feasible we must check that the trends observed in the three-dimensional gas distribution are evident in the X-ray photon maps of these clusters. We present such an analysis in the next section.
4. Ellipticity of X-ray images of simulated clusters
4.1. Methods
Although one can expect that at radii where gas traces gravitational potential the X-ray isophotes can be used to quantify its shape, it is not immediately clear whether this can be done with the accuracy sufficient to detect the effects of cooling discussed in the previous section. In order to compare our results on intracluster gas shapes in Section 3 to observations, we estimate the ellipticities of mock X-ray photon maps generated from the same simulated clusters. Below we give a brief overview of the mock X-ray maps. We refer the reader to Section 3.1 of Nagai et al. (2007b) for a detailed description.
First we create X-ray flux maps of the simulated clusters viewed along three orthogonal projections. The flux map is computed by projecting the X-ray emission of hydrodynamic cells enclosed within of a cluster along the line of sight. The X-ray emissivity in each computational grid cell is computed as a function of proton and electron densities, gas temperature and metal abundance. Emission from gas with temperature less than K is excluded as it is below the Chandra bandpass. We then convolve the emission spectrum with the response of the Chandra front-illuminated CCDs and draw a number of photons at each position and spectral channel from the corresponding Poisson distribution. Each map has an exposure time of 100 ks (typical for deep observations) and includes a background with the intensity corresponding to the quiescent background level in the ACIS-I observations (Markevitch et al., 2003). The resolution of all the maps is 6 kpc pixel-1. We use at least 25 pixels per bin for ellipticity measurements.
From these data, we generate images in the 0.7–2 keV band and use them to identify and mask out all detectable small-scale clumps, as is routinely done in observational studies. Our clump detection is fully automatic and based on the wavelet decomposition algorithm (Vikhlinin et al., 1998). The holes left by masking out substructures in the photon map are filled in by the values from the decomposed map of the largest scale in wavelet analysis. We have tested that this method preserves the global shape of the photon distribution well. The background is removed when estimating ellipticities as it can bias them low at radii where background dominates the intrinsic emission. Throughout this paper we assume the cluster redshift is for the sample.
We define the ellipticity as
| (4) |
where and are the semi-major and the semi-minor axes of the projected ellipse respectively. The ellipticities of the X-ray photon distributions are determined using the same algorithm, based on the inertia tensor, as was used for the three-dimensional shapes in Section 3. Instead of using particle mass, we calculate the inertia tensor using weights given by the photon counts in each map pixel. We have estimated the ellipticity within both differential radial bins, and cumulative ellipticity within a given radius. In addition we have estimated ellipticity within radial shells defined by isophotes with different flux levels (isophotal bins). We find from visual comparison of the X-ray contours and the fitted ellipses that radial bins give reliable ellipsoidal fits to the X-ray isophotes (see Fig. 6 for an example).
4.2. Test Case: CL7
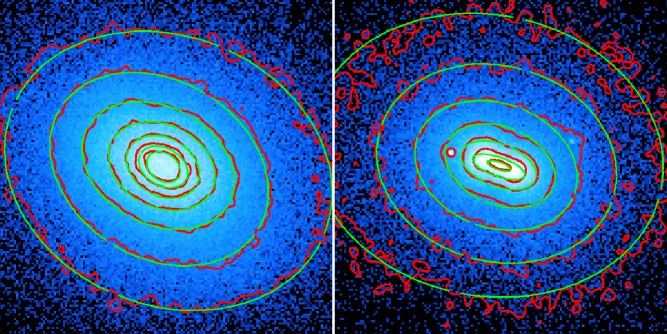
We test our method for estimating ellipticity using CL7, one of the most relaxed clusters in our sample. Figure 6 shows the mock X-ray maps for the -projection of the NR and CSF runs (labeled as CL7:NR and CL7:CSF respectively). Also shown are the isophotal contour lines (red) and the fitted ellipses of the photon distribution (green) derived using the method described in Section 4.1.
These images show that the ellipticities in the outer regions are similar for the NR and CSF runs, while they are very different in the core (). The ellipticity increases towards small radii for the CSF run, while the opposite trend is seen for the NR run, where the isophotes are becoming slightly more spherical in the inner regions. These images also demonstrate that the best-fit ellipse (indicated with green contour) describes the actual photon distribution (indicated with red contours) well at all radii, including the flattened gas disk in the inner most regions of the CSF run.
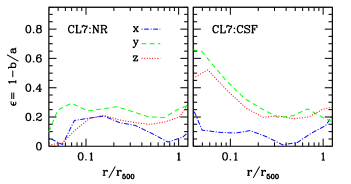
Figure 7 shows the ellipticity profiles of the CL7:NR and CL7:CSF runs viewed along three orthogonal projections. Note that we have scaled the radius to (where and are the semi-major and semi-minor axes of the fitted ellipse), to be consistent with Fang et al. (2009). In the NR run, the ellipticity profiles for all three projections are quite similar over the range , with nearly constant ellipticities of (though it decreases to at in the -projection). For the CSF run, two projections have very similar ellipticity profiles (the - and -projections), with at and increasing towards smaller radii, reaching at . The -projection, on the other hand, exhibits low ellipticity comparable to the NR run, , and shows no strong trend with radius. These results are consistent with the picture that the inner regions of the CSF run consist of a disk-like structure in the core, which appears highly elliptical when viewed edge-on (the - and -projections), while the flattened disk appears more spherical when viewed face-on (in the -projection).
Recently, the same set of simulated clusters are analyzed (Fang et al., 2009, hereafter F09). In particular, the ellipticity profiles of CL7 was presented in detail (cf. Figure 7 in F09). Although our results are in qualitative agreement with those of F09 as to the formation of flattened gas structure in the cluster core, we find substantial quantitative differences regarding the impact of the baryonic dissipation. For example, we find that the ellipticity profiles for the CL7:CSF run are generally lower than the corresponding F09 profiles. In the -projection at , we find as opposed to the F09 value of . Our ellipticities are even significantly (by -) smaller in the cluster core. In addition, Figure 7 shows that significant flattening of the isophotes due to cooling is confined to , not out to as stated by F09.
We have also checked ellipticities from cumulative bins rather than annular bins and found that the ellipticity increases only slightly to at . By inspection, the F09 surface brightness map for the -projection of CL7:CSF, shown in their Figure 1, appears to be inconsistent with at , but is consistent with the isophotes and our fits shown in Figures 6 and 7. To pin down the discrepancy, we focus on the -projection of CL7:CSF and use our ellipticity code on both our FITS file and the FITS file given by the authors of F09. For consistency, we use cumulative bins in both cases. We find that the ellipticity profiles derived from the two different FITS files have very similar shape. The only difference is that the ellipticity profile from their FITS file appears to be shifted to larger radii by a factor of 1.75. Upon inspection of the two FITS file, we find that the length scale of their FITS file is 1.75 larger compared to our own FITS file. The origin of this 1.75 factor is unexplained in F09. We further find that the ellipticity profile estimated using our code on their FITS file is nearly identical to the profile for the -projection shown in Figure 7 of F09. Thus we conclude that our discrepancy with F09 is most likely due to this 1.75 factor in their FITS files.
Therefore, although we see effects qualitatively similar to those pointed out by F09, the actual magnitude of the effect of dissipation of ellipticity of the ICM gas is much smaller than measured by F09 and is confined to the inner of the clusters.
| 0.05 | 0.3 | 1.0 | 2.0 | ||
|---|---|---|---|---|---|
| All | CSF | ||||
| NR | |||||
| Relaxed | CSF | ||||
| NR | |||||
| Unrelaxed | CSF | ||||
| NR |
4.3. Results
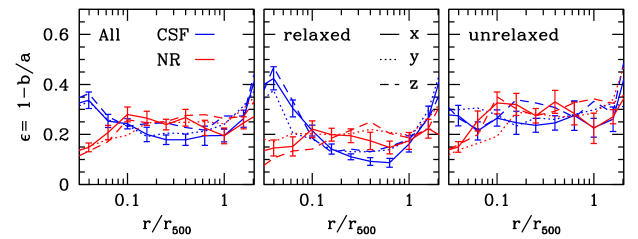
Figure 8 shows the ellipticity profiles derived from mock X-ray maps averaged over the three orthogonal projections separately for all clusters as well as subsets of the images of relaxed clusters and the images of unrelaxed clusters (see Table 1). The radial coordinate here is actually the semi-major axis of the fitted ellipse in units of . We note explicitly that the three-dimensional results in Section 3 were quoted as axis ratios, while the results of this section are given in ellipticities ().
The Figure shows that X-ray isophotes are more flattened in cluster cores in the CSF runs compared to the NR clusters. There is a clear rapid upturn in at reflecting rotational motions of gas in these runs. Note that we do not confirm results of F09 who claimed significant flattening of isophotes due to rotation out to based on the analysis of the same simulations we use in this study.
There is a downturn in for the NR clusters at similar radii () reflecting the effects of random gas motions. These trends are consistent with the results for the three-dimensional distributions presented in Section 3 and are just as pronounced. The difference between CSF and NR runs is particularly large for relaxed clusters, which have had more time since their most recent major mergers during which gas cooling could proceed.
Outside the cluster cores, , the ellipticities are approximately constant in both the CSF and NR runs. The average ellipticities in this range differ for the two sets of relaxed clusters. Relaxed clusters in the CSF simulations yield an average ellipticity of while the relaxed NR clusters have -. The more spherical DM distribution and shape of the isopotential contours in the CSF clusters compared to the NR clusters are clearly discernible in X-ray maps of the relaxed systems. Note that these differences are highly significant both in individual bins for relaxed clusters, and because they persist over a wide range of radii. The average ellipticities of unrelaxed clusters in the CSF and NR clusters are and respectively. The mean cluster ellipticities and their errors on the mean are summarized in Table 3. Note that the scatter is substantial and constraining the net effect of cooling and the prevalence of random motions will require averaging over a sample of relaxed clusters.
5. Summary and Discussion
We have investigated the axis ratios of DM mass, hot gas, and gravitational potential using 16 clusters simulated from the same initial conditions, but with different baryonic physics (with and without radiative cooling and star formation). Our results can be summarized as follows.
-
•
We show that gas distribution in simulated clusters has a rather spherical shape at large cluster-centric radii with the average axis ratios of at . This implies that the standard assumption of spherical symmetry in analyses of ICM using X-ray and Sunyaev-Zeldovich observations should be quite accurate.
-
•
We show that baryonic dissipation makes gas distribution more spherical at , where the axis ratios are larger by on average in the cooling (CSF) runs compared to the non-radiative (NR) runs. At small radii , the short-to-long axis ratios are lower in the CSF runs compared to the NR runs by as much as , but the intermediate axis ratios are reduced to a much smaller degree. The CSF gas distributions are oblate in their centers reflecting the presence of cool gas supported by rotation.
-
•
We present predictions for X-ray ellipticity profiles of intracluster gas based on mock Chandra X-ray maps of our simulated clusters. We show that the effect of cooling on the ellipticity of gas is consistent with the three-dimensional results. Specifically, the ellipticities at larger radii () decrease for the CSF clusters compared to NR clusters reflecting the rounder gravitational potential of the CSF clusters. At , ellipticities in the CSF clusters increase with decreasing radius.
-
•
NR clusters exhibit the opposite trends. NR clusters are more triaxial than the CSF clusters at , but become considerably rounder at . The latter trend is due to random gas motions, which are present at all radii but become considerable compared to the thermal energy of the gas (as reflected by increasing ratio).
-
•
Our results indicate that observed ellipticity profiles of X-ray clusters can be used to constrain both the amount of cooling in the last several billion years of cluster evolution and presence of significant random gas motions.
There are several issues to bear in mind when interpreting our results. First is the issue of overcooling in galaxy formation simulations. Our CSF simulations suffer from overcooling in the cluster cores (), such that the effect of halo contraction in response to the formation of the central galaxy is likely overestimated. The dissipational effect on gas shapes that we present can therefore be considered as an upper limit. At the same time, some amount of cooling must have occurred because galaxies do exist in clusters and the observed ICM gas fractions are significantly below the expected values (e.g., Kravtsov et al., 2009). We therefore expect the ellipticity of the intracluster gas in real clusters to be between our results for CSF and NR runs.
Although our cluster sample is not drawn to sample the mass function of clusters, the mass-dependence of ellipticities is very weak (Figure 4), at least in the range of masses we probe () and our results should therefore not be biased significantly.
A more significant concern is the possible bias due to the fact that our cluster sample was simulated assuming , while the most recent estimates indicate (Vikhlinin et al., 2009; Jarosik et al., 2011). The effect of a lower is that halos would form later, leading to higher ellipticities (Allgood et al., 2006). However, Macciò et al. (2008) show that effect of changing from to changes average ratios of halos by only , considerably smaller than the differences discussed in this paper. Moreover, both the CSF and NR clusters would be affected by the difference in cosmology and it is plausible that they would be affected to a similar degree.
Another potential concern is that AGN heating is not included in our simulations though evidence of such heating is abundant in real clusters, especially in relaxed cool-core clusters (e.g., McNamara & Nulsen, 2007). Jets and bubbles inflated by the AGNs can potentially change the shape of the gas significantly in the cluster core. We expect that the AGN would also change the gas shape in the cluster outskirts by suppressing the overall amount of cooling throughout the cluster formation.
Despite these caveats, a few general implications can be drawn from our results. First, as dissipation makes the gas more spherical, systematics of observable quantities integrated along the line of sight such as , or any deprojected quantity that relies on the assumption of spherical symmetry, should be reduced compared to conclusions one could draw from dissipationless simulations. Another implication is that the shape of gas can be different from the shape of the potential in the cluster core , and in the cluster outskirts . The difference in shape between gas and potential can be attributed to deviation from hydrostatic equilibrium as shown in Section 3.3. In the intermediate radial range , however, we have shown that the gas shape generally coincides with that of the potential, and therefore the shape of the potential can be inferred from the shape of gas. If there is an independent way of determining the shape of gravitational potential, e.g. by gravitational lensing, one may be able to constrain the amount of gas motions by comparing the shape of the gravitational potential and the shape of gas.
However, even without independent information about the potential, our results indicate that ellipticities derived from X-ray images alone can constrain the amount of cooling and the presence of random gas motions. This is because these effects result in a rapid change of ellipticity with decreasing radius at but of an opposite sign. We will present comparisons of gas ellipticities in simulations and observations from Chandra and ROSAT in a separate companion paper (E. T. Lau et al. 2011, in preparation).
References
- Allgood et al. (2006) Allgood, B., Flores, R. A., Primack, J. R., Kravtsov, A. V., Wechsler, R. H., Faltenbacher, A., & Bullock, J. S. 2006, MNRAS, 367, 1781
- Bett et al. (2007) Bett, P., Eke, V., Frenk, C. S., Jenkins, A., Helly, J., & Navarro, J. 2007, MNRAS, 376, 215
- Binney & Strimpel (1978) Binney, J., & Strimpel, O. 1978, MNRAS, 185, 473
- Binney & Tremaine (2008) Binney, J., & Tremaine, S. 2008, Galactic Dynamics: Second Edition (Princeton University Press)
- Buote & Canizares (1996) Buote, D. A., & Canizares, C. R. 1996, ApJ, 457, 565
- Buote & Tsai (1995) Buote, D. A., & Tsai, J. C. 1995, ApJ, 439, 29
- Debattista et al. (2008) Debattista, V. P., Moore, B., Quinn, T., Kazantzidis, S., Maas, R., Mayer, L., Read, J., & Stadel, J. 2008, ApJ, 681, 1076
- Dubinski (1994) Dubinski, J. 1994, ApJ, 431, 617
- Dubinski & Carlberg (1991) Dubinski, J., & Carlberg, R. G. 1991, ApJ, 378, 496
- Evans & Bridle (2009) Evans, A. K. D., & Bridle, S. 2009, ApJ, 695, 1446
- Evrard et al. (1994) Evrard, A. E., Summers, F. J., & Davis, M. 1994, ApJ, 422, 11
- Fabricant et al. (1984) Fabricant, D., Rybicki, G., & Gorenstein, P. 1984, ApJ, 286, 186
- Fang et al. (2009) Fang, T., Humphrey, P., & Buote, D. 2009, ApJ, 691, 1648
- Flores et al. (2007) Flores, R. A., Allgood, B., Kravtsov, A. V., Primack, J. R., Buote, D. A., & Bullock, J. S. 2007, MNRAS, 377, 883
- Frenk et al. (1988) Frenk, C. S., White, S. D. M., Davis, M., & Efstathiou, G. 1988, ApJ, 327, 507
- Gottlöber & Yepes (2007) Gottlöber, S., & Yepes, G. 2007, ApJ, 664, 117
- Hawken & Bridle (2009) Hawken, A. J., & Bridle, S. L. 2009, MNRAS, 400, 1132
- Hayashi et al. (2007) Hayashi, E., Navarro, J. F., & Springel, V. 2007, MNRAS, 377, 50
- Ho et al. (2006) Ho, S., Bahcall, N., & Bode, P. 2006, ApJ, 647, 8
- Hoekstra et al. (2004) Hoekstra, H., Yee, H. K. C., & Gladders, M. D. 2004, ApJ, 606, 67
- Hopkins et al. (2005) Hopkins, P. F., Bahcall, N. A., & Bode, P. 2005, ApJ, 618, 1
- Jarosik et al. (2011) Jarosik, N., et al. 2011, ApJS, 192, 14
- Jing & Suto (2002) Jing, Y. P., & Suto, Y. 2002, ApJ, 574, 538
- Kasun & Evrard (2005) Kasun, S. F., & Evrard, A. E. 2005, ApJ, 629, 781
- Katz & Gunn (1991) Katz, N., & Gunn, J. E. 1991, ApJ, 377, 365
- Kawahara (2010) Kawahara, H. 2010, ApJ, 719, 1926
- Kazantzidis et al. (2004) Kazantzidis, S., Kravtsov, A. V., Zentner, A. R., Allgood, B., Nagai, D., & Moore, B. 2004, ApJ, 611, L73
- Klypin et al. (2001) Klypin, A., Kravtsov, A. V., Bullock, J. S., & Primack, J. R. 2001, ApJ, 554, 903
- Kravtsov et al. (2009) Kravtsov, A., et al. 2009, in Astronomy, Vol. 2010, The Astronomy and Astrophysics Decadal Survey white paper, 164–+
- Kravtsov (1999) Kravtsov, A. V. 1999, PhD thesis, New Mexico State University
- Kravtsov et al. (2004) Kravtsov, A. V., Gnedin, O. Y., & Klypin, A. A. 2004, ApJ, 609, 482
- Kravtsov et al. (2002) Kravtsov, A. V., Klypin, A., & Hoffman, Y. 2002, ApJ, 571, 563
- Lau et al. (2009) Lau, E. T., Kravtsov, A. V., & Nagai, D. 2009, ApJ, 705, 1129
- Lee & Suto (2003) Lee, J., & Suto, Y. 2003, ApJ, 585, 151
- Macciò et al. (2008) Macciò, A. V., Dutton, A. A., & van den Bosch, F. C. 2008, MNRAS, 391, 1940
- Markevitch et al. (2003) Markevitch, M., et al. 2003, ApJ, 583, 70
- McNamara & Nulsen (2007) McNamara, B. R., & Nulsen, P. E. J. 2007, ARA&A, 45, 117
- Nagai et al. (2007a) Nagai, D., Kravtsov, A. V., & Vikhlinin, A. 2007a, ApJ, 668, 1
- Nagai et al. (2007b) Nagai, D., Vikhlinin, A., & Kravtsov, A. V. 2007b, ApJ, 655, 98
- Parker et al. (2007) Parker, L. C., Hoekstra, H., Hudson, M. J., van Waerbeke, L., & Mellier, Y. 2007, ApJ, 669, 21
- Paz et al. (2008) Paz, D. J., Stasyszyn, F., & Padilla, N. D. 2008, MNRAS, 389, 1127
- Peterson & Fabian (2006) Peterson, J. R., & Fabian, A. C. 2006, Phys. Rep., 427, 1
- Plionis et al. (2006) Plionis, M., Basilakos, S., & Ragone-Figueroa, C. 2006, ApJ, 650, 770
- Ragone-Figueroa & Plionis (2007) Ragone-Figueroa, C., & Plionis, M. 2007, MNRAS, 377, 1785
- Rozo et al. (2007) Rozo, E., Chen, J., & Zentner, A. R. 2007, arXiv:0710.1683
- Springel et al. (2004) Springel, V., White, S. D. M., & Hernquist, L. 2004, in IAU Symposium, Vol. 220, Dark Matter in Galaxies, ed. S. Ryder, D. Pisano, M. Walker, & K. Freeman, 421–+
- Suwa et al. (2003) Suwa, T., Habe, A., Yoshikawa, K., & Okamoto, T. 2003, ApJ, 588, 7
- Thomas et al. (1998) Thomas, P. A., et al. 1998, MNRAS, 296, 1061
- Tissera et al. (2010) Tissera, P. B., White, S. D. M., Pedrosa, S., & Scannapieco, C. 2010, MNRAS, 406, 922
- Valluri et al. (2010) Valluri, M., Debattista, V. P., Quinn, T., & Moore, B. 2010, MNRAS, 403, 525
- Vikhlinin et al. (1998) Vikhlinin, A., McNamara, B. R., Forman, W., Jones, C., Quintana, H., & Hornstrup, A. 1998, ApJ, 502, 558
- Vikhlinin et al. (2009) Vikhlinin, A., et al. 2009, ApJ, 692, 1060
- Warren et al. (1992) Warren, M. S., Quinn, P. J., Salmon, J. K., & Zurek, W. H. 1992, ApJ, 399, 405
- Wray et al. (2006) Wray, J. J., Bahcall, N. A., Bode, P., Boettiger, C., & Hopkins, P. F. 2006, ApJ, 652, 907