Mass renormalization in the band width-controlled Mott-Hubbard systems SrVO3 and CaVO3 studied by angle-resolved photoemission spectroscopy
Abstract
Ca1-xSrxVO3 is a Mott-Hubbard-type correlated electron system whose bandwidth can be varied by the V-O-V bond angle, but the actual effect of bandwidth control on the electronic structure has been controversial in previous photoemission experiments. In this work, band dispersions and Fermi surfaces of SrVO3 and CaVO3 are studied by angle-resolved photoemission spectroscopy. Near the Fermi level (), three bands forming cylindrical Fermi surfaces derived from the three V 3 orbitals have been observed. The observed band widths for both compounds are almost half of those predicted by local-density-approximation band-structure calculation, confirming mass renormalization caused by electron correlation. It has been clearly demonstrated that the width of the band in CaVO3 is narrower than that in SrVO3, qualitatively consistent with the result of band-structure calculation. Roles of the orthorhombic lattice distortion and electron correlation in the observed band narrowing are discussed.
pacs:
71.18.+y, 71.20.-b, 71.27.+a, 71.30.+h, 79.60.-iThe complex nature of correlated electrons in transition-metal oxides (TMO’s) causes various interesting phenomena including high- superconductivity and colossal magnetoresistance RMPfujimori . Light transition-metal oxides such as perovskite-type Ti and V oxides are ideal systems to study the fundamental physics of electron correlation because they are prototypical Mott-Hubbard-type systems, in which the O 2 band is located below the transition-metal 3 band, in the framework of the Zaanen-Sawatzky-Allen classification scheme.ZSA Those systems have a relatively small number of electrons in the degenerate bands, and their electronic properties have been modeled by the Hubbard model without explicit consideration of the oxygen orbitals. In the Mott-Hubbard regime, the MIT occurs when the ratio of the on-site Coulomb repulsion () to the one-electron band width () exceeds a critical value . In those light TMO’s, the electronic properties are those of normal Fermi liquids on the metallic side, while they are Mott insulators (with orbital ordering) on the insulating side of the MIT. Electron correlation effects and metal-insulator transitions (MITs) in light TMO’s have been described based on theoretical predictions of dynamical mean-field theory (DMFT) for the Hubbard model Kotliar .
To address the nature of electron correlation in light TMO’s experimentally, photoemission spectroscopy has provided rich information. In the photoemission spectra of the perovskite-type Ti and V oxides,inouePES ; Morikawa ; Fujimori ; YoshidaLSTO the coherent part around the Fermi level () corresponding to band-like electronic excitations and incoherent part 1-2 eV away from corresponding to atomic-like excitations or the remnant of the lower Hubbard band (LHB) have been observed. DMFT has predicted that the effective mass of conduction electron is enhanced concomitant with decreasing spectral weight in the coherent part Kotliar and that spectral weight transfer occurs from the coherent part to incoherent part as the system approaches an MIT from the metallic side. For example, in the filling-control Mott-Hubbard system La1-xSrxTiO3 (LSTO), a critical mass enhancement occurs toward the MIT according to the electronic specific heats and the magnetic susceptibility .Kumagai The doping dependence of photoemission spectral weight and of the bandwidth of the coherent part indeed reflects the behaviors of and as predicted by DMFT.YoshidaLSTO On the other hand, the effective mass enhancement and spectral weight transfer in the bandwidth-control Mott-Hubbard system Ca1-xSrxVO3 (CSVO) have been controversial. In CSVO, the V-O-V angle varies with and the band width decreases with decreasing . Early photoemission results have shown that, with decreasing , i.e., with decreasing bandwidth, spectral weight is transferred from the coherent part to the incoherent part inouePES in a dramatic way compared to the moderate enhancement of .inouePRB In contrast, according to a bulk-sensitive photoemission study using soft x-rays, neither appreciable spectral weight transfer nor appreciable band narrowing has been observed for SrVO3 and CaVO3.Sekiyama On the other hand, another bulk-sensitive photoemission study using a laser has revealed the suppression of spectral weight near in going from SrVO3 to CaVO3.Eguchi Thus, the difference in the electronic structure between SrVO3 and CaVO3 still remains unclear. To reconcile the discrepancies between the different experiments caused by overlapping surface and bulk signals, angle-resolved photoemission spectroscopy (ARPES) turned out to be a powerful method, as demonstrated by the successful ARPES observation of band dispersions and Fermi surfaces in SrVO3.YoshidaSVO In that study, mass renormalization which is consistent with and reflects the bulk electronic properties could be identified. The result has been confirmed by a subsequent ARPES study using epitaxially grown thin films of SrVO3 with high surface quality.Takizawa However, how the electronic structure changes with bandwidth control in CSVO has not been studied using ARPES. In order to address this issue, in the present work, we have performed an ARPES study of SrVO3 and CaVO3. In going from SrVO3 to CaVO3, one would expect that the observed band dispersions reflect band narrowing effects both due to orthorhombic lattice distortion and electron correlation. In this work, we have clearly observed the narrower band width in CaVO3 than that in SrVO3, which is quantitatively consistent with the specific heat coefficient . By comparing the ARPES results with the results of band-structure calculations PavariniNJP ; Nekrasov , the effects of the orthorhombic lattice distortion and electron correlation on the observed mass renormalization are discussed.
ARPES measurements were performed at beamline 28A of Photon Factory with a Scienta SES-2002 electron analyzer. The typical energy and angular resolutions were about 30 meV and 0.3 degree, respectively. Single crystals of SrVO3 and CaVO3 were grown by the travelling-solvent floating zone method. Samples were first aligned ex situ using Laue diffraction, cleaved in situ along the cubic (100) surface at 20 K and measured at the same temperature in a pressure better than Torr. We used circularly polarized photons with energies from =47 to 100 eV. In this paper, the electron momentum is expressed in units of , where Å (3.76Å) for SrVO3 (CaVO3) is the cubic lattice constant corresponding to the V-V distance. and are the momenta parallel to the cleavage plane and is the momentum perpendicular to the plane.
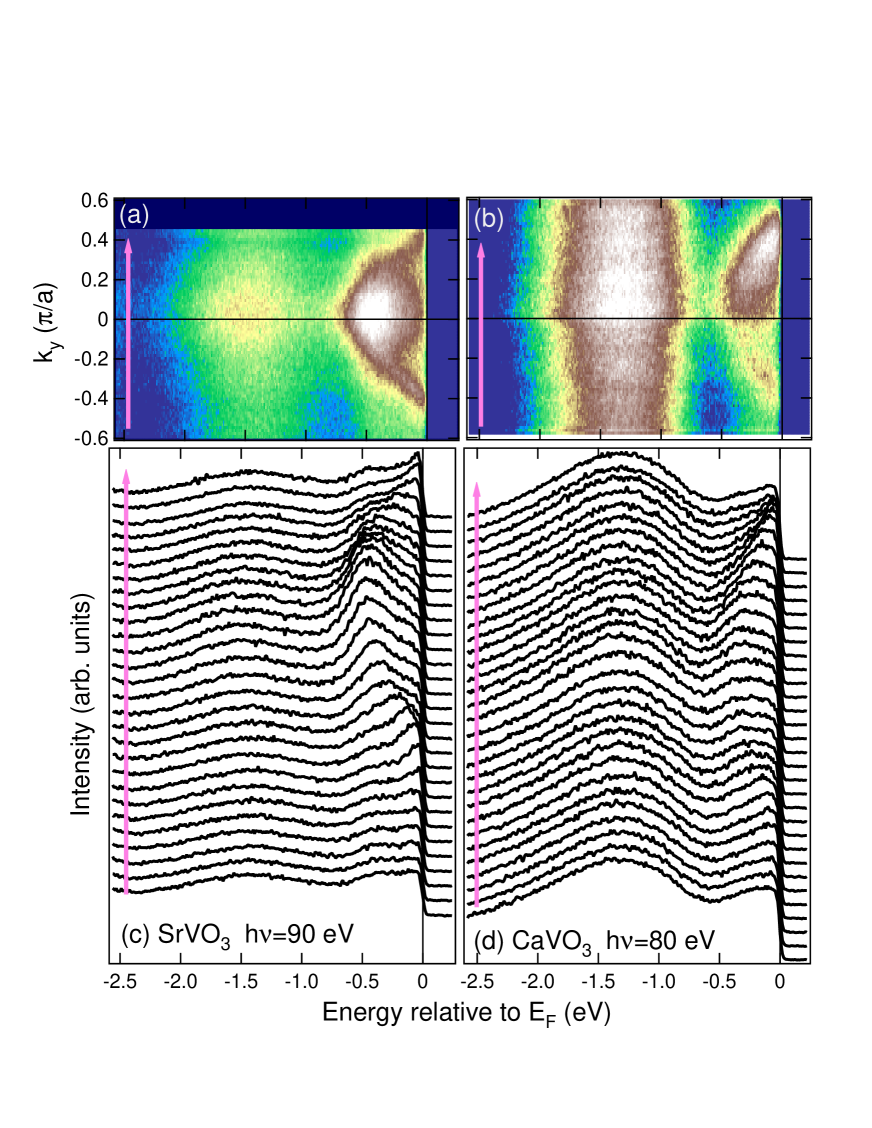
First, we show energy distribution curves (EDCs) of SrVO3 and CaVO3 for =0 with various ’s in Fig. 1. The coherent part within 0.7 eV of the Fermi level () shows a clear dispersive feature corresponding to the calculated band structure. The incoherent part, which reflects electron correlation, centered at -1.5 eV and -1.3 eV for SrVO3 and CaVO3, respectively, shows appreciable momentum dependent intensities as seen in Figs. 1(a) and 1(b). The intensity is stronger within the Fermi surface (), consistent with the previous ARPES study on thin films and the results of DMFT calculation.Takizawa
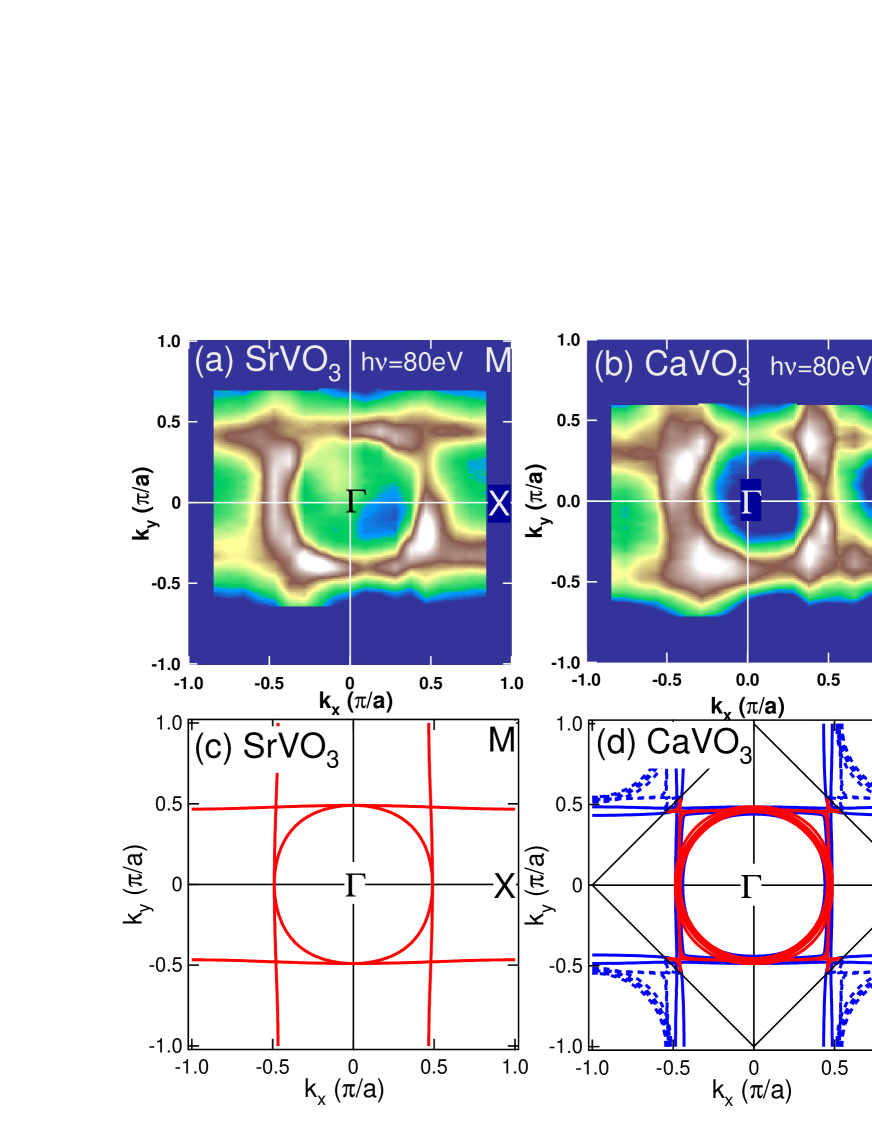
Spectral weight at in the first Brillouin zone (BZ) is mapped in - space for SrVO3 and CaVO3 in Figs. 2 (a) and (b), respectively, for photon energy =80 eV. Fermi surfaces for SrVO3 and CaVO3 predicted by band-structure calculation PavariniNJP are shown in Figs. 2 (c) and (d), respectively. For SrVO3, the overall feature of the mapped Fermi surface is in good agreement with the band-structure calculation. The observed spectral weight distribution indicates the cylindrical Fermi surfaces consisting of the three orbitals, the , and orbitals, of vanadium. Particularly, we have observed a cross-section or a projection of the cylindrical Fermi surface derived from the orbital and that from the orbital. These Fermi surfaces are extended along the and directions and were not clearly observed in the previous study.YoshidaSVO The result of the spectral weight mapping for CaVO3 is similar to that of SrVO3, but the momentum distribution is generally broader than SrVO3 because the crystal structure of CaVO3 is orthorhombic and band folding occurs due to the quadrupling of the unit cell as shown in Fig.2 (d). Since the cleaved surface may contain , , and planes, the observed ARPES spectra would be a superposition of the dispersions from the , , and surfaces. Such folded bands of different orientations are not resolved in the present spectra, and would give rise to the broad spectral weight distribution compared to that in SrVO3.
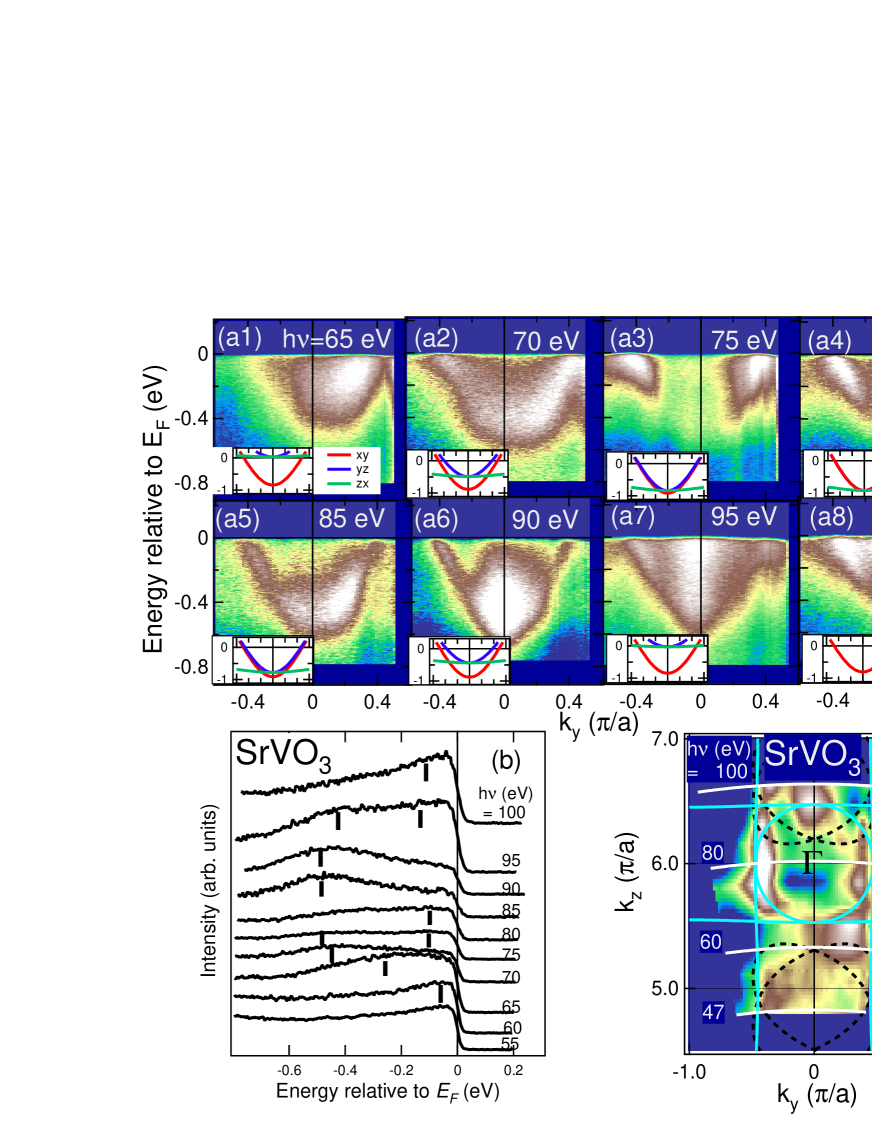
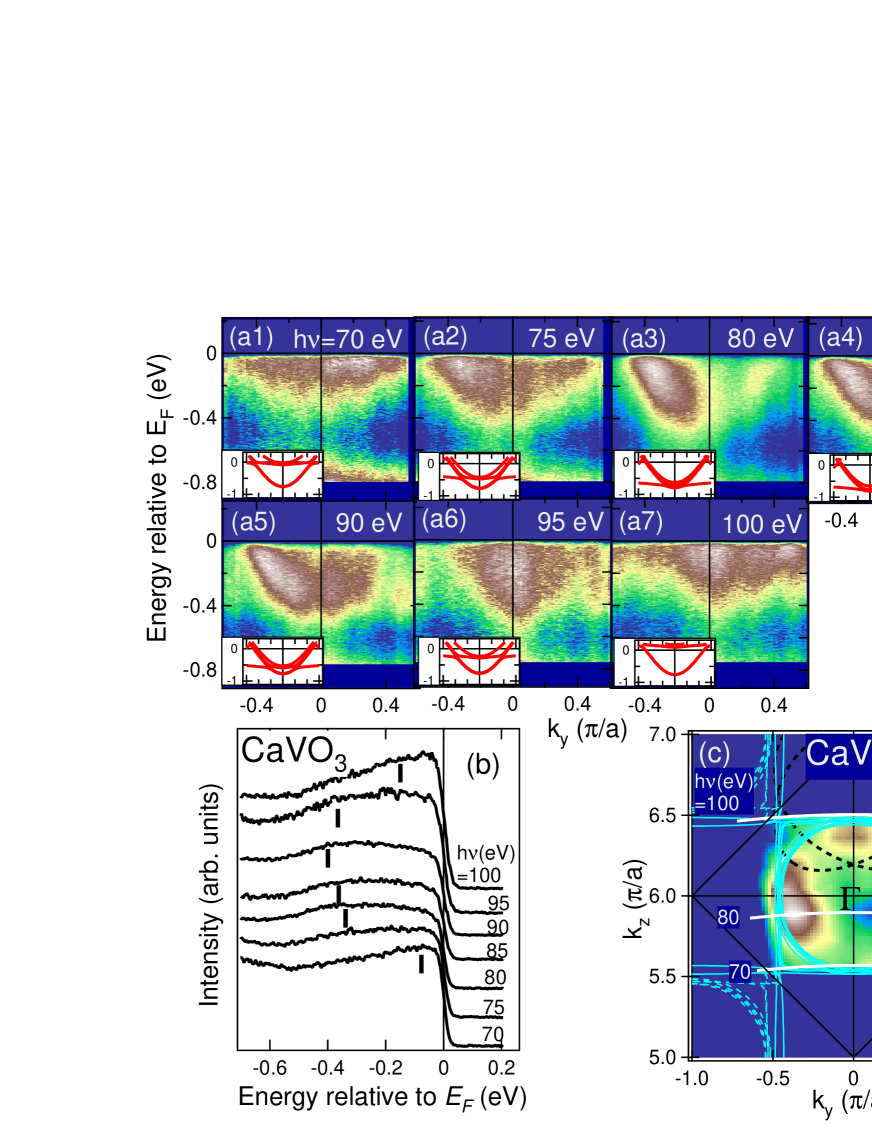
Figures 3(a) and 4(a) show the photon energy dependence of the ARPES spectra of SrVO3 and CaVO3, respectively, for =0 cuts along the direction. The asymmetry of the ARPES intensity with respect to =0 is due to matrix-element effects of the circular polarized light. The observed parabolic band is the band, which has nearly two-dimensional electronic structure in the - plane parallel to the sample surface. Spectral features of CaVO3 are broader than those of SrVO3, which may be due to the orthorhombic crystal distortion of CaVO3. For SrVO3, we have observed enhanced spectral weight at -0.4 eV for 90 eV and this enhanced part moves toward the Fermi level with increasing photon energy. This enhancement is due to the overlap of the bottom band because the matrix element of the orbital is suppressed around ==0. Therefore, the shift of the intensity with photon energy indicates the energy dispersion of the bands along the direction. This behavior is also predicted by the band calculation PavariniNJP as shown in the insets. In the case of CaVO3, the intensity of the bands are not so strong as in SrVO3. Nevertheless, the flat dispersions near corresponding to the bands are observed around = 70 eV and 100 eV, indicating the Fermi surface crossing of these bands along the direction. Figures 3 (b) and 4 (b) are normal emission spectra for various photon energies. We have also mapped ARPES intensities at in the - plane in order to reveal the cross-section of the FS, as shown in Figs. 3 (c) and 4 (c). Here, the values have been obtained from ’s assuming the inner potential of =17 eV. These mapping patterns for both samples qualitatively agree with the Fermi surfaces obtained from the band-structure calculation as demonstrated in Figs. 3 (c) and 4(c). Note that, in the previous ARPES study, signals from the bands were unclear, probably due to surface effects,YoshidaSVO while we have clearly observed these bands in the present results. We should also remark that there are structures with weak intensity which are not predicted by the band calculation as shown in Fig. 3(c). This may represent photoelectrons from secondary cones.Mahan Assuming that the emitted electrons receive the in-plane reciprocal vector =(,), we have simulated the Fermi surface from secondary cones and explained the observed intensity distribution, as indicated by dashed curves in Figs. 3(c) and 4(c).
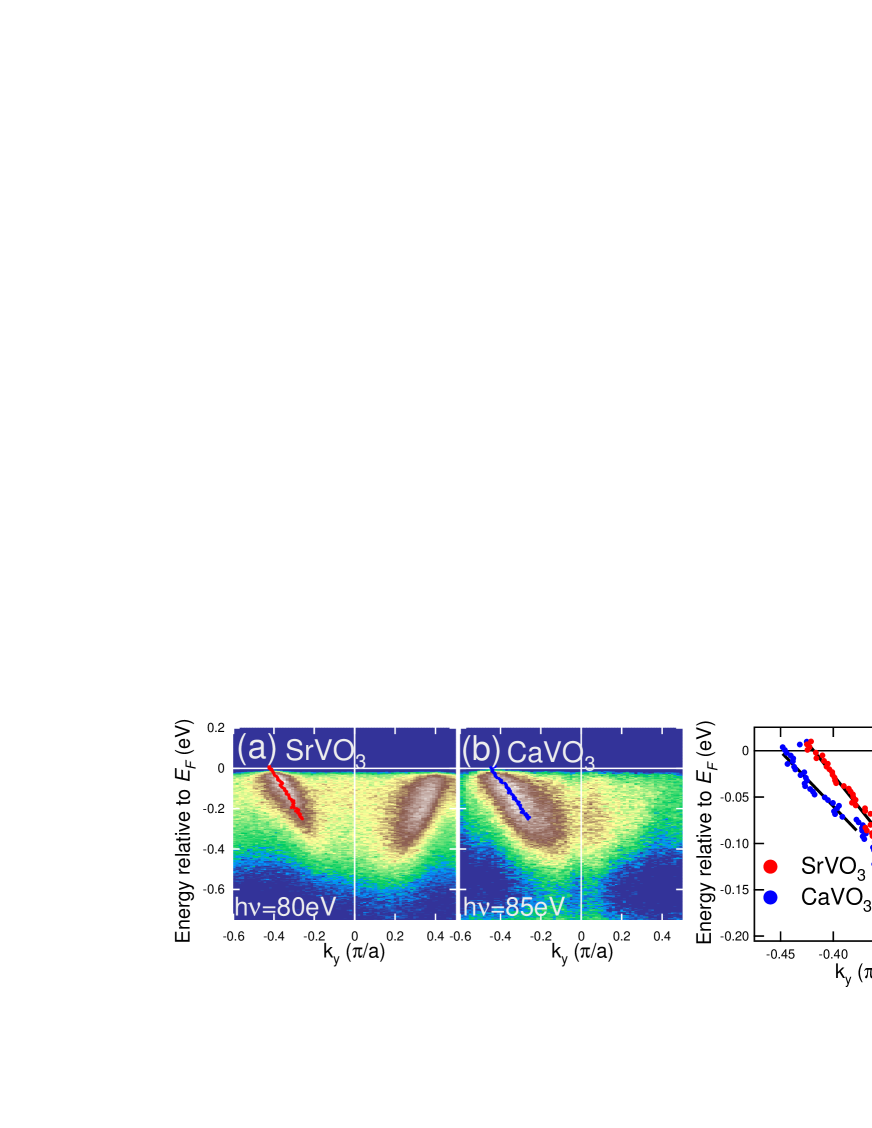
In order to investigate electron correlation effects for both samples, we have determined the QP dispersion near point ( 80 eV for SrVO3 and 85 eV for CaVO3). Figures 5(a) and 5(b) show the same ARPES spectra as Fig. 3 (a4) and Fig. 4 (a4), respectively, with QP dispersions determined by the peak positions of momentum distribution curves (MDCs). The QP dispersions for both compounds are compared in Fig. 5(c). From the slope of the dispersions within 0.1 eV from the , we have deduced the Fermi velocity 1.7 and 1.4 eVÅ for SrVO3 and CaVO3, respectively. This corresponds to the observation that the binding energy of the bottom of the band for CaVO3 is 0.4 eV [Fig. 4(b)], while it is 0.5 eV for SrVO3 [Fig. 3(b)]. Assuming the two-dimensional cylindrical Fermi surfaces for the three orbitals, the electronic specific heat coefficient has been estimated from the observed to be 7.5 and 9.0 mJ mol-1 K-2 for SrVO3 and CaVO3, respectively, which are close to the experimental values of 8.18 (SrVO3) and 9.25 (CaVO3) mJ mol-1K-2.inouePRB Therefore, the observed mass renormalization in the QP dispersions are quantitatively consistent with the electronic specific heat coefficient within the Fermi liquid picture. From these results, it is experimentally confirmed that CaVO3 has a narrower QP bandwidth than SrVO3, while this has been unclear in the previous photoemission studies inouePES ; Sekiyama ; Eguchi . Now, let us discuss possible mechanisms of the band narrowing in these materials. The observed band widths for both SrVO3 to CaVO3 are nearly half of those predicted by the band-structure calculation. This can be attributed to electron correlation as LDA+DMFT calculations explain the mass renormalization by a factor of 2 if a moderate Coulomb interaction is assumed.Pavarini
In going from SrVO3 to CaVO3, the additional band narrowing has been observed as described above. The observed Fermi velocity indicates an increase in the effective mass up to 18 % . This band narrowing may be interpreted in terms of either the orthorhombic lattice distortion or electron correlation or both of them. In the simple tight-binding description of the band structure of the perovskite-type oxides, the effective hopping parameter between neighboring orbitals is proportional to , where is the V-O-V bond angle. In SrVO3 and CaVO3, is 1 ( 180 ∘) and 0.88 ( 160 ∘), respectively, yielding a band narrowing by 12%. The LDA calculation by Pavarini et alPavariniNJP has predicted the narrowing by . However, another LDA calculation by Nekrasov et alNekrasov indicates band narrowing only by 4%, and this small narrowing is explained by the increasing hopping parameter between nearest-neighbor orbitals in CaVO3. If we employ the LDA calculation by Nekrasov et al.Nekrasov , i.e. assuming that the LDA band mass increases by 4%, the present results indicate that increases by 10% in going from SrVO3 to CaVO3, consistent with the scenario that increases and hence enhances through electron correlation in going from SrVO3 to CaVO3. If we employ the LDA calculation by Pavarini et al, on the other hand, the present results indicate that the electron mass enhancement factors for both compounds are nearly the same between SrVO3 and CaVO3 and therefore that there are no appreciable difference in electron correlation strengths in both compounds. If this interpretation is correct, should not increase appreciably in going from SrVO3 to CaVO3. One possible scenario for the nearly constant is that the on-site Coulomb interaction is reduced by hybridization between the V 3 orbitals and the orbitals of the A-site cation in going from SrVO3 to CaVO3. If the orthorhombic distortion in CaVO3 enhances the hybridization between these orbitals, the net density of 3 electrons at the V site may decrease, resulting in the reduction of . In fact, the binding energy of the incoherent peak, which is approximately according to the DMFT results, decreases from 1.5 eV in SrVO3 to 1.3 eV in CaVO3 as shown in Fig. 1.
In conclusion, we have studied the energy dispersions and the Fermi surfaces of the three-dimensional Mott-Hubbard systems SrVO3 and CaVO3 by ARPES. The observed band widths for both samples are almost half of those predicted by the band-structure calculation, consistent with the DMFT calculation Pavarini where the mass renormalization is caused by electron correlation. We have confirmed that the width of the V 3 band indeed decreases by in going from SrVO3 to CaVO3. The observed mass renormalization in the band near can explain the moderate mass enhancement in from SrVO3 to CaVO3. This band narrowing can be explained by the orthorhombic distortion and possibly by additional increase of correlation strength caused by the increase in .
We are grateful to M. Rozenberg for enlightening discussions and N. Kamakura for technical support. This work was supported by a Grant-in-Aid for Scientific Research (No. 19204037) from the Japan Society for the Promotion of Science (JSPS). This work was done under the approval of the Photon Factory Program Advisory Committee (Proposal No. 2006S2-001).
References
- (1) M. Imada, A. Fujimori, and Y. Tokura, Rev. Mod. Phys. 70, 1039 (1998).
- (2) J. Zaanen, G. A. Sawatzky, and J. W. Allen, Phys. Rev. Lett. 55, 418 (1985).
- (3) A. Georges, G. Kotliar, W. Krauth, and M. J. Rozenberg, Rev. Mod. Phys. 68, 13 (1996).
- (4) I. H. Inoue et al., Phys. Rev. Lett. 74, 2539 (1995).
- (5) K. Morikawa et al., Phys. Rev. B 52, 13711 (1995).
- (6) A. Fujimori et al., Phys. Rev. Lett. 69, 1796 (1992).
- (7) T. Yoshida et al., Europhys. Lett. 59, 258 (2002).
- (8) K. Kumagai et al., Phys. Rev. B 48, 7636 (1993).
- (9) I. H. Inoue et al., Phys. Rev. B 58, 4372 (1998).
- (10) A. Sekiyama et al., Phys. Rev. Lett. 93, 156402 (2004).
- (11) R. Eguchi et al., Phys. Rev. Lett. 96, 076402 (2005).
- (12) T. Yoshida et al., Phys. Rev. Lett. 95, 146404 (2005).
- (13) M. Takizawa et al., Phys. Rev. B 80, 235104 (2009).
- (14) I. A. Nekrasov et al., Phys. Rev. B 72, 155106 (2005).
- (15) E. Pavarini, A. Yamasaki, J. Nuss, and O. K. Andersen, New J. Phys. 7, 188 (2005).
- (16) G. Mahan, Phys. Rev. B 2, 4334 (1970).
- (17) E. Pavarini et al., Phys. Rev. Lett. 92, 176403 (2004).