The evolutionary status of the blue hook stars in Centauri
Abstract
Core helium burning is the dominant source of energy of extreme horizontal branch stars, as the hydrogen envelope is too small to contribute to the nuclear energy output. The evolution of each mass in the HR diagram occurs along vertical tracks that, when the core helium is consumed, evolve to higher Teff and then to the white dwarf stage. The larger is the mass, the smaller is the Teff of the models, so that the zero age horizontal branch (ZAHB) is “horizontal”. In this paper we show that, if the helium mass fraction (Y) of the envelope is larger than Y0.5, the shape of the tracks changes completely: the hydrogen burning becomes efficient again also for very small envelope masses, thanks to the higher molecular weight and to the higher temperatures of the hydrogen shell. The larger is Y, the smaller is the envelope mass that provides strong H–shell burning. These tracks have a curled shape, are located at a Teff following the approximate relation Teff=8090+ 32900Y, and become more luminous for larger envelope masses. Consequently, the ZAHB of the very high helium models is “vertical” in the HR diagram. Synthetic models based on these tracks nicely reproduce the location and shape of the “blue hook” in the globular cluster Cen, best fit by a very high Teff (bluer) sequence with Y=0.80 and a cooler (redder) one with Y=0.65. Although these precise values of Y may depend on the color–Teff conversions, we know that the helium content of the progenitors of the blue hook stars can not be larger than Y0.38–0.40, if they are descendants of the cluster blue main sequence. Consequently, this interpretation implies that all these objects must in fact be progeny of the blue main sequence, but they have all suffered further deep mixing, that has largely and uniformly increased their surface helium abundance, during the red giant branch evolution. A late helium flash can not be the cause of this deep mixing, as the models we propose have hydrogen rich envelopes much more massive than those required for a late flash. We discuss different models of deep mixing proposed in the literature, and conclude that our interpretation of the blue hook can not be ruled out, but requires a much deeper investigation before it can be accepted.
keywords:
globular clusters; chemical abundances; self-enrichment1 Introduction
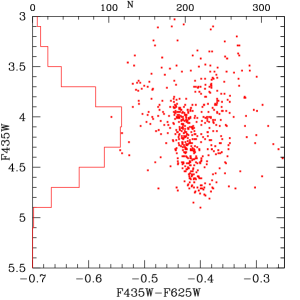
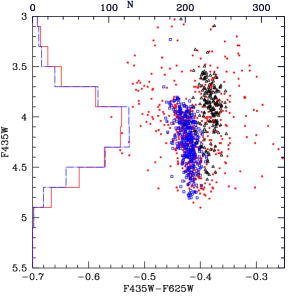
The vast problematics involving the globular cluster Cen goes from the presence of multiple evolutionary sequences all along the main sequence (Bedin et al., 2004), the subgiant and the giant branches (Lee et al., 1999; Pancino et al., 2000; Rey et al., 2004; Sollima et al., 2005), to the presence of a wide spread in metal content (e.g., Norris & Da Costa 1995; Suntzeff & Kraft 1996; Smith et al. 2000; Johnson et al. 2009) and a likely spread in helium content (Norris, 2004; Piotto et al., 2005). Even if present in other clusters, these features are not all found together as in this most massive GC in the Galaxy. Another striking feature in the colour-magnitude (CM) diagram of Cen is the large number of very faint and very blue stars at the end of the horizontal branch (HB), beyond the temperature and magnitude limits attainable by currently known HB structures. Such objects are commonly called ”blue hook” stars and are found in other clusters —M54 (Rosenberg et al., 2004), NGC 2808 (Brown et al., 2001), NGC 2419 (Ripepi et al., 2007), perhaps NGC 6388 (Busso et al., 2007)— but in Cen their distribution in the CM diagram is different from what observed elsewhere (Figure 3, left panel). Most of the blue hook objects are arranged along two “parallel sequences” inclined towards high temperatures (Anderson & van der Marel, 2009). Spectroscopic analysis of the blue hook stars has been done by Moehler et al. (2004) for NGC 2808 resulting in Teff35–36K for the hottest objects, with a couple of stars probably already evolving towards the white dwarf stage. In Cen, they are in the range 32–36K, according to Moehler et al. (2007), but many hotter stars are also present. More recently, Villanova et al. (2010) have re–examined several blue hook stars in Cen and find a clustering in a range of TeffK. Being the spectroscopic tools hampered by uncertainties much larger than the HST photometry, we can infer from the vertical shape of the extreme blue hook that all its stars cluster at very similar Teff. We do know that these extreme HB stars should be mainly burning helium in their cores, and evolve along a “vertical” track that can simulate the shape of the blue hook, but without covering its whole luminosity extension. In fact, in order to explain the blue hook with tracks of this kind, Cassisi et al. (2009) adopt a superposition of stars having a normal helium content (that start their evolution at a larger luminosity) plus stars with enhanced helium (starting their evolution at lower luminosity), born from the high helium blue MS stars, plus stars that suffered a late helium core flash, and are then also carbon enhanced (Moehler et al., 2007). A reason to justify the hypothesis that the blue hook is the superposition of the progeny of very different evolutionary parents comes from the analysis of helium abundance, since blue hook stars show a great variety of results: they are both helium–normal and helium rich objects, the latter ones close to the range Y=0.38–0.40 believed to apply to the blue MS (see, e.g. figure 2 in Moehler et al., 2007). The hottest (Teff40000K) stars are generally extremely helium rich, or even very helium poor. In our opinion, however, it is not necessary to connect these different helium abundances to different evolutionary paths. The atmospheric analysis is very difficult, and the resulting surface helium abundance may be affected by errors difficult to be fully quantified. In addition, it is well possible that the main reasons why the surface abundances of these stars are largely different from each other, are surface phenomena acting on timescales much shorter than the evolutionary time in HB, like helium sedimentation in the thin atmospheric layer, or residual mass loss. The presence of a well defined locus in the HR diagram, together with what looks like a broader (cooler) sequence at redder colors (see Figure 2, left panel) appears more like some kind of evolutionary boundary that limits the stars’ evolution, than as the casual result of many different evolutionary paths. The HST data set shown in Figure 2 is the same used and fully described in Cassisi et al. (2009), namely a mosaic of 33 fields obtained with the ACS/WFC (GO–9442, PI A. Cool) through the F435W and F625W filters. More than 350 stars populate the thin vertical part of the blue hook, and 170 are spread on the right of this sequence.
In Section 2 we present new models of helium core burning stars of metallicity adequate to describe Cen’s stars, characterized by extremely high values of helium abundance (from Y=0.45 to Y=0.8) around the burning helium core. While, in Section 3, we will give reasonable but unproven justifications for adopting these extravagant compositions, these models are the first that can reproduce the vertical shape of the blue hook stars in Cen, as the ZAHB of these models is “vertical”, and not “horizontal” as it happens for less helium rich compositions. Simulations of the blue hook star population allow us to speculate on the evolutionary path leading to this kind of stellar structures.
2 The evolution of extremely helium rich HB stars
The models presented in this work have been computed with the ATON code, by using the recently updated input physics described in Ventura et al. (2009). We adopt a mixture (Grevesse & Sauval 1998) having [Fe/H]=–1.6, –enhanced, with /Fe, for the latest opacities by Ferguson et al. (2005) at temperatures lower than 10000 K, and the OPAL opacities in the version documented by Iglesias & Rogers (1996). Electron conduction opacities were taken from the WEB site of Potekhin (see the web page http://www.ioffe.rssi.ru/astro/conduct/ dated 2006) and correspond to the Potekhin et al. (1999) treatment. The electron opacities are harmonically added to the radiative opacities. In Ventura et al. (2009) we employed three different mixtures for the C, N and O abundances, in order to test the difference between “standard” C+N+O and C+N+O enriched models. In this paper we use models having the standard CNO mixtures and the CNOx5 mixture (see later). We compute HB models for different helium content Y. Models from Y=0.24 to Y=0.40 will be presented in another paper (Ventura et al., 2010), here we show the results for models with 0.45Y0.80. Generally, the HB models are computed starting from the zero age HB (ZAHB) by fixing the helium core mass. In an evolutionary context, this core mass must be equal to the mass at the core helium flash of the stars evolving on the red giant branch at the plausible age of the cluster. In our standard models, we adopt the core mass resulting at ages in the range 10-12Gyr, for Y values from Y=0.24 to Y=0.40. For the computations presented here, we make the hypothesis that values of Y0.40 are due to deep mixing, and are not the starting main sequence value. Consequently, we adopt the core helium flash mass appropriate for the chosen chemistry and for Y=0.40, that is M=0.455 for the CNOx5 composition (but see later for the size of the helium core). We then are making the implicit hypothesis that our HB models progenitors are stars belonging to the blue MS of Cen as will be justified in Sect. 3.

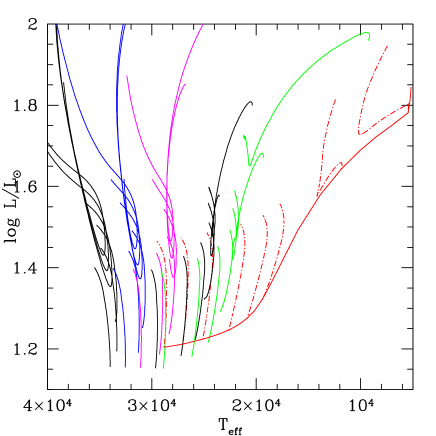
In Figure 1 we show the evolution in the theoretical HR diagram
for stars with Y=0.45, 0.50, 0.60, 0.70 and 0.80. Smaller values of Y do not show a “blue hook type”
behaviour, and we plot models for Y=0.32, CNOx1 (here the evolutionary core mass is 0.469),
together with its ZAHB, to show its “horizontal” behaviour.
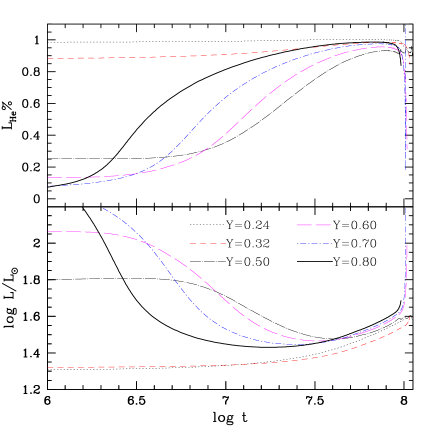
Let us describe the Y=0.8 tracks. The smallest total masses show the
typical vertical track dominated by helium core burning: in fact, the hydrogen shell is not active,
due to the very small hydrogen buffer on the core.
As soon as the H–shell is ignited, its strength (due to the high molecular weigth) is such that
the ZAHB position jumps to very large luminosity. In 10Myr, the structure burns a large fraction of its hydrogen
envelope, with a strong decrease in luminosity. At this stage, He–burning provides more than 90%
of the energy output, and the tracks revert their path increasing their luminosity and giving rise
to the curling feature in Fig. 1. A similar behaviour is found as long as Y0.5.
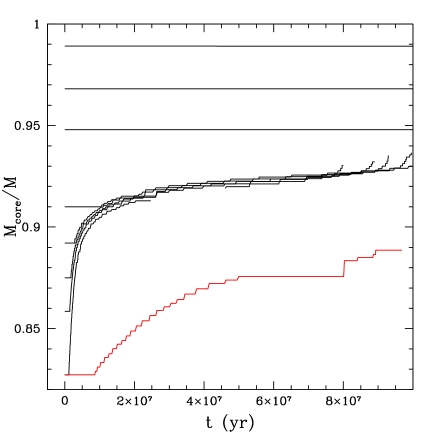
For all these Y’s, the masses high enough to develop a H–shell are pushed into the same interval in Teff, with the luminosity slightly increasing with the total mass. The reason for this occurrence is shown in Fig. 2, where we plot the ratio of core mass to total mass (q) as a function of time. As long as the H–shell is not active, q does not increase, and the Teff location decreases with decreasing q, as expected. The appearance of an efficient H–shell gives origin to a rapid increase in q, such that the values converge to an almost identical q vs. time relation for all masses. Consequently, since Teff depends on q, the tracks cluster at similar Teff, with luminosity increasing with mass. Figure 1 shows that the location of this curling–type evolution depends on Y: the larger is Y, the larger is the Teff. Approximately, we can use the linear relation to describe the Teff location of these tracks as a function of the helium content for Y0.80. This peculiar behaviour does not occurr at Y0.45, and this may be the reason why it has never been appreciated before.
Our choice of chemistry does not affect sensibly the Teff location of the tracks: models with the same metallicity and normal CNO (the CNOx1 set) lie at about equal Teff, for the same choice of Y. The luminosity location of the tracks however depends on the chosen core mass. We use the core mass corresponding to CNOx5 because, being smaller than for CNOx1, the fit with the observed luminosity of blue hook stars is easier, all other features being the same if we had chosen the core mass for CNOx1. We come back to this point when describing the simulations.
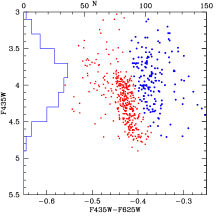
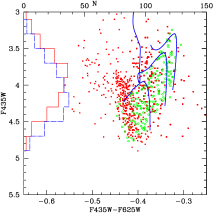
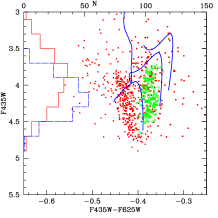
If we transform the tracks into the HST filters of Figure 3, we recognize that the Y=0.80 sequence formed by HB structures with masses from 0.46 to 0.52 overlaps nicely with the more populated and hotter vertical sequence in the blue hook in Cen, even reproducing its slightly skew appearance. This is an important feature of present result, that to our knowledge had not been obtained by other evolutionary interpretations. The rest of the blue hook stars, slightly cooler, are located in between the Y=0.8 and Y=0.6 sequences. An attempt to simulate the blue hook is shown in Figure 3. We extract a number of stars with Y=0.80, plus a smaller sample with Y=0.65 (interpolated between the Y=0.6 and Y=0.7 sets of tracks). We choose an average mass of 0.50, with a gaussian dispersion =0.023. When the random mass extraction provides a value below 0.457, we impose that this mass is not able to ignite helium and becomes a helium white dwarf. In this way, the random extractions produce a population of 95 helium WDs. The total number of extractions is such that we obtain in total the observed number of 350 stars for the bluest part of the hook (Y=0.80 in the simulation) and 170 stars for the redder side (Y=0.65 in the simulation). A similar result is obtained if we make the hypothesis that the helium content in the redder stars varies randomly between 0.6 and 0.7 (or even between 0.6 and 0.8). The results would not be equivalent if we could deal with a sample in which the observational errors are smaller. In Figure 3 the central panel shows the simulation imposing an error of 0.01mag in the color, while the error is only 0.005mag in the right panel. If two separate sequences exist, they will be distinguished with smaller errors. The best representation of the data is obtained by assuming a distance modulus =14.45mag, while, e.g. Cassisi et al. (2009) adopt 14.75mag. This modulus is the best one for matching our models to the observed blue hook, but possible variations in the physical parameters of the models can end up with a different fit111 By this choice of distance modulus, and keeping a mass loss during the giant evolution independent of the helium content, the bulk of luminous blue HB stars can be simulated with Y=0.29, while the red (sparse) HB stars are compatible with Y=0.25. The HB would then find an interpretation similar to that given for NGC 2808 (D’Antona et al., 2005), but notice that metallicity differences should also be included in a consistent simulation. The choice of Cassisi et al. (2009) modulus makes the luminous part of the HB very overluminous for our models.. As we have already pointed out, the distance modulus depends on the adopted helium core mass Mcore=0.455. Larger Mcore’s provide more luminous models, and the fit requires a larger distance modulus, and viceversa for a smaller Mcore. Also notice that we can expect smaller core masses when the evolving giant loses an amount of mass such as to reduce the envelope to M (D’Cruz et al., 1996). In this case, an early or late helium flash can follow (but this is not relevant in our modelling of the hook). Further, if the blue hook is interpreted with stars having Y0.60, and helium enrichment takes place during the upper RGB evolution, then the core mass should be the one corresponding to the actual value of the envelope Y at the moment of the flash. This would imply a substantially smaller core.
A very critical parameter of the fit is the envelope helium abundance: we find that the models having Y=0.80 are appropriate, but the color-Teff transformations adopted have been computed for a normal helium abundance, so that the required Y may be different (although in any case very large) if more appropriate transformations give a different value for the color location of the vertical extreme HBs.
There are several appealing features in this simulation: 1) the vertical shape of the left blue hook is reproduced extremely well, by using a unique set of evolutionary tracks and not a superposition of different evolutions, whose contemporary occurrence must be finely tuned. 2) the right side of the blue hook is also interpreted by the same kind of “vertical” evolution, possibly with some spread in the helium abundance characteristic of the envelope of these stars, in contrast to the unique value required to reproduce the left side. 3) the luminosity function can also be reproduced, by adjusting the average value of the mass in the hook and the gaussian dispersion around this value.
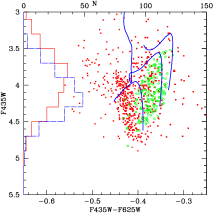
We can try to simulate the blue hook by adopting tracks without the curling, by choosing, e.g., Y=0.45 tracks. For the set adopted here, the core mass is Mcore=0.468 and Z=0.001 (solar scaled CNO). The simulations are shown in Figure 3. If we adopt an average mass of 0.475 of and a mass dispersion of 0.01 or even as low as 0.004, the shape of the simulation is clearly very different from the observed blue hook. If we reduce the mass dispersion to 0.002, the shape resembles the cooler component of the blue hook. For smaller core mass, we can model smaller total masses, that have bluer colors, but the shape of the simulation would be very similar and would not be consistent with the observed bluer hook. We conclude that the very high helium, curling tracks are particularly apt in reproducing the blue hook.
If we accept this interpretation, however, we have a very strong constraint of the evolution leading to the blue hook phase.
3 The progenitors of the blue hook stars: non canonical extra–mixing in red giants of the blue MS population?
Here we examine the paths to these peculiar objects that could explain their
distribution as an evolutionary sequence.
Notice, first of all, that Cen “blue MS” has a metal content larger than the
one of the redder sequence (Piotto et al., 2005), so that its location can
be understood only in terms of an enhanced helium content, of about
38%-40% (Norris, 2004). Such a large and uniform helium content is in itself
very difficult to be explained in terms of chemical enrichment (see, e.g. D’Ercole et al., 2008),
but we take this evidence at face value and consider the constraints it poses on the evolution
of such helium rich stars. Even if the stars populating the blue MS do not differ
significantly in age from the rest of the cluster stars222This can be reasonably assumed,
as the only plausible progenitors of the extreme helium rich population are either
the massive fast rotating stars (Decressin et al., 2007), evolving in a few million years, or the
super–asymptotic giant branch (AGB) stars (Pumo et al., 2008), evolving in 30–40 million years.,
they evolve more rapidly, so that along the red
giant branch we find masses much smaller than the typical turnoff mass assumed to populate the
standard–helium main sequence. Using the simple linear approximation given in D’Antona & Caloi (2008),
MRG/Y–1.3, an increase in helium content from
the primordial value Y = 0.24 to the very high value Y = 0.40
decreases the evolving mass by 0.18. Although the modalities of mass loss along the RGB
are far from being clear, it is difficult to believe in a strong dependence of mass loss on the
helium abundance, so that we may expect that the giants in a GC lose about the same amount of
mass, irrespectively from their helium content.
Therefore, it is unavoidable that the progeny of the blue MS stars populates the bluest
parts of the HB, those corresponding to the smallest total masses. In order for a Y=0.24 standard star
to become a hot HB star, we must invoke huge unusual mass loss along the RGB (say,
0.15 larger than those populating the red HB). While this is not
impossible, it is highly unplausible that it concerns a great fraction of the blue hook stars.
On the other hand, being the blue hook stars the HB stars having the smallest total mass, the majority of
the very high helium population must end up there (a fraction can avoid the ignition of the
helium flash and go directly to the helium white dwarf cooling phase).
This reasoning implies that there must be a direct relation between the helium rich MS stars
and the blue hook stars. In addition, the interpretation of the blue hook sequences
in terms of even more enhanced
helium (Y0.6–0.8) requires additional mixing in the progenitors
of these stars or at the helium flash.
Notice that we can not hypothesize that the progenitors of blue hook stars are main sequence stars having
Y0.8 at their birth, for two main reasons: 1) for a reasonable cluster age, and for mass loss
rate not dramatically smaller than the mass loss of normal–helium populations, the evolving mass
of Y0.8 would not ignite helium, and evolve directly as helium white dwarf; 2) there is no observational
signal that such stars exist in the cluster.
An attractive explanation for the presence of very helium rich, very hot blue hook stars is given by the hypothesis of “flash mixing” during a late central helium flash occurring on the “peeled–off” red giant (D’Cruz et al., 1996) or even along the white dwarf cooling sequence (Brown et al., 2001). The more or less abundant mixing of material rich in carbon and helium with the (weak) hydrogen shell and the surface layers gives rise, after an episode of violent H–burning, to a HB–like structure with an atmosphere rich in helium and carbon, as observed. Besides, the luminosity and temperature of an object of this kind may be quite different from those of a star lying at the extreme of canonical HBs. In particular, they can be quite hotter than such stars, in accord with their subluminous position. This hypothesis may well be the correct explanation for a few blue hook stars, but certainly can not explain its majority. In fact the remnant hydrogen mass on the star suffering a flash after the red giant tip is really very low —from 8 to 14 in the model calculations by D’Cruz et al. (1996), see also Miller Bertolami et al. (2008)— compared to the envelope values of our models (from 2 to 50in the simulations shown in Fig. 3). In addition, the neat sequences observed in the blue hook seem to derive from a very well defined evolutionary phase, not from the erratic outcome of a complex process like nuclear burning during a mixing episode. We leave this question open to further computations, and conclude by asking whether is it possible to invoke a more prolonged phase of mixing to raise the envelope helium content in all or most of the blue MS stars.
Before the recognition that the GC chemical anomalies are present also at the surface of scarcely evolved stars (Gratton et al., 2001; Ramírez & Cohen, 2002), a “non canonical extra mixing”333“Canonical” extra–mixing is defined as the physical process needed to explain the penetration of convection into the outer part of the H–shell, where the CN branch of the CNO–cycle is operating, in order to explain the decline of carbon abundance, a strong reduction of the 12C/13C isotopic ratio in the upper red giant branch, and the decrease in surface Li and 3He abundances with increased (Pilachowski et al., 1993; Gratton et al., 2000), both in field stars and in cluster members (Sneden, 1991)., penetrating deep into the H–shell, has been hypothesized by Denisenkov & Denisenkova (1990) to explain the apparent increase in O deficiency and Na abundance in upper giant branch stars, and even in Al, under certain assumptions (Langer & Hoffman 1995; Denissenkov & Tout 2000; Denissenkov & Weiss 2001). Although the multiple population models is now generally accepted, thanks also to the photometric evidence, deep mixing might still play a role in the evolution: Denissenkov & VandenBerg (2003) have proposed that in some upper RGB stars canonical extra mixing may be switched to its enhanced mode with much faster and somewhat deeper mixing, which could be driven by differential rotation of the stellar radiative zones, this latter caused, e.g., by the spinning up of close binary members as a result of tidal synchronization (Denissenkov et al. 2006). It is commonly accepted that “canonical” and “non–canonical” extra–mixing occur at the “red giant bump” (Zoccali et al. 1999; Riello et al. 2003), where the H-burning shell, advancing in mass, erases the chemical composition discontinuity left behind by the bottom of convective envelope at the end of the first dredge-up (Gratton et al. 2000; Shetrone 2003). The presence of the red giant bump in the luminosity function of GCs can be taken as an experimental indication that the“standard” models of red giants actually make a good job in describing the evolution below the bump luminosity, and that no mechanisms of extra mixing in low-mass stars are acting, on the lower RGB, otherwhise the discontinuity left by convection would be smeared out and the bump would not be produced. It is generally assumed that the H–shell is shielded against mixing by the gradient in the mean molecular weight associated with the composition discontinuity (Sweigart & Mengel 1979; Charbonnel, Brown & Wallerstein 1998; Denissenkov & VandenBerg 2003) or, in any case, that it operates very slowly (Chanamé et al. 2005; Palacios et al. 2006). However, D’Antona & Ventura (2007) have investigated the evolution of red giant stars in the hypothesis that such “non canonical extra mixing” is efficient only for those cluster members which are most helium rich. The practically complete disappearance of the molecular weight discontinuity at the end of the first dredge–up (that is also the reason for the presence of the red giant “bump”), is the main hint that such an assumption is not unreasonable, and D’Antona & Ventura (2007) suggest that this deep mixing could well occur early during the red giant evolution, well before the bump location. This in situ deep mixing in high–helium red giants evolving today in GCs is able to explain the extremeley low oxygen abundances found in luminous red giants in clusters like M13 and NGC 2808. D’Antona & Ventura (2007) notice that the surface helium increases due to this extra–mixing. Although in their models this increase is relatively small, an earlier and faster deep mixing can provide stronger enhancements (Sweigart, 1997; Weiss et al., 2000). In particular, Weiss et al. (2000) models including a strong penetration of the mixing, and a large diffusion coefficient show a helium increase in the envelope by Y0.3, close to our requirements. These authors discard their models with Y0.1, noticing that the concomitant increase in sodium and depletion in oxygen would push these abundances out of the range observed in the anomalous stars of GCs. Nevertheless, oxygen abundances as low as [O/Fe]–1.2 are still acceptable for the extreme anomalies, and realistic models would not show the sodium increase, that is due to mixing through the region in which the 22Ne+p reaction is active in the giant interior. D’Antona & Ventura (2007) have shown that deep mixing does not alter the sodium abundance, if the evolving giants are formed from the 22Ne–poor gas ejected by the massive AGBs subject to HBB. Therefore, the models with very deep mixing can not be excluded on the basis of the extreme sodium anomalies predicted by models that do not start with the correct chemistry of the HBB processed gas.
Another approach is the “flash assisted” mixing proposed by Fujimoto et al. (1999). This model shows that, if hydrogen is carried down into the helium core by some extra mixing mechanism, a hydrogen-burning shell flash is ignited. The flash forces the formation of a convective shell whose outer edge extends into hydrogen-rich layers, bringing in fresh hydrogen to fuel the flash further, and during the decay phase of the flash the nuclear products are dredged up by surface convection, which becomes deeper in mass than during the quiescent phases. Also in these models, the surface helium enrichment may become very large, and the surface abundances will resemble the extreme anomalies found in GCs (Aikawa et al., 2001).
We propose than that deep mixing acts only in the very high helium giants, progeny of the blue main sequence. Even starting from Y0.38–0.40, these stars can reach the required very high helium in the envelope, prior to the helium flash and to their subsequent evolution, that consequently occurs along the blue hook. Other (unknown) physical inputs may cause a bimodal deep mixing, with different final helium content and the presence of two sides of the blue hook. The double character of the blue hook in Cen seems in fact to indicate that there are actually two kinds of helium rich progenitors of the blue hook, the most dominant ending with Y0.8 in the envelope, the latter one ending with a bit lower helium. Further observations and theoretical work are needed to understand this result. Model computation for this very deep extramixing is needed to understand whether this is a viable solution to our problem.
4 Acknowledgments
This work has been supported through PRIN MIUR 2007 “Multiple stellar populations in globular clusters: census, characterization and origin”. We thank Giampaolo Piotto, Alvio Renzini and Sandro Villanova for stimulating discussions, and J. Anderson, L. Bedin, and A. Milone for sharing their data with us. We finally thank the anonymous referee, whose comments helped us to clarify several points of the discussion.
References
- Aikawa et al. (2001) Aikawa, M., Fujimoto, M. Y., & Kato, K. 2001, ApJ, 560, 937
- Anderson & van der Marel (2009) Anderson, J., & van der Marel, R. P. 2009, arXiv:0905.0627, ApJ, in press
- Bedin et al. (2004) Bedin, L. R., Piotto, G., Anderson, J., Cassisi, S., King, I. R., Momany, Y., & Carraro, G. 2004, ApJ Letters, 605, L125
- Brown et al. (2001) Brown, T. M., Sweigart, A. V., Lanz, T., Landsman, W. B., & Hubeny, I. 2001, ApJ, 562, 368
- Busso et al. (2007) Busso, G., et al. 2007, A&A, 474, 105
- Cassisi et al. (2009) Cassisi, S., Salaris, M., Anderson, J., Piotto, G., Pietrinferni, A., Milone, A., Bellini, A., & Bedin, L. R. 2009, ApJ, 702, 1530
- Chanamé et al. (2005) Chanamé, J., Pinsonneault, M., & Terndrup, D. M. 2005, ApJ, 631, 540
- Charbonnel, Brown & Wallerstein (1998) Charbonnel, C., Brown, J. A., & Wallerstein, G. 1998, A&A, 332, 204
- D’Antona & Caloi (2008) D’Antona, F., & Caloi, V. 2008, MNRAS, 390, 693
- D’Antona & Ventura (2007) D’Antona, F., & Ventura, P. 2007, MNRAS, 379, 1431
- D’Antona et al. (2005) D’Antona, F., Bellazzini, M., Caloi, V., Fusi Pecci, F., Galleti, S., & Rood, R. T. 2005, ApJ, 631, 868
- D’Cruz et al. (1996) D’Cruz, N. L., Dorman, B., Rood, R. T., & O’Connell, R. W. 1996, ApJ, 466, 359
- Decressin et al. (2007) Decressin, T., Meynet, G., Charbonnel, C., Prantzos, N., & Ekström, S. 2007, A&A, 464, 1029
- Denisenkov & Denisenkova (1990) Denisenkov, P. A., & Denisenkova, S. N. 1990, Soviet Astr. Lett., 16, 275
- Denissenkov & Tout (2000) Denissenkov, P. A., & Tout, C. A. 2000, MNRAS, 316, 395
- Denissenkov & Weiss (2001) Denissenkov, P. A., & Weiss, A. 2001, ApJ, 559, 115
- Denissenkov & VandenBerg (2003) Denissenkov, P. A., & VandenBerg, D. A. 2003, ApJ, 593, 509
- Denissenkov et al. (2006) Denissenkov, P. A., Chaboyer, B., & Li, K. 2006, ApJ, 641, 1087
- D’Ercole et al. (2008) D’Ercole, A., Vesperini, E., D’Antona, F., McMillan, S. L. W., & Recchi, S. 2008, MNRAS, 391, 825
- Ferguson et al. (2005) Ferguson J. W., Alexander D. R., Allard F. et al., 2005, ApJ, 623, 585
- Fujimoto et al. (1999) Fujimoto, M. Y., Aikawa, M., & Kato, K. 1999, ApJ, 519, 733
- Gratton et al. (2001) Gratton, R. G., Bonifacio, P., Bragaglia, A., et al. 2001, A&A, 369, 87
- Gratton et al. (2000) Gratton, R. G., Sneden, C., Carretta, E., & Bragaglia, A. 2000, A&A, 354, 169
- Grevesse & Sauval (1998) Grevesse, N., & Sauval, A.J. 1998, SSRv, 85, 161
- Iglesias & Rogers (1996) Iglesias C. A. & Rogers F. J., 1996, ApJ, 464, 943
- Johnson et al. (2009) Johnson, C. I., Pilachowski, C. A., Michael Rich, R., & Fulbright, J. P. 2009, ApJ, 698, 2048
- Langer & Hoffman (1995) Langer, G. E., & Hoffman, R. D. 1995, PASP, 107, 1177
- Lee et al. (1999) Lee, Y.-W., Joo, J.-M., Sohn, Y.-J., Rey, S.-C., Lee, H.-C., & Walker, A. R. 1999, Nature, 402, 55
- Miller Bertolami et al. (2008) Miller Bertolami, M. M., Althaus, L. G., Unglaub, K., & Weiss, A. 2008, A&A, 491, 253
- Moehler et al. (2004) Moehler, S., Sweigart, A. V., Landsman, W. B., Hammer, N. J., & Dreizler, S. 2004, A&A, 415, 313
- Moehler et al. (2007) Moehler, S., Dreizler, S., Lanz, T., Bono, G., Sweigart, A. V., Calamida, A., Monelli, M., & Nonino, M. 2007, A&A, 475, L5
- Norris (2004) Norris, J. E. 2004, ApJ Letters, 612, L25
- Norris & Da Costa (1995) Norris, J. E., & Da Costa, G. S. 1995, ApJ, 447, 680
- Palacios et al. (2006) Palacios, A., Charbonnel, C., Talon, S., & Siess, L. 2006, A&A, 453, 261
- Pancino et al. (2000) Pancino, E., Ferraro, F. R., Bellazzini, M., Piotto, G., & Zoccali, M. 2000, ApJ, 534, L83
- Piotto et al. (2005) Piotto, G., et al. 2005, ApJ, 621, 777
- Pilachowski et al. (1993) Pilachowski, C. A., Sneden, C., & Booth, J. 1993, ApJ, 407, 699
- Potekhin et al. (1999) Potekhin, A. Y.; Baiko, D. A.; Haensel, P.; Yakovlev, D. G., 1999, A&A, 346, 345P
- Pumo et al. (2008) Pumo, M. L., D’Antona, F., & Ventura, P. 2008, ApJ, 672, L25
- Ramírez & Cohen (2002) Ramírez, S. V., & Cohen, J. G. 2002, AJ, 123, 3277
- Rey et al. (2004) Rey, S.-C., Lee, Y.-W., Ree, C. H., Joo, J.-M., Sohn, Y.-J., & Walker, A. R. 2004, AJ, 127, 958
- Riello et al. (2003) Riello, M., Cassisi, S., Piotto, G., Recio-Blanco, A., De Angeli, F., Salaris, M., Pietrinferni, A., Bono, G., & Zoccali, M. 2003, A&A, 410, 553
- Ripepi et al. (2007) Ripepi, V., et al. 2007, ApJ, 667, L61
- Rosenberg et al. (2004) Rosenberg, A., Recio-Blanco, A., & García-Marín, M. 2004, ApJ, 603, 135
- Shetrone (2003) Shetrone, M. D. 2003, ApJ, 585, L45
- Smith et al. (2000) Smith, V. V., Suntzeff, N. B., Cunha, K., Gallino, R., Busso, M., Lambert, D. L., & Straniero, O. 2000, AJ, 119, 1239
- Sneden (1991) Sneden, C. 1991, IAU Symp. 145: Evolution of Stars: the Photospheric Abundance Connection, 145, 235
- Sollima et al. (2005) Sollima, A., Pancino, E., Ferraro, F. R., Bellazzini, M., Straniero, O., & Pasquini, L. 2005, ApJ, 634, 332
- Suntzeff & Kraft (1996) Suntzeff, N. B., & Kraft, R. P. 1996, AJ, 111, 1913
- Sweigart & Mengel (1979) Sweigart, A. V., & Mengel, J. G. 1979, ApJ, 229, 624
- Sweigart (1997) Sweigart, A. V. 1997, ApJ, 474, L23
- Ventura et al. (2009) Ventura, P., Caloi, V., D’Antona, F., Ferguson, J., Milone, A., & Piotto, G. 2009, MNRAS, 499, 835
- Ventura et al. (2010) Ventura, P., Caloi, V., D’Antona, F., 2009b, in preparation
- Villanova et al. (2010) Villanova, S., et al. 2010, in preparation
- Weiss et al. (2000) Weiss, A., Denissenkov, P. A., & Charbonnel, C. 2000, A&A, 356, 181
- Zoccali et al. (1999) Zoccali, M., Cassisi, S., Piotto, G., Bono, G., & Salaris, M. 1999, ApJ, 518, L49