Hypergraph model of social tagging networks
Abstract
The past few years have witnessed the great success of a new family of paradigms, so-called folksonomy, which allows users to freely associate tags to resources and efficiently manage them. In order to uncover the underlying structures and user behaviors in folksonomy, in this paper, we propose an evolutionary hypergrah model to explain the emerging statistical properties. The present model introduces a novel mechanism that one can not only assign tags to resources, but also retrieve resources via collaborative tags. We then compare the model with a real-world dataset: Del.icio.us. Indeed, the present model shows considerable agreement with the empirical data in following aspects: power-law hyperdegree distributions, negtive correlation between clustering coefficients and hyperdegrees, and small average distances. Furthermore, the model indicates that most tagging behaviors are motivated by labeling tags to resources, and tags play a significant role in effectively retrieving interesting resources and making acquaintance with congenial friends. The proposed model may shed some light on the in-depth understanding of the structure and function of folksonomy.
pacs:
89.20.Hh, 89.65.-s, 05.65.+b, 85.75.-kI Introduction
Networks provide us a powerful and versatile tool to recognize and analyze complex systems where nodes represent individuals, and links denote the relations between them. Recently, many efforts have been addressed in understanding the structure, evolution and dynamics of complex networks Albert2002 ; Dorogovtsev2002 ; Newman2003 ; Boccaletti2006 ; Costa2007 . The advent of Web 2.0 and its affiliated applications bring a new form of user-centric paradigm which can not be fully described by pre-existing models on unipartite or bipartite networks. One such example is the user-driven emerging phenomenon, folksonomy, which allows users to upload resources (bookmarks, photos, movies, etc.) and freely assign them with user-defined words, so-called tags. Folksonomy requires no specific skills for user to participate, broadens the semantic relations among users and resources, and eventually achieves its immediate success in a few years. Presently, a large number of such applications can be found online, such as Del.icio.us f1 , Flickr f2 , CiteULike f3 , etc. With the help of those platforms, users can not only store their own resources and manage them with collaborative tags, but also look into other users’ collections to find what they might be interested in by simply keeping track of the baskets with tags. Unlike traditional information management methods where words (or indices) are normally pre-defined by experts or administrators, e.g. the library classification systems, a tagging system allows users to create arbitrary tags that even do not exist in dictionaries. Therefore, those user-defined tags can reflet user behaviors and preferences with which users can easily make acquaintance, collaborate and eventually form communities with others who have similar interests Sen2006 .
Up to now, a variety of research works have been done in realizing the structure and dynamic process of folksonomy. Golder et al. studied the usage patterns of collaborative tagging systems and classified seven kinds of tag functions Golder2006 , which is very helpful for us in better understanding both the user behaviors and tagging purposes. In addition, the keywords or PACS numbers based methods are put forward to reveal the underlying structure of co-authorship and citation networks Palla2008 ; ZhangZK2008 . Furthermore, many efforts have been done to explain how folksonomy emerges. Cattuto et al. Cattuto20071 investigated the dynamics of an open-ended system with a memory-based Yule-Simon model. The model considered the aging effect of tags, as well as the frequency of tag occurrence. In Ref. Lambiotte2006 , they tried to model folksonomy in a form of tripartite graphs.
Recently, the hypergraph theory Karypis1997 allows a hyperedge to connect an arbitrary number of vertices instead of two in regular graphs. Therefore, it provides us a promising way to better understand a wide range of real systems. Up to now, it has been found applications in Personalized Recommendation Blattner2009 ; ZhangZK2010 ; ShangMS2010 , Population Stratification Vazquez2008 , and Cellular Networks Klamt2009 , etc. Besides, the definition is comparatively appropriate to uncover underlying usage patterns and essential structures of folksonomies. Ghoshal et al. Ghoshal2009 proposed a random hypergraph model to represent the ternary relationship where a hyperedge consists of one user, one resource and one tag, and reproduced many properties of folksonomy by the model. Zlatić et al. Zlatic2009 extensively defined a number of useful topological features based on hypergraph representation, which can be considered as a standard tool in understanding the structure of tagged networks.
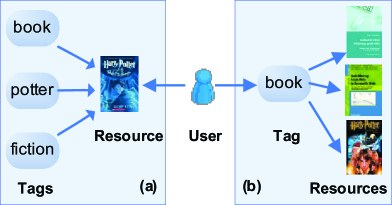
In this paper, we propose a hypergraph model to illustrate the emergence of some statistical properties in folksonomy, including degree distribution, clustering coefficients and average distance between nodes. We consider two typical user tagging behaviors: (i) one might be aware of a resource via web surfing or word-of-mouth propagation, and then save it as his/her own favorite collection and annotate it with several tags of related topics for efficient management and retrieval; (ii) s/he might firstly pick up one or several compound tags, and then choose one possible resource from the retrieval results. Recently, a considerable amount of researches have focused on the previous motivation Halpin2007 ; Cattuto2009 , while the latter one is comparatively lack of attention. Actually, tag is able to provide more relevant results according to its simple yet essential property of collaboration and semantics. Fig. 1 shows those two different kinds of mechanisms.
In this model, users can manage resources with collaborative tags, and find resources by tags via serendipitous browsing. We compare the model to one real-world dataset, Del.icio.us, and find good agreement between them.
II Modeling Tripartite Hypergraphs
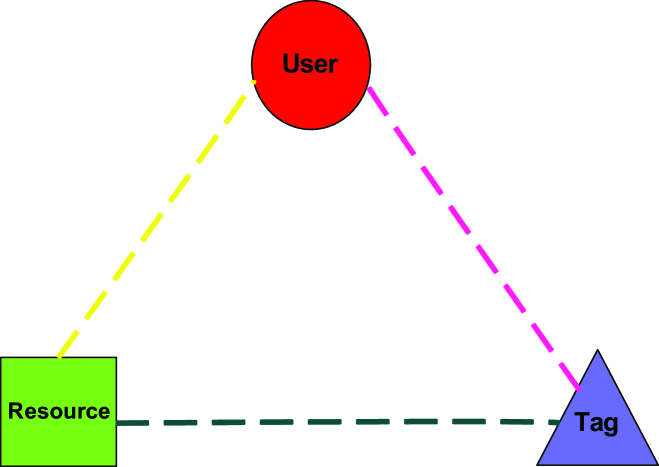
We begin our study with some related definitions of tripartite hypergraph that we will analyze. In this paper, we use the tripartite hypergraph representation given by Ref. Ghoshal2009 , where a hyperedge simply consists of one user, one resource and one tag. Fig. 2 gives a visual explication of such structure.
In a tripartite hypergraph, the network G can be briefly depicted by G=(V,H), where V denotes the vertices and H represents the set of hyperedges. V=U R T where U, R and T represent the set of users, resources and tags respectively, and H U R T is usually much smaller than the number of all the possible triangles. Correspondingly, the Del.icio.us dataset we collected has 15009 users, 2431190 resources and 325120 distinct tags, which subsequently constitute 11739998 hyperedges.
II.1 Model
Consequently, we are mainly interested in the effect of tagging behaviors and the role of tags in networks. Therefore, we fix the distribution of user activities according to the empirical data. Thus, the model can be described as following:
-
•
At each time step, pick up a random user according to the given distribution of user activities.
-
•
For , s/he can either choose a resource with probability , or select an arbitrary tag with probability 1-.
-
•
If is activated from the aspect of resource, s/he will randomly select an existing resource in the system with probability 1- according to its popularity, or introduce a completely new resource with probability . And then s/he will annotate it with a few tags. For simplicity, in this paper, we only consider that will assign only one tag to the selected resource . Thus, could choose the tag from his/her own vocabulary with probability according to how many times s/he has adopted it , or from the resource vocabulary with probability according to how many times it has been associated with the target resource, or introduce a new tag with probability 1-(+) if s/he does not find a suitable or personalized tag to describe .
-
•
If decides to find a relevant resource from a specific topic, s/he will choose a random tag based on its popularity, and then save one of the relevant resources according to how many triangles they have appeared together with .
In this model, a new hyperedge (,,) is produced either from the perspective of resources or tags at each time step. When one tries to give a tag to a certain resource, s/he might choose a previous tag s/he used before, or pick up one tag recommended by the system. A new tag is added if no appropriate tags is available to describe that resource. Thus a tag-growth mechanism is considered in the present model. We then repeatedly run the model until enough number of hyperedges is obtained. Moreover, we simply assume that there is only one hyperedge emerges once the user is activated, which is not the case in real networks. However, such simplified assumption could help us examine the effects of different tagging behaviors on the emergence of folksonomies. To evaluate our model, we measure the following quantities (Fig. 3 gives a detailed description of these quantities):
(i) hyperdegree distribution: defined as the proportion that each hyperdegree occupies, where hyperdegree is defined as the number of hyperedges that a regular node participates in.
(ii) clustering coefficients: defined as the proportion of real number of hyperedges to all the possible number of hyperedges that a regular node could have.
(iii) average distance: defined as the average shortest path length between two random nodes in the whole network.
Since we are mainly interested in how the tagging behaviors influence the emergence of folksonomies, we fix other parameters and investigate the effect of . In the following analysis, we set =0.3, ==0.45 as constants.

II.2 Hyperdegree Distribution
According to Ghoshal2009 , hyperdegree is defined as how many triples a regular node takes part in. Thus we denote , , as the fraction of users, resources and tags, respectively. In terms of the model, is directly derived from the empirical data. Therefore, we mainly focus on the dynamics of and . Firstly, we can write down the rate equation for the distribution of resources Albert2002 (In order to avoid confusion of the time symbol, we use to represent the time in following descriptions):
| (1) |
where is denoted as the hyperdegree distribution of resources at time , is the probability to pick up an uncollected resource for with hyperdegree according its popularity, = is the probability to choose a resource from a random tag at time , and is the Kronecker delta. The first brace shows the choice described in the model, where the first term is the probability of adding a new resource and the second term is the probability of selecting an existing resource. The second brace depicts the evolutionary process from the aspect of tags. However, it is not easy to identify the distribution of each individual’s absent resources, we approximatively consider that distribution is direct proportion to that of the system, that is,
| (2) |
Integrate Eq. (1) and Eq. (2), as well as the stationary condition , we have:
| (3) |
for 1. When =1, Eq. (1) can be simplified to:
| (4) |
Combine Eq. (3) and Eq. (4), we can recursively obtain the final solution:
| (5) |
where = and is the Gamma function.
Analogously, we can also write down the tag hyperdegree distribution in the form of rate equation:
| (6) |
where is the probability of picking up a random tag with hyperdegree at time . According to the present model, there are four mechanisms that drive the growth of tags: (i) user selects one tag from his/her own vocabulary with probability ; (ii) chooses one word from the set of tags associated with the the target resource with probability ; (iii) a new tag is introduced with probability 1--; (iv) selects an interesting tag from all the possible candidates and saves a resource that is relevant with . Eq. (6) exactly expresses the integrated effect on tag evolution of those mechanisms.
We take the similar assumption of Eq. (2) that the individual’s tag hyperdegree distribution is direct proportion to that of the system:
| (7) |
We then follow the same processes of Eq. (3) and Eq. (4), the solution will read:
| (8) |
where =.
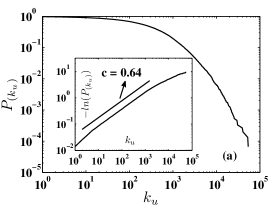
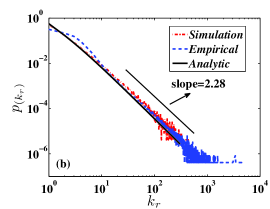
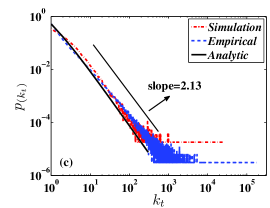
Fig. 4 shows the simulation, analytical and empirical results of hyperdegree distributions in both the real and modeled networks. Fig. 4(a) shows the empirical data of users’ cumulative hyperdegree distribution, which follows a stretched exponential distribution Laherrere1998 ; Shang2010 . Fig. 4(b) and Fig. 4(c) show good agreements among empirical observation and analytical result, while the inconsistent in Fig. 4(b) might be caused by our assumption that results in a comparatively large number resources with small hyperdegrees. Note that indicates that most actions of the tagging are from the resource aspect in folksonomies.
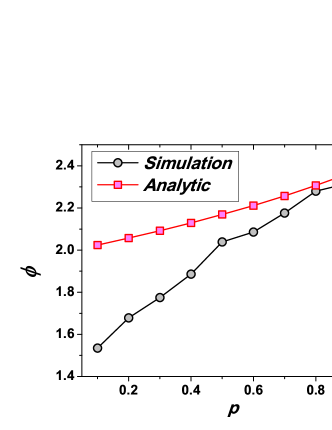
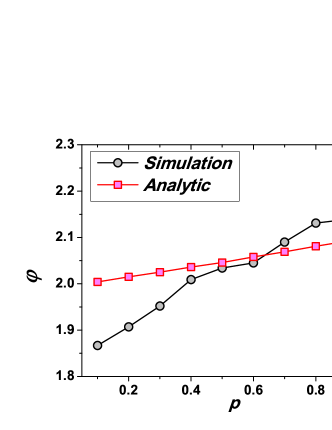
In addition, we measure the effect on hyperdegree distribution with different values of . In Fig. 5(a), the resource hyperdegree distribution is in good agreement only when increases over 0.7. Whereas, the slope of tag hyperdegree distribution does not change much with virous value of . This might be caused by two reasons: (i) the evolution of folksonomy is driven primarily by assigning tags to the target resource, which is consistent with large value of ; (ii) when is small, the fat-tail of resources with small degree will remarkably affects the fitting result.
II.3 Clustering Coefficients
Clustering in a network measures the likelihood that two neighbors of a given node are inclined to connect to each other. Watts and Strogatz Watts1998 have introduced the clustering coefficient to measure the amount of clustering for a given node in normal unipartite networks. However, this definition is not fully compatible with the hypergraph case, since a regular node connects two other different types of nodes. Thus, we adopt the definition of user clustering coefficient given in Ref. Cattuto20072 ; f4 :
| (9) |
where is the hyperdegree of user , is the number of resources that collects and is the number of tags that possesses. The above definition measures the fraction of possible pairs present in the neighborhood of . A larger indicates that has more similar topic of resources, which might also show that has more concentrated on personalized or special topics. Then the hyperdegree-based clustering coefficient is averaged over all the nodes with the same hyperdegrees.
In order to compute , we shall consider the evolutionary dynamics of , the number of tags used by the selected user, as well as the dynamics of , the current number of tags existing in the system. We can write the differential functions:
| (10) |
where is the total number of tags we initially set in the model and is the total number of designed simulation steps. Since we assume that only one tag is allowed to be assigned at each time step, the hyperdegrees of users and resources are degenerated to bipartite case. Therefore, we get = . Thus, Eq. (9) can be rewritten as:
| (11) |
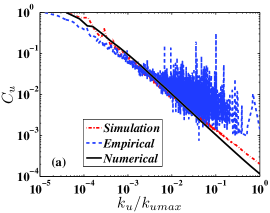
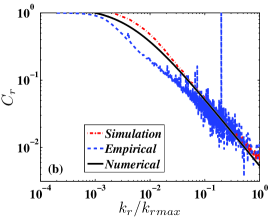
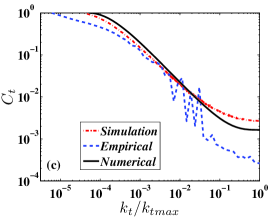
Unfortunately, It is not easy to get the explicit expression of Eq. (10). Instead, we find the numerical solution by combining Eq. (10) and Eq. (11). Fig. 6(a) shows the good consistency among the empirical, simulation and numerical results.
Analogously, we can also write the dynamics of :
| (12) |
where is resource hyperdegree, is the number of tags attached to resource , and is the number of users who have collect . Fig. 6(b) shows the numerical solution for Eq. (12), as well as the empirical and simulation results.
And the dynamics of is as following:
| (13) |
where is tag hyperdegree, is the number of users which is fixed in the model, is the number of users who have used tag , is the number of resources existing in the system, and is the number of resources labeled with . Fig. 6(c) shows the numerical solution for Eq. (13), as well as the empirical and simulation results. All the three plots in Fig. 6 show negative correlations between clustering coefficient and hyperdegree on both the real-world and modeled networks. It might indicate the hierarchical structure of tripartite hypergraphs Ravasz2003 , and suggest that users with larger hyperdegrees have more diverse interests, and vice verse.
II.4 Average Distance
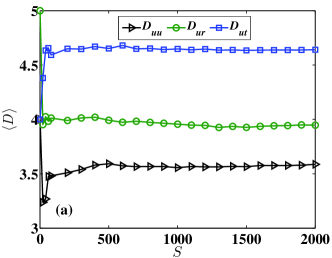
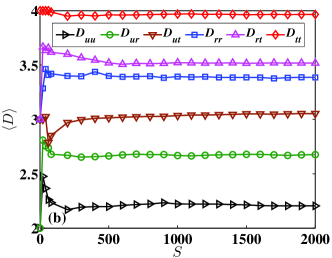
Another important quantity is the distance, , between a random pair of nodes in a network. Hence, the average distance, , measures the efficiency of retrieving a target node in a network. Take a friendship network for example, is given by counting the average shortest path length between a random user and another arbitrary user. Therefore, assesses how easily yet effectively for a user to make acquaintance with others in a given friendship network.
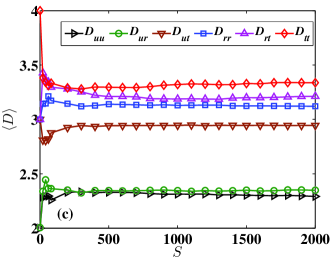
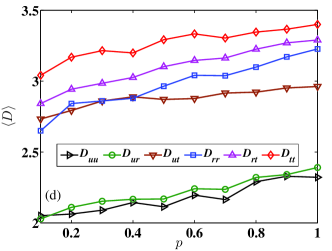
However, in the case of tripartite hypergraph, there are three different regular nodes. Therefore, the shortest path length can be defined as the minimal number of hyperedges that must be traversed to go from vertex to vertex. Fig. 7 shows the between any two types of vertices. Fig. 7(a) and Fig. 7(b) show the average distances of the bipartite network and hypergraph structure of Del.icio.us, respectively. We can see that: (i) tags can significantly shorten for any pair of nodes in comparison with the bipartite case. For example, of user-user pair is enhanced from 3.587 to 2.205, of user-resource pair is improved from 3.947 to 2.676, and the value of of resource-resource pair is shortened from 4.641 to 3.386. These considerable improvements might indicate that tags play an important role in Information Retrieval; (ii) in Fig. 7(b), the magnitude strictly follows the order: in both general and special cases. For example, we have: for users, for resources, and for tags. The similar patten of those orders might imply that Del.icio.us is a user-centric system so that we can more easily find any information through users than others. Besides, the main purpose of tagging is to more efficiently and effectively manage resources, which keeps coherence of comparatively large value of in previous sections. Fig. 7(c) reproduces such exciting phenomenon with =0.8 in the model. Furthermore, we study the effect of different values of on the distances. In Fig. 7(d), it is shown that the order does almost keep steady whatever the value changes to. Additionally, Fig. 7(d) also indicates that all the distances decreases monotonously with the lessening of , which might suggest that the more often we use tags, the more effective we can find target information.
III Conclusion and Discussion
In this paper, we have proposed an evolutionary hypergraph model to study the dynamical properties of social tagged networks, so-called folksonomies. The present model assumes that there are two typical tagging behaviors based on preferential attachment mechanism: (i) assigning tags to users’ favorite resources; (ii) saving resources that are relevant to interesting tags. The resulting tripartite hypergraph shows good agreement with a real-world network, Del.icio.us, in following aspects: (i) the power-law hyperdegree distributions are generated for resources and tags, which indicates the heterogeneous topology; (ii) the decay of average clustering coefficients with the increase of hyperdegree, which may indicate hierarchical structure of tripartite hypergraphs ; (iii) the average distances between vertices of hypergraph are comparatively smaller than those in corresponding bipartite networks without tags; (iv) the relatively small average distance indicates a small-world property, which facilitates the serendipitous discovery of interesting contents and congenial companions; (v) all the above properties are found relatively high consistency with a comparatively large value of =0.8, which suggests that the majority of actions is motivated by the first tagging behavior. Consequently, this model quantitatively reveals the accessorial yet significant role that tags play in folksonomies.
However, despite the good agreements in reproducing several features with real data, it is not easy to fully uncover the mechanisms dominating the emergence of folksonomy. This paper only provides a start point for understanding the underlying motivations in facilitating a variety of intricate properties in such new paradigms. The present model considers that only one hyperedge is allowed to come forth at each time step, which is moderately not the case in real systems. The tag co-occurrence Cattuto20071 ; Cattuto20072 and social cognitive imitation mechanisms Dellschaft2009 can be taken into account to improve the proposed model.
ACKNOWLEDEMENTS
We acknowledge Dong Wei for providing us the data set, Jian-Guo Liu, Linyuan Lü, Chi-Ho Yeung and Tao Zhou for helpful discussions and suggestions. This work is partially supported by the Swiss National Science Foundation (Project 200020-121848). ZKZ acknowledges the National Natural Science Foundation of China under the grant nos. 60973069 and 90924011. CL and ZKZ acknowledge the Scholarship Program supported by China Scholarship Council (CSC Program).
References
- (1) R. Albert and A.-L. Barabási, Rev. Mod. Phys. 74, 47 (2002).
- (2) S. N. Dorogovtsev and J. F. F. Mendes, Adv. Phys. 51, 1079 (2002).
- (3) M. E. J. Newman, SIAM Rev. 45, 167 (2003).
- (4) S. Boccaletti, V. Latora, Y. Moreno, M. Chavez, and D.-U. Huang, Phys. Rep. 424, 175 (2006).
- (5) L. da F. Costa, F. A. Rodrigues, G. Traviesor, and P. R. U. Boas, Adv. Phys. 56, 167 (2007).
- (6) http://del.icio.us.
- (7) http://www.flickr.com.
- (8) http://www.citeulike.com.
- (9) S. Sen, S. K. Lam, A. M. Rashid, D. Cosley, D. Frankowski, J. Osterhouse, F. M. Harper, and J. Riedl, Proc. 20th Anniversary Conf. Computer Supported Cooperative Work, pp. 190 (2006).
- (10) S. A. Golder and B. A. Huberman, J. Info. Sci. 32, 198 (2006).
- (11) G. Palla, I. J. Farkas, P. Pollner, I. Deréyi, and T. Vicsek, New J. Phys. 10, 123026 (2008).
- (12) Z.-K. Zhang, L. Lü, J.-G. Liu, and T. Zhou, Eur. Phys. J. B 66, 557 (2008).
- (13) C. Cattuto, V. Loreto, and L. Pietronero, Proc. Natl. Acad. Sci. USA 104, 1461 (2007).
- (14) R. Lambiotte and M. Ausllos, Lect. Notes Comput. Sci. 3993, 1114 (2006).
- (15) G. Karypis, R. Aggarwal, V. Kumar, and S. Shekhar, Proc. 34th Annual Conf. Design Auto., pp. 526 (1997).
- (16) M. Blattner, arXiv: 0908.2741.
- (17) Z.-K. Zhang, T. Zhou, and Y.-C. Zhang, Physica A 389, 179 (2010).
- (18) M.-S. Shang, Z.-K. Zhang, T. Zhou, and Y.-C. Zhang, Physica A 389, 1259 (2010).
- (19) A. Vázquez, Phys. Rev. E 77, 066106 (2008).
- (20) S. Klamt. U.-U. Haus, and F. Theis, PLoS Comput. Biol. 5, e1000385 (2009).
- (21) G. Ghoshal, V. Zlatić, G. Caldarelli, and M. E. J. Newman, Phys. Rev. E 79, 066118 (2009).
- (22) V. Zlatić, G. Ghoshal, and G. Caldarelli, Phys. Rev. E 80, 036118 (2009).
- (23) C. Cattuto, A. Barrat, A. Baldassarri, G. Schehr, and V. Loreto, Proc. Natl. Acad. Sci. USA 106, 10511 (2009).
- (24) H. Halpin, V. Robu, and H. Shepherd, Proc. 16th. Conf. WWW, pp. 220 (2007).
- (25) J. Laherrére, and D. Sornette, Eur. Phys. J. B 2, 525 (1998).
- (26) M.-S. Shang, L. Lü, Y.-C. Zhang, and T. Zhou, arXiv: 0909.4938.
- (27) P.-P. Zhang, K. Chen, Y. He, T. Zhou, B.-B. Su, Y.-D. Jin, H. Chang, Y.-P. Zhou, L.-C. Sun, B.-H. Wang, and R.-R. He, Physica A 360, 599 (2006).
- (28) D. J. Watts and S. Strogatz, Nature 393, 440 (1998).
- (29) C. Cattuto, C. Schmitz, A. Baldassarri, V. D. P. Servedio, V. Loreto, A. Hotho, M. Grahl, and G. Stumme, AI Commun. 20, 245 (2007).
- (30) To evaluate the clustering coefficients in hypergraphs, Zlatić et al. Zlatic2009 proposed a metric based on counting the overlap of a coordination number, , for a given vertex, which might be not compative with some special cases. For hyperdegree =1, this measurement gives , while a more reasonable value of =1 should be considered in this case. We, therefore, alternatively adopt the definition of Cattuto20072 in this paper, which is simple and meaningful for tripartite hypergraphs.
- (31) E. Ravasz and A.-L. Barabási, Phys. Rev. E 67, 026112 (2003).
- (32) K. Dellschaft and S. Staab, Proc. 19th ACM Conf. Hypertext Hypermedia pp. 71 (2009).