Comment on "Doping Driven () Nesting and Magnetic Properties of Fe1+xTe Superconductors" [Phys. Rev. Lett. 103, 067001 (2009)]
††preprint: This line only printed with preprint optionIn a recent Letter (Han and Savrasov, 2009), Han and Savrasov described the changes in the electronic structure and magnetic properties of Fe1+xTe as a function of using the full-potential, linear muffin-tin orbital (FP-LMTO) method within the rigid-band approximation (RBA). In particular, they used the electronic structure of FeTe and RBA to study the band structure, density of states (DOS), and Fermi surface (FS) of Fe1.068Te (or Fe1.063Te) and Fe1.141Te. They find that the excess Fe drives FS nesting in FeTe to a nesting in Fe1.068Te.
In this Comment, using Korringa-Kohn-Rostoker coherent-potential approximation method in the atomic-sphere approximation (Singh, ) (KKR-ASA CPA) to describe the effects of disorder due to excess Fe in FeTe alloys, we show that (i) the rigid-band approximation is inadequate to describe the effects of disorder and its application leads to an incorrect description of the underlying physics, (ii) the rigid-band energy shift of eV for going from FeTe to Fe1.068Te (or Fe1.063Te), as obtained in Ref. (Han and Savrasov, 2009), is inconsistent with our FP-LMTO as well as the KKR-ASA results, and thus the FS of Fe1.063Te shown in Fig. 3(b) of Ref. (Han and Savrasov, 2009) is not correct. In addition, Fig. 3 of Ref. (Han and Savrasov, 2009) does not show the FS in plane but it rather gives the top view (slightly tilted towards top-right) of the full FS, and in the caption, the positions of the and M points have been interchanged.
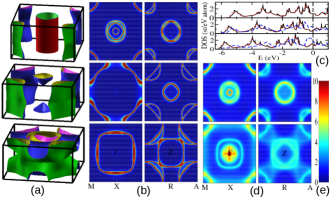
We show in Fig. 1, the DOS and the FS of Fe1+xTe alloys calculated with the FP-LMTO and the KKR-ASA methods using the RBA, and with the KKR-ASA CPA method. For , our results are in agreement (epa, ) with that of Ref. (Han and Savrasov, 2009; Subedi et al., 2008), which confirms the reliability of the ASA in the present context. For going from FeTe to Fe1.068Te using the RBA, we need to accommodate 0.544 excess electrons per Fe atom, requiring an upward shift in the FP-LMTO (KKR-ASA) Fermi energy, , of eV. Similarly, the shift for Fe1.141Te is found to be eV. Within the RBA, our FP-LMTO and KKR-ASA results are in good agreement with each other. However, Han and Savrasov find a shift of eV, almost twice as much as we do, for Fe1.063Te. Note that their shift is close to our shift for Fe1.141Te. As a result the FS of Fe1.063Te as shown in Fig. 3(b) of Ref. (Han and Savrasov, 2009) is not consistent with the RBA. Our FP-LMTO and KKR-ASA results for the FS of Fe1+xTe alloys, using the RBA, are shown in Fig. 1(a)-(b), and for , they are in agreement with Refs. (Han and Savrasov, 2009; Subedi et al., 2008). Not surprisingly, Fig. 3(b) of Ref. (Han and Savrasov, 2009) is closer to the FS of Fe1.141Te as shown in our Fig. 1(a).
We find the KKR-ASA CPA DOS of Fe1.068Te and Fe1.141Te, shown in Fig. 1(c), to be very different from the rigid-band results of both the FP-LMTO and the KKR-ASA methods. The CPA DOS moves up and there is a substantial redistribution of states throughout the energy range, especially around , making the RBA quite inaccurate. The inadequacies of the RBA are further revealed by comparing the CPA FS, shown in Fig. 1(d) with that of the rigid-band. The diffused intensity in Fig. 1(d) indicates the effects of disordering due to excess Fe in FeTe alloys.
References
- Han and Savrasov (2009) M. J. Han and S. Y. Savrasov, Phys. Rev. Lett. 103, 067001 (2009).
- (2) P. P. Singh, eprint arXiv:0908:0303.
-
(3)
eprint See supplementary material at http://link.aps.org/
supplemental/10.1103/PhysRevLett.104.099701. - Subedi et al. (2008) A. Subedi, L. Zhang, D. J. Singh, and M. H. Du, Phys. Rev. B 78, 134514 (2008).