Sodium: a charge-transfer insulator at high pressures
Abstract
By means of first-principles methods we analyse the optical response of transparent dense sodium as a function of applied pressure. We discover an unusual kind of charge-transfer exciton that proceeds from the interstitial distribution of valence electrons repelled away from the ionic cores by the Coulomb interaction and the Pauli repulsion. The predicted absorption spectrum shows a strong anisotropy with light polarization that just at pressures above the metal-insulator transition manifests as sodium being optically transparent in one direction but reflective in the other. This result provides a key information about the crystal structure of transparent sodium, a new unconventional inorganic electride.
Simple-to-complex phase transition.– In textbooks sodium is defined as the simplest of the simple metals grosso . At ambient pressure it has a high-symmetry crystal structure with non directional metallic bondings. Valence electrons can be treated as almost independent particles, only weakly perturbed by the electron-ion interaction. They form a homogeneous and isotropic electron gas, giving rise to a nearly spherical Fermi surface. As a consequence, also the optical properties are well described by the Drude model of free carriers. Application of pressure, instead, changes the situation quite dramatically while revealing an emergent complexity. Sodium under pressure shows an unexpected and often counter-intuitive behaviour. Instead of becoming more free-electron-like, at higher densities it adopts several low symmetry (and even incommensurate) crystal structures structure1 ; structure2 ; melting1 ; incommensurate ; nature ; pnas and has a very unusual melting curve melting1 ; melting2 . This surprising behaviour had been anticipated by Neaton and Ashcroft ashcroft-neaton , who also predicted a possible metal to insulator transition mit2 . At very high pressures compression is sufficiently strong that core electrons start to overlap and Pauli exclusion principle favours less symmetric charge distributions with - hybridizations nature ; ashcroft-neaton . The Coulomb repulsion between core and valence electrons leads to charge localization in interstitial positions, instead of around nuclei, and finally to an insulating state ashcroft-neaton . From a simple, uncorrelated, reflective metal, sodium turns into a complex, correlated, transparent insulator. It is a whole change of paradigm ashcroft2008 .
The crystal structure of the recently discovered insulating state was identified as a distorted, six-coordinated double-hexagonal closed-packed structure (hP4) nature . Experimentally, it is found that under pressure body-centred cubic Na first becomes face-centred cubic (at 65 GPa) and then transforms into a cI16 structure structure1 (at 103 GPa). Besides adopting many different structures near the minimum of the melting curve structure2 (118 GPa), it crystallizes in the oP8 and tI19 phases incommensurate (above 125 GPa), before undergoing a final transition to the newly proposed hP4 phase at around 200 GPa. Theoretically nature , the incommensurate tI19 and the oP8 phases were found to have nearly equal enthalpies and the transition to the hP4 structure occurs at slightly higher pressures (260 GPa). Measurements were performed at room temperature, while the zero-temperature structural calculations neglected entropic contributions and lattice dynamics (phonon enthalpies along with quantum effects on the light sodium ions), and hence could not provide a direct confirmation of the theoretical results ashcroft_comment .
In the present Letter, we study the optical response of the hP4 phase employing the highly accurate Bethe-Salpeter equation (BSE), which is the state-of-the-art approach for first-principles predictions of optical properties in solids RMP-noi . Our results provide evidence for the emergence of relevant excitonic (i.e. electron-hole correlation) effects, with the formation of an unusual charge-transfer exciton, and a strong anisotropy in the dielectric response. They represent a stringent fingerprint of the hP4 crystal structure of transparent dense sodium.
Absorption spectra and excitons.– The BSE can be cast into an effective two-particle Schrödinger equation for the wavefunction of the electron-hole pair (i.e. the exciton):
| (1) |
where the excitonic Hamiltonian includes the electron-hole interaction RMP-noi . In our first-principles approach, is represented on a Kohn-Sham basis:
| (2) |
where () runs on valence (conduction) bands and is in the first Brillouin zone. The optical spectrum is then obtained from the imaginary part of the dielectric function :
| (3) |
When excitonic effects are unimportant the eigenvalues correspond to vertical transition between one-quasiparticle energies (which we calculate in the GW approximation Hedin ) and the coefficients become diagonal, reducing Eq. (3) to the well known Fermi’s golden rule grosso . We investigate the effect of pressure on the formation of excitons, through charge localization and the reduction of the screening of the electron-hole interaction. Excitons can be identified by means of the twofold role that they play on the absorption spectra. First, the modification of the excitation energies induces a shift of the positions of the peaks in the spectrum: as a consequence, new peaks can appear inside the fundamental band gap (bound excitons); second, the mixing of the independent-particle transitions leads to a global reshaping of the spectrum towards lower energies (continuum excitons). Our ab initio solution of the BSE proceeds in three steps. We start from a ground-state calculation using density-functional theory in local-density approximation (LDA), where we employ the lattice constants of the hP4 phase from Ref. nature corresponding to representative pressures (see Ref. epaps Tab. 1). We treat 3, 2 and 2 electrons explicitly as valence, leaving only the very tightly bound 1 in the frozen ionic core (this required us to use a energy cut-off of 80 Ha in the plane-wave representation of the wave functions). We then calculate the quasiparticle GW electronic structure that we use as input for the Bethe-Salpeter equation (1). In the calculation of the screening and the GW corrections, where we adopt the Godby-Needs plasmon-pole model Godby-Needs , we use 150 bands and a cut-off of 20 Ha on the wave functions. To converge the absorption spectra up to 7-8 eV we consider 2 valence and 8 conduction bands and sample the first Brillouin zone with a uniform grid of inequivalent 2000 points, slightly shifted from high-symmetry points. We then apply a 0.1 eV gaussian broadening 111 We use 1024 points and 0.3 eV broadening when we study the dependence on pressure of the optical spectra. For the plot of the exciton wave function the point grid includes the point..
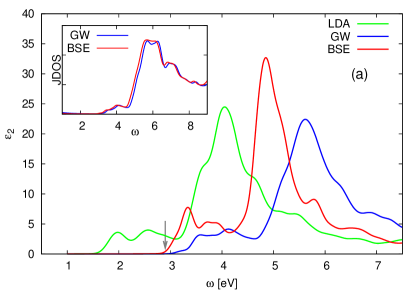
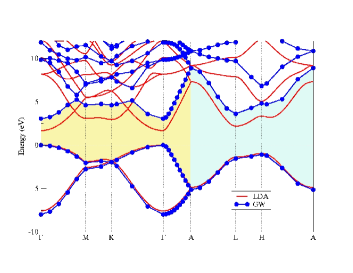
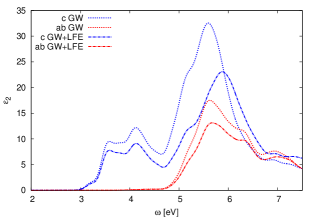
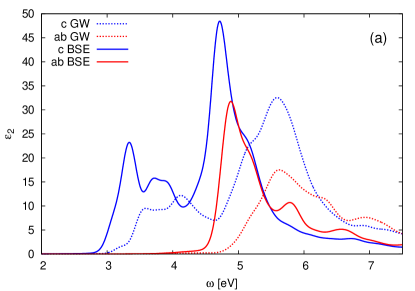
Excitons in dense sodium.– To illustrate our discussion, we first consider the results obtained with the lattice parameters calculated by Ma et al. nature in correspondence to a pressure of 320 GPa. We then analyse the dependence of the excitonic effects with applied pressure. In Fig. 1(a) we compare the absorption spectra that we obtain by solving the BSE or by using Fermi’s golden rule (averaged with respect to the different light polarizations). In the latter case transition energies are calculated either using LDA or the GW approximation. The GW corrections on the band structure induce an almost rigid blue-shift to the LDA spectrum, reflecting the correction of the usual underestimation of the quasiparticle band gap in LDA (see Ref. epaps Fig. 1). The onset moves from 1.7 eV in LDA to 3.0 eV in GW. It corresponds to a direct transition in between the top valence and the bottom conduction bands. Adding interaction between GW-quasiparticles, i.e. quasiparticle electron-hole attraction, we observe a substantial modification of the spectrum: i) strong redistribution of the optical oscillator strength to lower energies, changing the global shape of the spectrum; ii) strong narrowing of the main peak at 5 eV and iii) appearance of bound excitons inside the gap. It turns out that electron-hole attraction reduces the transition energies by about 0.1 eV, determining a global red-shift of the joint density of states (JDOS) (inset of Fig. 1(a)). The absorption onset is now at 2.9 eV (grey arrow in Fig. 1(a)). This implies the formation of a bound exciton in the fundamental gap with a binding energy of about 100 meV, that is larger than the one obtained in standard semiconductors RMP-noi .
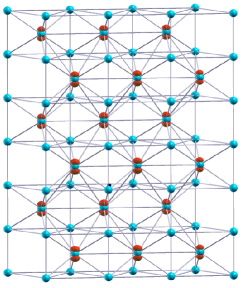
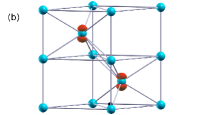
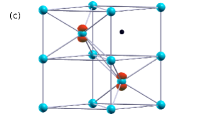
In Fig. 1(b)-(c) we analyse the shape of the wave function corresponding to this bound electron-hole pair. We fix the position of the hole in a particular position and determine the corresponding density distribution of the electron. Our calculation reveals that this bound exciton is, in particular, a charge-transfer exciton. While the hole is created in the vicinity of one corner atom (Fig. 1(b)), the excitation has largely moved the electron charge to localize on the central atoms, forming a separate sub-lattice over many unit cells (see Ref. epaps Fig. 2). Remarkably, the same electronic distribution is obtained even when the hole is located in the interstitial regions (Fig. 1(c)), where the valence electrons accumulate when they are forced away from the atoms nature ; ashcroft2008 . Charge-transfer excitons are typical of ionic insulators like alkali-halide crystals abbamonte . They are intermediate between strongly bound Frenkel and weakly bound Wannier excitons, as they involve the transfer of one electron from a negative ion to a positive ion. In the present case, in particular, the role of the anion is played by the interstitially confined electron gas. In this sense, transparent sodium behaves as an unconventional inorganic electride dye , characterised by the simplest possible anion: an electronic charge without ionic core. The strong enhancement of the peak at around 5 eV, which is the mark of the formation of a resonant exciton, instead is not explained by the simple modification of the transition energies, since the JDOS curves remain very similar. It is rather due to the mixing of a very large number of independent electron-hole transitions in the same energy range (see Ref. epaps Fig. 1), each of them participating with a small contribution to the excitonic peaks. It is the sign of highly correlated excitonic states.
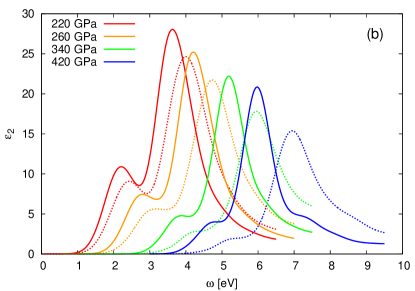
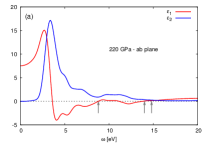
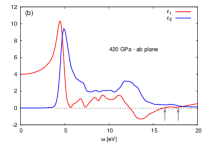
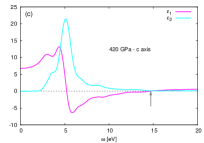
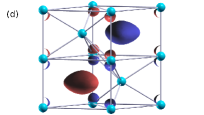
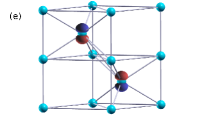
Anisotropy and inhomogeneity.– By comparing the optical spectra obtained with light polarized either along the hexagonal axis or in the perpendicular plane (Fig. 2(a)), we find that the spectra with the two light polarizations remain very different, both with and without the inclusion of excitonic effects. In particular, in the in-plane direction, sodium is completely transparent up to 4.5 eV. In fact, the absorption onset and the first structures in the spectrum in Fig. 1(a) are entirely due to absorption of light polarized along the axis. Also the exciton represented in Fig. 1(b)-1(c) is dark in the in-plane direction. This behaviour can be understood as due to the particular symmetry of the one-particle wave functions involved in the transitions. For instance, by symmetry at the point the transition between the top valence (Fig. 1(d)) and the bottom conduction (Fig. 1(e)) has zero oscillator strength in the in-plane direction. On the other hand, inhomogeneities in the charge distributions are responsible for the so-called crystal local-field effects adler-wiser . In general, an external field can induce spatial charge fluctuations that are rapidly varying on the microscopic scale. It is intuitively clear that the self-consistent response to these induced local fields becomes more important the more the system is inhomogeneous and polarizable. Whereas in the absorption spectra of bulk solids local fields are generally weak RMP-noi , in dense sodium they induce a sizeable effect (see Ref. epaps Fig. 3), particularly for the main peak and axis polarization (while the onset is unaffected). This is a further indication that the charge distribution has become very inhomogeneous.
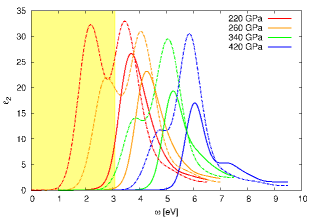
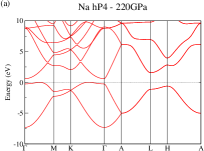
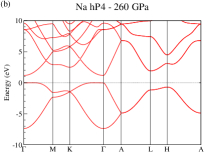
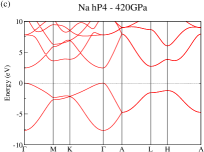
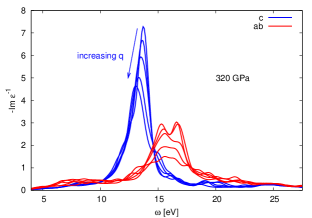
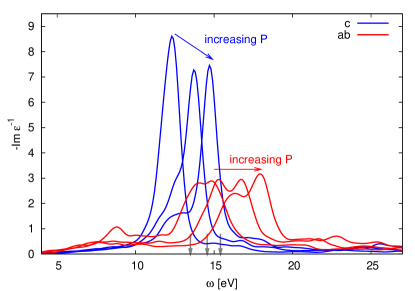
Dependence on the pressure.– The application of increasing pressure induces as a first effect a band gap opening in the quasiparticle band structure nature . As a consequence also the optical spectra move to higher energies (Fig. 2(b)). Moreover, the quasiparticle gap from indirect becomes direct at the point (see Ref. epaps Fig. 5). Additional compression leads to localize more the electronic charge and to reduce the screening of the interaction between the electron and the hole. Both contribute to increase the excitonic effects: the electron and the hole on average stay closer and their effective interaction is stronger. This explains why the largest differences between the spectra with and without electron-hole interaction occur for the spectrum at the highest pressure (Fig. 2(b)). In fact, the static dielectric constant, which we calculate in random-phase approximation (RPA) RMP-noi , decreases with increasing pressure, passing from 18 at 220 GPa to 7 at 420 GPa. In addition, we consider the dynamical screening, , which can be measured by electron-energy loss spectroscopy (EELS) or inelastic x ray scattering (IXS) and which we calculated in time-dependent LDA hansi (with the inclusion of 40 bands). The EELS spectrum, for each momentum transfer (either along the axis or in the perpendicular plane), is characterised by a main structure, which corresponds to the frequency of the collective oscillations of the valence electrons in the system, i.e. plasmons (Fig. 3). These plasmon structures show a small dispersion with the momentum transfer (see Ref. epaps Fig. 6). While detailed features depend on band structure properties, in this case the Drude model is still partially able to track the dependence of the plasmon frequency with the compression. According to the Drude model, the plasmon frequency increases linearly with the square root of the density grosso : . Using this formula at the densities corresponding to the three considered pressures we have 13.5, 14.6 and 15.4 eV (grey arrows in Fig. 3) when we consider only 4 valence electrons in the unit cell. In a way, this corresponds to a definition of “valence” electrons in this extreme situation where the usual view of electrons belonging to a particular atom is no more strictly valid. Being based on a uniform electron gas, the Drude model describes an average behaviour of the dielectric response of the system, but is obviously not able to catch its anisotropy, which leads to the splitting between the plasmons along the axis and in the perpendicular plane (the Drude plasmon energy falls somewhat in the middle). Moreover, at low pressures a smaller further plasmonic structure appears only in the in-plane direction at about 8 eV, which is strongly suppressed by increasing the applied pressure (see Ref. epaps Fig. 7). Both the anisotropy in the lattice structure and the higher-energy localisation of the spectral weight for the in-plane polarization (see Ref. epaps Fig. 7) contribute in the same way to the splitting of the plasmon energies in the two directions.
In conclusion, our first-principle predictions for both absorption and EELS spectra can be indeed used to confirm the crystal structure of this phase of dense transparent sodium. First of all, since the binding energy of the bound exciton is of the order of a hundred of meV, our results for the optical spectra support the hypothesis of Ma et al. nature , which was based only on ground-state and band gap calculations. Moreover, even though ground-state calculations overestimate the pressure value at which the transition to the hP4 phase occurs nature , our predictions for the optical properties are not biased by this error. In fact, while excitonic effects are varying with the applied pressure (and can be influenced by the temperature as well andrea ), from our analysis it turns out that key features of the spectra like the polarization anisotropy are essentially linked to the symmetry of the crystal structure and can be observed in a very large range of pressure (see Ref. epaps Fig. 4). This also implies that sodium becomes transparent in the visible at a lower pressure in one polarization direction while being still “metallic” in the other. Therefore we suggest the measurement of the spectra along the two polarizations as the key test to verify conclusively that transparent sodium crystallizes in the hP4 structure. Photoluminescence would put in evidence the nature of the bound exciton predicted in the present work and that has a low oscillator strength in optics.
We acknowledge fruitful discussions with G. Vignale and F. Sottile and the authors of Ref. nature for sending their relaxed geometries used in the present work. This work was supported by the Spanish MEC (FIS2007-65702-C02-01), “Grupos Consolidados UPV/EHU del Gobierno Vasco” (IT-319-07), the European Union through e-I3 ETSF project (Contract Number 211956). We acknowledge support by the Barcelona Supercomputing Center, “Red Espanola de Supercomputacion”. We have used Abinit abinit , Dp and Exc codes dp-exc .
References
- (1) G. Grosso and G. Pastori-Parravicini, Solid State Physics (Academic, New York, 2000).
- (2) M. I. McMahon et al., Proc. Natl. Acad. Sci. USA 105, 17297 (2007).
- (3) E. Gregoryanz et al., Science 320, 1054 (2008).
- (4) E. Gregoryanz et al., Phys. Rev. Lett. 94, 185502 (2005).
- (5) Y. Ma et al., Nature 458, 182 (2009).
- (6) L. F. Lundegaard et al., Phys. Rev. B 79, 064105 (2009).
- (7) A. Lazicki et al., Proc. Natl. Acad. Sci. USA 106, 6525 (2009).
- (8) J.-Y. Raty, E. Schwegler, and S. A. Bonev, Nature 449, 448 (2007).
- (9) J. B. Neaton and N. W. Ashcroft, Phys. Rev. Lett. 86, 2830 (2001).
- (10) N. E. Christensen, and D. L. Novikov, Solid State Commun. 119, 477 (2001).
- (11) B. Rousseau and N. W. Ashcroft, Phys. Rev. Lett. 101, 046407 (2008).
- (12) N. W. Ashcroft, Nature 458, 158 (2009); Proc. Natl. Acad. Sci. USA 105, 5 (2007).
- (13) G. Onida, L. Reining, and A. Rubio, Rev. Mod. Phys. 74, 601 (2002), and references therein.
- (14) L. Hedin, Phys. Rev. 139, A796 (1965).
- (15) See supplementary information.
- (16) R. W. Godby and R. J. Needs, Phys. Rev. Lett. 62, 1169 (1989).
- (17) P. Abbamonte et al., Proc. Natl. Acad. Sci. USA 105, 12159 (2008).
- (18) J. L. Dye, Science 247, 663 (1990).
- (19) S. L. Adler, Phys. Rev. 126, 413 (1962); N. Wiser, Phys. Rev. 129, 62 (1963).
- (20) H.-C. Weissker et al., Phys. Rev. Lett. 97, 237602 (2006).
- (21) A. Marini, Phys. Rev. Lett. 101, 106405 (2008).
- (22) X. Gonze et al., Z. Kristallogr. 220, 558 (2005); see http://www.abinit.org.
- (23) The DP and EXC codes are developed by the French node of the ETSF; see http://www.dp-code.org and http://www.bethe-salpeter.org.
Supplementary information
| a | c | P |
|---|---|---|
| 2.874 | 4.238 | 220 |
| 2.838 | 4.057 | 260 |
| 2.769 | 3.817 | 340 |
| 2.705 | 3.668 | 420 |