peter.babkevich@physics.ox.ac.uk
Magnetic excitations of Fe1+ySexTe1-x in magnetic and superconductive phases
Abstract
We have used inelastic neutron scattering and muon-spin rotation to compare the low energy magnetic excitations in single crystals of superconducting Fe1.01Se0.50Te0.50 and non-superconducting Fe1.10Se0.25Te0.75. We confirm the existence of a spin resonance in the superconducting phase of Fe1.01Se0.50Te0.50, at an energy of 7 meV and a wavevector of . The non-superconducting sample exhibits two incommensurate magnetic excitations at which rise steeply in energy, but no resonance is observed at low energies. A strongly dispersive low-energy magnetic excitation is also observed in Fe1.10Se0.25Te0.75 close to the commensurate antiferromagnetic ordering wavevector where . The magnetic correlations in both samples are found to be quasi-two dimensional in character and persist well above the magnetic (Fe1.10Se0.25Te0.75) and superconducting (Fe1.01Se0.50Te0.50) transition temperatures.
pacs:
74.70.Xa, 76.50.+g, 61.05.F-, 76.75.+i1 Introduction
Considerable effort has been devoted over the past two years to investigate the basic properties of the Fe-based family of superconductors [1, 2, 3]. A central question is whether magnetism plays an important role in the formation of the superconducting state. A useful strategy to tackle this problem is to combine neutron scattering and muon spin rotation (SR) measurements on one and the same sample. Neutron scattering provides information on magnetic correlations and on the nature of the magnetic excitations, while SR can determine whether static magnetic order and/or bulk superconductivity exists.
The Fe1+ySexTe1-x system is a convenient one to study with this methodology as large high-quality crystals can be grown [4, 5] and the tetragonal crystallographic structure is relatively simple to analyse and model. Single crystals are easier to grow if there is a small excess of Fe (i.e. ), especially for small [6, 7, 8, 9].
The pure FeSe compound is a superconductor with a transition temperature K [6]. The can be increased by partial substitution of Te for Se such that K for and [10, 11]. The application of pressure has also been found to raise , with values as high as 37 K observed for FeSe [12, 13, 14, 15]. Compounds with do not exhibit bulk superconductivity but order magnetically below a temperature which has a maximum of 67 K at and which decreases with and vanishes at . We recently found evidence for coexistence of incommensurate magnetic order and partial superconductivity for [11].
In this study, we present neutron scattering and SR measurements on two single crystal samples: (i) Fe1.01Se0.50Te0.50, a bulk superconductor, and (ii) Fe1.10Se0.25Te0.75, a non-superconducting sample which exhibits magnetic order. In superconducting Fe1.01Se0.50Te0.50 we observe a resonant magnetic excitation consistent with that reported previously in compounds with similar compositions [16, 17, 18, 19]. In Fe1.10Se0.25Te0.75 we observe strongly dispersive, low energy magnetic excitations associated with the magnetic ordering wavevector , , and also with the wavevectors . We find no evidence for a resonance peak in the excitation spectrum of Fe1.10Se0.25Te0.75.
2 Experimental Details
Single crystals of Fe1+ySexTe1-x were grown by a modified Bridgman method as reported by [4]. Neutron scattering measurements were carried out on triple-axis spectrometer TASP [20] at the SINQ [21] spallation source (Paul Scherrer Institut, Switzerland). Bragg reflections from pyrolytic graphite PG(002) monochromator and analyser were used at a fixed final wavevector of 2.66 Å-1. A PG filter was placed after the sample to reduce contamination from higher order harmonics in the beam and the instrument was set up in the open – open – open – open collimation with the analyser focusing in the horizontal plane. The crystals were single rods with masses of approximately 4 g. The Fe1.10Se0.25Te0.75 sample was orientated in two settings to give access to and planes in reciprocal space. Measurements of Fe1.01Se0.50Te0.50 were made in the plane only. In this report we index the reciprocal lattice with respect to the primitive tetragonal unit cell described by the space group with unit cell parameters Å and Å along lines joining the nearest neighbour Fe atoms.
Zero-field-cooled magnetisation measurements were performed on a Quantum Design MPMS magnetometer with a measuring field mT using the direct current method. To reduce the effects of demagnetisation, thin plate-like pieces of Fe1+ySexTe1-x, cleaved from the main single crystals, were oriented with the flat surface ( plane) parallel to the applied field.
Zero-field (ZF) and transverse-field (TF) muon-spin rotation (SR) experiments were performed on the M3 beam line at SS (Paul Scherrer Institut, Switzerland). In TF experiments a magnetic field of 11.8 mT was applied parallel to the crystallographic plane of the crystal and perpendicular to the muon-spin polarisation.
3 Results
3.1 Magnetisation and SR Measurements
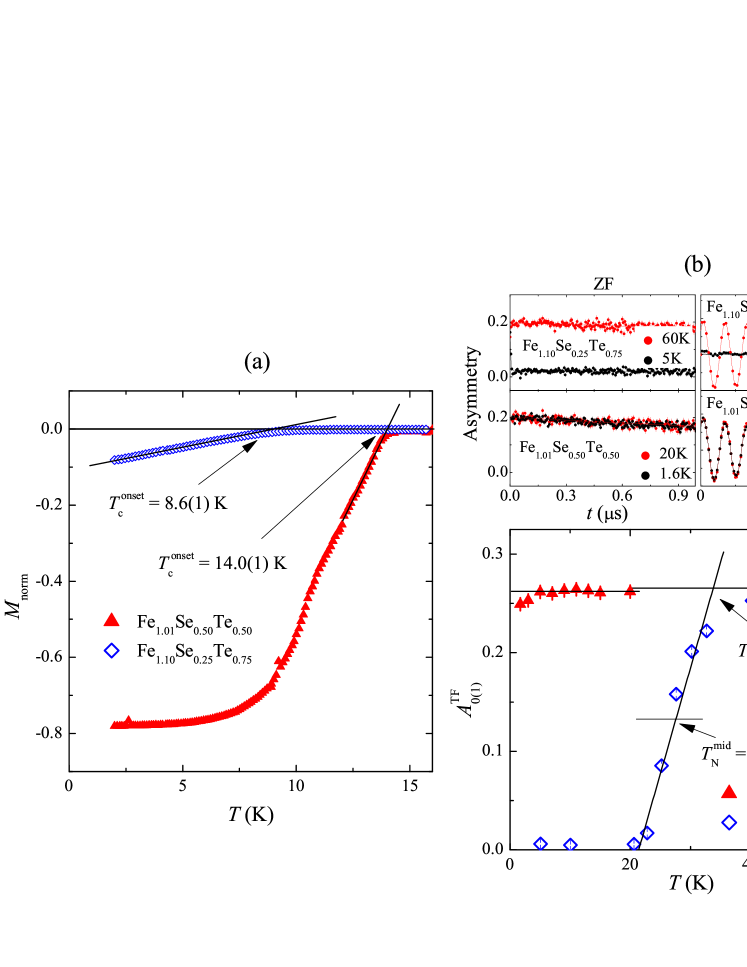
Zero-field-cooled magnetisation data normalised to the ideal value () are shown in figure 1(a). The Fe1.01Se0.50Te0.50 sample is seen to be a bulk superconductor with the onset of the transition K and at K. The Fe1.10Se0.25Te0.75 sample also exhibits superconductivity ( K) but has a small superconducting fraction of order 10% at low temperature.
For the sample, the ZF time-spectra measured at K and 20 K are almost identical thus suggesting that the magnetic state of this sample is the same above and below the superconducting transition temperature. The solid lines correspond to a fit by the function , where is the initial asymmetry and is the exponential relaxation rate. Such behavior is consistent with dilute Fe moments as observed recently for FeSe1-x [22]. The TF data for fit well to the function . Here, MHz/T is the muon gyromagnetic ratio, is the initial phase of the muon-spin ensemble, and is the Gaussian relaxation rate. Figure 1(b) shows that the TF asymmetry is almost temperature independent. The slightly stronger relaxation of the muon-spin polarisation at 1.7 K relative to 20 K is due to formation of the vortex lattice at .
Static (within the SR time window) magnetism develops in Fe1.10Se0.25Te0.75 as signalled by a fast drop of both and within the first 100 ns (see upper panel of figure 1(b)). The solid lines correspond to fits with and . Here, and are the initial ZF (TF) asymmetry and the exponential depolarisation rate of the slow (fast) relaxing component, respectively. The temperature evolution of , shown in figure 1(b), reveals that below 20 K magnetism occupies more than 95% of the whole sample volume. The corresponding values of the onset and the mid-point of the magnetic transitions, determined as shown in the figure, are K and K. We note that although the magnetic order is shown to extend throughout virtually the entire volume of the sample, SR cannot determine whether the magnetic order is long range. The neutron diffraction data presented in the next section show that the magnetic order is in fact relatively short range.
3.2 Neutron Scattering Results
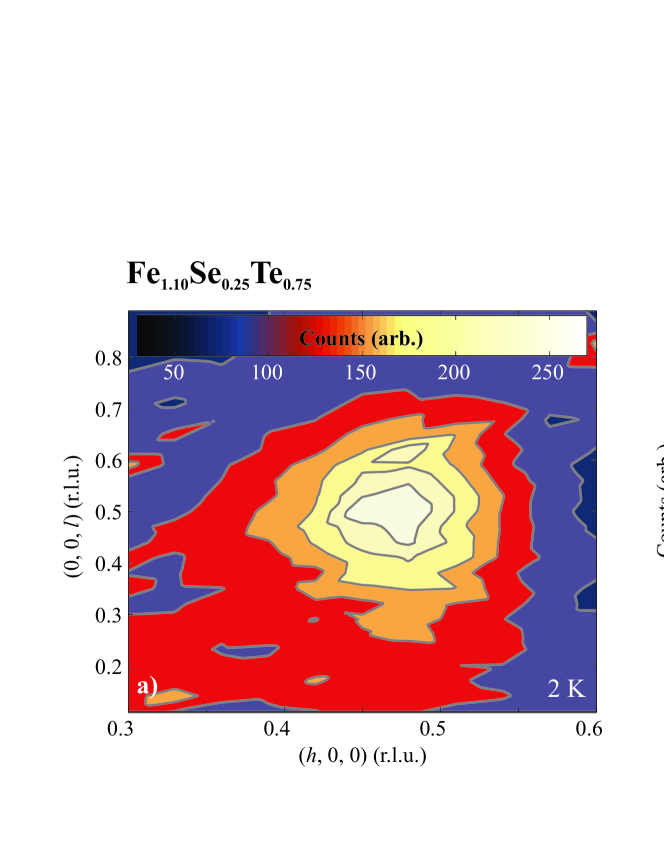
Elastic neutron scattering measurements on Fe1.10Se0.25Te0.75 in the scattering plane at 2 K, as shown in figure 2(a), reveal a diffuse magnetic peak centred on with . The incommensurate peak is much broader than the resolution of the instrument. From scans through the peak we obtain correlation lengths along and axes of 11.4(6) Å and 7.5(4) Å respectively at 2 K. Figure 2(b) shows that the magnetic peak develops below K. The correlation lengths did not change measurably upon warming through the (figure 2(b): inset). The magnetic propagation vector is similar to that found previously for the similar composition Fe1.03Se0.25Te0.75 compound. For the latter compound we confirmed that the peak described by is magnetic in character using neutron polarisation analysis [11]. Our results are consistent with measurements on Fe1.07Se0.25Te0.75 for which the incommensurability is found to be [23].
The magnetic scattering cross-section is directly proportional to the magnetic response function – the Fourier transform of the space- and time-dependent spin–spin correlation function. According to the fluctuation–dissipation theorem, is in turn related to the imaginary part of the dynamical susceptibility by [24]
| (1) |
The Bose–Einstein population factor (where is the Boltzmann constant) takes into account the increase in scattering from bosonic excitations due to thermal population at temperatures . Correction for this factor allows the temperature dependence of to be studied.
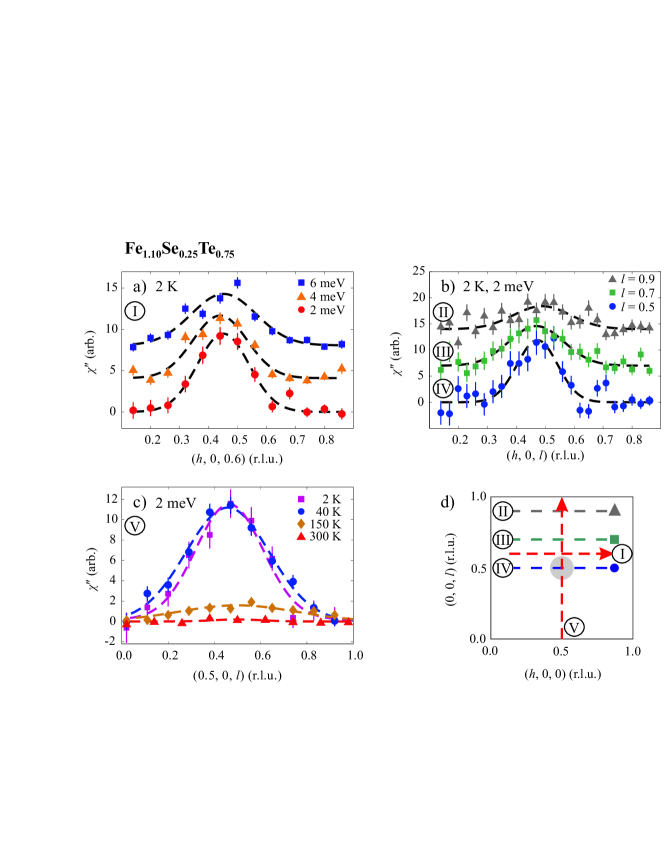
Figure 3(a) shows background corrected scans along the direction at energy transfers of 2, 4 and 6 meV for the Fe1.10Se0.25Te0.75 crystal. A peak at is present in each scan, indicating a strongly dispersing excitation. The broadening of the dispersion in may be due to unresolvable splitting of the mode into two excitations at higher energies. The measured magnetic response at 2 meV parallel to for , 0.7 and 0.9, as shown in figure 3(b), reveals considerable broadening of in the out-of-plane direction. Such broadening is characteristic of a quasi-two-dimensional system with weak interactions along . Figure 3(c) shows that spin fluctuations persist up to at least 150 K, well into the paramagnetic state. At 40 K, i.e. close to the magnetic ordering temperature, is almost the same as at 2 K.
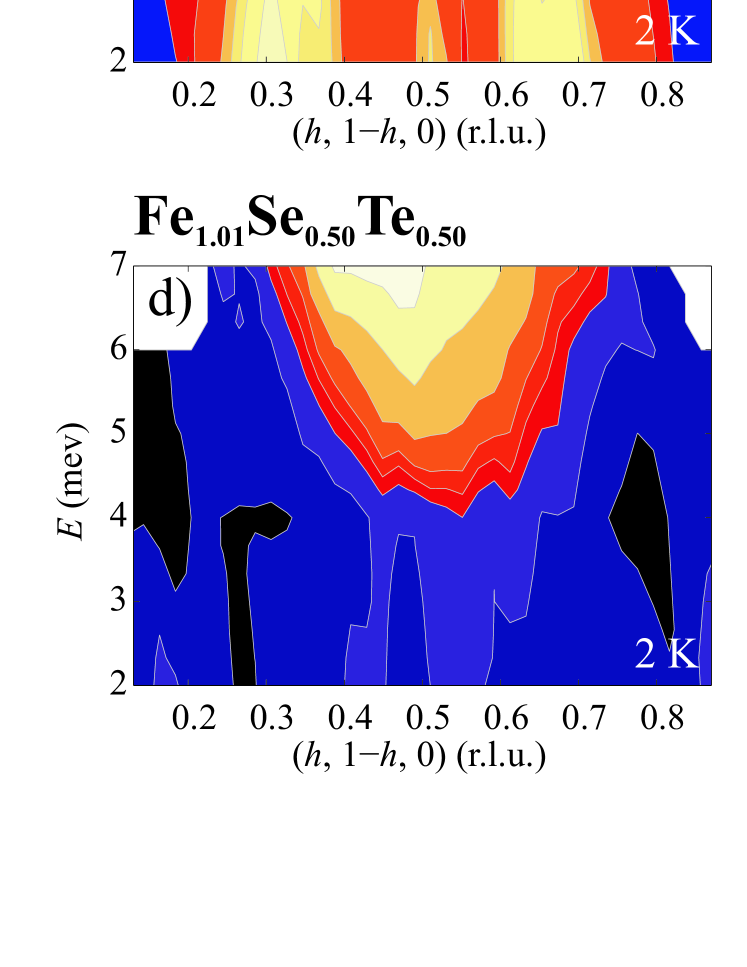
We now turn to the low energy excitation spectrum in the vicinity of the wavevector . Figures 4(a) and (b) show maps of measured along for Fe1.10Se0.25Te0.75 at 2 and 40 K. The fluctuations measured at 2 K are consistent with the magnetic excitation spectrum at higher energies reported for Fe1.03Se0.27Te0.73 [25]. The excitation spectrum at 2 K is characterised by steep incommensurate branches arising from where . The incommensurate excitation are still present at 40 K. The scans shown in figure 4(c) reveal that at meV, the system response is nearly the same at 2 K as at 40 K. The background corrected for the Fe1.10Se0.25Te0.75 sample does not appear to change for energies in the 2 to 7 meV range measured at these temperatures. This is also the case for measurements along in figure 3(c) that show data at 2 meV to be similar at 2 and 40 K.
The results obtained for Fe1.01Se0.50Te0.50 are in stark contrast to those of the non-superconducting Fe1.10Se0.25Te0.75 sample just described. Figures 4(d) and 4(e) show maps of the magnetic spectrum as a function of wavevector along for energies between 2 meV and 7 meV at 2 and 40 K. At 2 K we find a strong signal in centred on and meV. This feature corresponds to the spin resonance reported previously in superconducting FeSe0.4Te0.6 [16], FeSe0.46Te0.54 [18] and FeSe0.5Te0.5 [19]. At higher energies, the excitations have been found to disperse away from along [18]. However, it is the low energy response of the system which shows the most dramatic change on transition into the superconducting state, as may be seen in figure 4(f). As the sample is cooled from 40 K to 2 K, the integrated dynamical susceptibility of the peak at 7 meV increases by more than a factor of 2 and decreases in width along by %. Fluctuations continue to be observed well above .
4 Discussion
In combination with earlier measurements, the results presented here establish that the low-energy magnetic dynamics of Fe1+ySexTe1-x vary strongly with . The magnetic spectra of the magnetically-ordered compound () and the bulk superconductor () both contain low-energy magnetic fluctuations in the vicinity of the antiferromagnetic wavevector . However, at the fluctuations are incommensurate with wavevector , , whereas at the strongest magnetic signal is commensurate. Moreover, at the magnetic spectrum has a gap of meV and the size of the signal just above the gap increases strongly at low temperatures. This behaviour is consistent with the superconductivity-induced spin resonance reported recently in bulk superconducting samples of Fe1+ySexTe1-x of similar composition to ours [16, 17, 18, 19], and also in related Fe pnictide superconductors [26, 27, 28, 29, 30].
A further difference is that the sample exhibits short-range, static (within the SR time window) magnetic order with a characteristic wavevector , , whereas according to our SR data there is no static magnetic order in the bulk superconductor. The magnetic ordering wavevector found at is the same as that in the parent phase Fe1+yTe. The slight incommensurability is thought to be caused by the small excess of Fe accommodated in interstitial sites in the crystal structure [8, 31, 32], although it is interesting that the incommensurability is the same to within experimental error at (the present sample) and at (the sample studied by us previously [11]).
Our results suggest that there are two distinct magnetic ordering tendencies at , one with wavevector and the other with wavevector . The SR data indicate that the volume fraction of magnetically ordered phase is close to 100%, but we cannot say whether the two characteristic magnetic correlations coexist on an atomic scale or whether the sample is magnetically inhomogeneous.
Finally, we comment on the fact that in the sample diffuse peaks are observed in the elastic (within energy resolution) channel below K by neutron scattering but static magnetic order is only detected below K by SR. These observations can be reconciled by the difference in the fluctuation rates observable by muons ( GHz) and neutrons ( THz) below which spin freezing is measured. We infer from this that the characteristic fluctuations of the spin system lie between GHz and THz for 35 K 50 K. Such a gradual slowing down of the fluctuations could be a consequence of the quasi-two-dimensional nature of the spin system, which is also indicated by the persistence of spin correlations to temperatures well above the ordered phase. It is also interesting that the size of the magnetically ordered domains does not significantly increase with decreasing temperature, which suggests that the short-range order is never truly static but fluctuates down to the lowest temperature investigated. This picture is consistent with the recent observation of spin-glass behaviour in Fe1.1SexTe1-x for [33].
5 Conclusion
We have observed a resonance-like peak at the antiferromagnetic wavevector in the low-energy magnetic spectrum of Fe1.01Se0.50Te0.50, and shown that this feature is absent from the magnetic spectrum of Fe1.10Se0.25Te0.75 which instead shows incommensurate peaks flanking . Our results reveal a clear distinction between the magnetic excitation spectra of Fe1+ySexTe1-x samples which are magnetically ordered and those which are bulk superconductors. We conclude that the existence of a resonance peak at the commensurate antiferromagnetic wavevector is a characteristic of bulk superconductivity in Fe1+ySexTe1-x.
References
References
- [1] K. Ishida, Y. Nakai, and H. Hosono. J. Phys. Soc. Japan, 78(6):062001, 2009.
- [2] J. W. Lynn and P. Dai. Physica C, 469(9-12):469–476, 2009.
- [3] M. R. Norman. Phys., 1:21, 2008.
- [4] B. C. Sales, A. S. Sefat, M. A. McGuire, R. Y. Jin, D. Mandrus, and Y. Mozharivskyj. Phys. Rev.B, 79(9):094521–5, 2009.
- [5] G. F. Chen, Z. G. Chen, J. Dong, W. Z. Hu, G. Li, X. D. Zhang, P. Zheng, J. L. Luo, and N. L. Wang. Phys. Rev.B, 79(14):140509–4, 2009.
- [6] F.-C. Hsu, J.-Y. Luo, K.-W. Yeh, T.-K. Chen, T.-W. Huang, P. M. Wu, Y.-C. Lee, Y.-L. Huang, Y.-Y. Chu, D.-C. Yan, and M.-K. Wu. Proc. Natl. Acad. Sci., 105(38):14262–14264, 2008.
- [7] F. Grnvold, H. Haraldsen, and J. Vihovde. Acta Chem. Scand., 8:1927–1942, 1954.
- [8] W. Bao, Y. Qiu, Q. Huang, M. A. Green, P. Zajdel, M. R. Fitzsimmons, M. Zhernenkov, S. Chang, M. H. Fang, B. Qian, E. K. Vehstedt, J. H. Yang, H. M. Pham, L. Spinu, and Z. Q. Mao. Phys. Rev. Lett., 102(24):247001, 2009.
- [9] K. W. Yeh, C. T. Ke, T. W. Huang, T. K. Chen, Y. L. Huang, P. M. Wu, and M. K. Wu. Cryst. Growth Des., 9(11):4847–4851, 2009.
- [10] M. H. Fang, H. M. Pham, B. Qian, T. J. Liu, E. K. Vehstedt, Y. Liu, L. Spinu, and Z. Q. Mao. Phys. Rev.B, 78(22):224503, 2008.
- [11] R. Khasanov, M. Bendele, A. Amato, P. Babkevich, A. T. Boothroyd, A. Cervellino, K. Conder, S. N. Gvasaliya, H. Keller, H. H. Klauss, H. Luetkens, V. Pomjakushin, E. Pomjakushina, and B. Roessli. Phys. Rev.B, 80(14):140511–4, 2009.
- [12] S. Margadonna, Y. Takabayashi, Y. Ohishi, Y. Mizuguchi, Y. Takano, T. Kagayama, T. Nakagawa, M. Takata, and K. Prassides. Phys. Rev.B, 80(6):064506, 2009.
- [13] Y. Mizuguchi, F. Tomioka, S. Tsuda, T. Yamaguchi, and Y. Takano. Appl. Phys. Lett., 93(15):152505–3, 2008.
- [14] S. Medvedev, T. M. McQueen, I. A. Troyan, T. Palasyuk, M. I. Eremets, R. J. Cava, S. Naghavi, F. Casper, V. Ksenofontov, G. Wortmann, and C. Felser. Nat. Mater., 8(8):630–633, 2009.
- [15] G. Garbarino, A. Sow, P. Lejay, A. Sulpice, P. Toulemonde, M. Mezouar, and M. Nunez-Regueiro. Europhys. Lett., 86(2):27001, 2009.
- [16] Y. Qiu, W. Bao, Y. Zhao, C. Broholm, V. Stanev, Z. Tesanovic, Y. C. Gasparovic, S. Chang, J. Hu, B. Qian, M. H. Fang, and Z. Q. Mao. Phys. Rev. Lett., 103(6):067008–4, 2009.
- [17] S. Iikubo, M. Fujita, S. Niitaka, and H. Takagi. J. Phys. Soc. Japan, 78(10):103704, 2009.
- [18] D.N. Argyriou, A. Hiess, A. Akbari, I. Eremin, M.M. Korshunov, J. Hu, B. Qian, Z. Q. Mao, Y. Qiu, C. Broholm, and W. Bao. arXiv:0911.4713v1, 2009.
- [19] H. A. Mook, M. D. Lumsden, A. D. Christianson, S. E. Nagler, B. C. Sales, R. Jin, M. A. McGuire, A. S. Sefat, D. Mandrus, T. Egami, and C. de la Cruz. arXiv:0911.5463v2, 2009.
- [20] F. Semadeni, B. Roessli, and P. Böni. Physica B, 297(1-4):152–154, 2001.
- [21] W. E. Fischer. Physica B, 234-236:1202–1208, 1997.
- [22] R. Khasanov, K. Conder, E. Pomjakushina, A. Amato, C. Baines, Z. Bukowski, J. Karpinski, S. Katrych, H. H. Klauss, H. Luetkens, A. Shengelaya, and N. D. Zhigadlo. Phys. Rev.B, 78(22):220510, 2008.
- [23] J. Wen, G. Xu, Z. Xu, Z. W. Lin, Q. Li, W. Ratcliff, G. Gu, and J. M. Tranquada. Phys. Rev.B, 80(10):104506–4, 2009.
- [24] G. Shirane. Neutron scattering with a triple-axis spectrometer: basic techniques. Cambridge: Cambridge University Press, 2002.
- [25] M. D. Lumsden, A. D. Christianson, E. A. Goremychkin, S. E. Nagler, H. A. Mook, M. B. Stone, D. L. Abernathy, T. Guidi, G. J. MacDougall, C. de la Cruz, A. S. Sefat, M. A. McGuire, B. C. Sales, and D. Mandrus. Nat. Phys., 6:182–186, 2010.
- [26] A. D. Christianson, E. A. Goremychkin, R. Osborn, S. Rosenkranz, M. D. Lumsden, C. D. Malliakas, I. S. Todorov, H. Claus, D. Y. Chung, M. G. Kanatzidis, R. I. Bewley, and T. Guidi. Nature, 456(7224):930–932, 2008.
- [27] M. D. Lumsden, A. D. Christianson, D. Parshall, M. B. Stone, S. E. Nagler, G. J. MacDougall, H. A. Mook, K. Lokshin, T. Egami, D. L. Abernathy, E. A. Goremychkin, R. Osborn, M. A. McGuire, A. S. Sefat, R. Jin, B. C. Sales, and D. Mandrus. Phys. Rev. Lett., 102(10):107005, 2009.
- [28] S. Chi, A. Schneidewind, J. Zhao, L. W. Harriger, L. Li, Y. Luo, G. Cao, Z. Xu, M. Loewenhaupt, J. Hu, and P. Dai. Phys. Rev. Lett., 102(10):107006, 2009.
- [29] S. Li, Y. Chen, S. Chang, J. W. Lynn, L. Li, Y. Luo, G. Cao, Z. Xu, and P. Dai. Phys. Rev.B, 79(17):174527, 2009.
- [30] D. S. Inosov, J. T. Park, P. Bourges, D. L. Sun, Y. Sidis, A. Schneidewind, K. Hradil, D. Haug, C. T. Lin, B. Keimer, and V. Hinkov. Nat. Phys., 6:178–181, 2010.
- [31] C. Fang, B. A. Bernevig, and J. Hu. Europhys. Lett., 86(6):67005, 2009.
- [32] F. Ma, W. Ji, J. Hu, Z.-Y. Lu, and T. Xiang. Phys. Rev. Lett., 102(17):177003–4, 2009.
- [33] P. L. Paulose, C. S. Yadav, and K. M. Subhedar. arXiv:0907.3513v1, 2009.