2 Max Planck Institute for Mathematics in the Sciences, Leipzig, Germany
{boldhaus,klemm}@bioinf.uni-leipzig.de,
{bertschi,jrauh,olbrich}@mis.mpg.de
%****␣paper81.tex␣Line␣50␣****http://www.bioinf.uni-leipzig.de
http://www.mis.mpg.de
Knockouts, Robustness and Cell Cycles
Abstract
The response to a knockout of a node is a characteristic feature of a networked dynamical system. Knockout resilience in the dynamics of the remaining nodes is a sign of robustness. Here we study the effect of knockouts for binary state sequences and their implementations in terms of Boolean threshold networks. Beside random sequences with biologically plausible constraints, we analyze the cell cycle sequence of the species Saccharomyces cerevisiae and the Boolean networks implementing it. Comparing with an appropriate null model we do not find evidence that the yeast wildtype network is optimized for high knockout resilience. Our notion of knockout resilience weakly correlates with the size of the basin of attraction, which has also been considered a measure of robustness.
Keywords:
Linear Threshold Network, Yeast, Cell Cycle, Knockouts, Robustness1 Introduction
Living systems show an ubiquitous robustness against mutations, environmental changes and intrinsic non-determinism [1, 2, 3]. In particular, each single cell must control its growth and eventual division by regulating concentrations of proteins in a precise temporal pattern. Using a Boolean state dynamics [4], this cell cycle network has been argued to be robustly designed for budding yeast as a model organism [5]. The robustness has been pinpointed as reproducibility of the dynamics in the presence of stochastic perturbations [5, 6, 7]. Resilience against mutations, i.e. changes of the interactions among the proteins, has been studied as well [5, 8, 9].
A particular type of mutation, either intrinsic or by intervention, is a complete knockout of a single protein. Knockouts are a type of component failure often used in experiments to probe cellular functions. A gene is made dysfunctional such that it is no longer transcribed and its product is effectively removed from the cell. Some knockouts can be tolerated or compensated by the cell, whereas others are lethal. Knockouts are often used to infer the function of specific proteins. This is only appropriate, if the knockout is neither lethal nor fully compensated, but disables a specific function of the cell. Importantly in real experiments, knockout resilient systems are more difficult to analyze and identify because knockout mutants do not exhibit measurable difference.
In this contribution we study the resilience against knockouts in two scenarios. First, the system under consideration is defined only by a sequence of activation patterns regardless of the specific mechanism producing them (“black box”). Here, resilience with respect to knockout of a node means that the information contained in the activation patterns of all other nodes is still sufficient to unambiguously produce the original sequence. In the second scenario, we consider the sequence together with a given implementation by a Boolean threshold network. Knocking out node means that we remove its interactions with the other nodes. The network is resilient against this knockout if all other nodes still perform the original sequence of activation patterns.
After defining these notions of knockouts and resilience we apply them to the yeast cell cycle sequence and its network implementations. Significance of the results is assessed by comparison of random sequences as null models with various constraints.
2 Defining knockouts and robustness
Molecular processes within cells are frequently modeled by Boolean networks [4, 10, 11]. The nodes of the network correspond to different molecules which can be present in either high or low concentrations. Interactions between the molecules change these concentrations which leads to dynamics in discrete time steps of switching events. The dynamics is thus described as a temporal sequence of activation patterns , where each activation pattern has binary components , . Low and high concentration of molecule at time are denoted by and , respectively. Each node computes a Boolean function mapping the present concentration pattern to its activation at the next time step, i.e. .
2.1 Robustness of function
Let us first define what we mean by robustness of a single node against knockout of another node . We assume that the input nodes follow a certain dynamics , where . The set of possible activation patterns which the input takes is called the input support. It can be represented as a set of binary strings of length .
Node is robust against knockout of node if follows the same sequence even without the presence of node . This means that the state information of node is either irrelevant for or already contained in the other available inputs.
Definition: A node with mapping is robust against knockout of node if is independent of given . With this we mean that
| (1) |
whenever both and lie in the input support. Robustness against simultaneous knockout of multiple nodes is defined in a similar fashion.
It is important to note that this definition depends on the input support. If the input takes each possible value, then robustness against knockout of node implies that does not depend on . However, if the inputs are highly correlated, then nontrivial robustness may appear: For example, it may be possible that can compensate the knockout of a single input by reconstructing the missing information from another input with similar dynamics, but the simultaneous knockout of both inputs leads to a failure.
Our notion of knockout robustness is based on ideas of Ay and Krakauer [12]. Within the framework defined there [12], resilience means that the exclusion dependence of the system with respect to certain knockouts vanishes. Combinatorial conditions characterizing this situation have been found by Herzog et al. [13]. The theory becomes much simpler in the present setting restricted to deterministic dynamics.
Our definition of robustness can be applied to each node of the cell cycle network shown in Figure 1. In our studies of the yeast cell cycle the input support will be the set of activation patterns which appear in this cycle. We then study each node mapping and ask, which inputs are “essential” for the functioning of this node and which inputs can be compensated.
In order to study robustness of the system as a whole there are multiple possibilities: As a measure of system robustness we count the number of nodes which are robust with respect to all single node knockouts, i.e. how many nodes would remain functional if any one input would be knocked out. Another possibility is to find the knockouts under which the behavior of the whole system is robust. In this case we find the single node knockouts which can be compensated by all (other) nodes of the network. The set of these knockouts is called the resilience combination. The cardinality of the resilience combination is then used as a measure of knockout resilience.
2.2 Linear threshold networks and robustness of implementation
The analysis presented up to now just uses properties of the sequence of node activations and thus cannot distinguish between different protein interaction networks implementing this sequence. In order to apply our notion of robustness to example systems and investigate the effects of specific network structures we focus on linear threshold networks. Such a network is given as a directed graph among nodes with weighted edges. We allow loops, i.e. edges starting and ending at the same node. For simplicity we only allow weights and for each directed edge . If there is no edge from node to node we write . To each node we associate a time-dependent variable with dynamics given by
| (2) |
It is possible to refine this model by allowing more values for the edge weights. Furthermore it is customary to introduce threshold parameters for every node. Then the dynamics is determined by comparing to this threshold. In this work we do not make use of these possibilities and restrict ourselves to the simple model.
One important feature of the definition of robustness on page 2.1 is that it only depends on the values of the functions on the support. If we apply this definition to a Boolean network then, in a sense, the mechanisms at work are ignored, and only the sequence of activation patterns given by the dynamics plays a role. Therefore we will call this robustness of function.
In the context of linear threshold models we can define a related notion of robustness, which we will call robustness of implementation: A knockout of a node is modeled by removing a node from the network, together with all of the edges involving this node. We can then analyze the dynamics of the changed network and compare it to the dynamics of the unperturbed network. If the dynamics of the remaining nodes is not changed, then we say that the implementation can compensate the knockout of node . This notion allows to compare different linear threshold networks which implement the same activation sequence with respect to their knockout resilience.
3 Analysis of the yeast cell cycle
| Time |
CLN3 |
MBF |
SBF |
CLN1,2 |
CLB5,6 |
CLB1,2 |
MCM1 |
CDC20 |
SWI5 |
SIC1 |
CDH1 |
Phase |
|---|---|---|---|---|---|---|---|---|---|---|---|---|
| 1 | 1 | 0 | 0 | 0 | 0 | 0 | 0 | 0 | 0 | 1 | 1 | START |
| 2 | 0 | 1 | 1 | 0 | 0 | 0 | 0 | 0 | 0 | 1 | 1 | |
| 3 | 0 | 1 | 1 | 1 | 0 | 0 | 0 | 0 | 0 | 1 | 1 | |
| 4 | 0 | 1 | 1 | 1 | 0 | 0 | 0 | 0 | 0 | 0 | 0 | |
| 5 | 0 | 1 | 1 | 1 | 1 | 0 | 0 | 0 | 0 | 0 | 0 | |
| 6 | 0 | 1 | 1 | 1 | 1 | 1 | 1 | 0 | 0 | 0 | 0 | |
| 7 | 0 | 0 | 0 | 1 | 1 | 1 | 1 | 1 | 0 | 0 | 0 | |
| 8 | 0 | 0 | 0 | 0 | 0 | 1 | 1 | 1 | 1 | 0 | 0 | |
| 9 | 0 | 0 | 0 | 0 | 0 | 1 | 1 | 1 | 1 | 1 | 0 | |
| 10 | 0 | 0 | 0 | 0 | 0 | 0 | 1 | 1 | 1 | 1 | 0 | |
| 11 | 0 | 0 | 0 | 0 | 0 | 0 | 0 | 1 | 1 | 1 | 1 | |
| 12 | 0 | 0 | 0 | 0 | 0 | 0 | 0 | 0 | 1 | 1 | 1 | |
| 13 | 0 | 0 | 0 | 0 | 0 | 0 | 0 | 0 | 0 | 1 | 1 | Stat. |
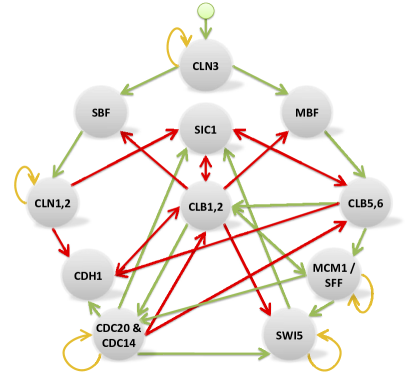
For the analysis the model describing the cell cycle of the yeast species Saccharomyces cerevisiae, introduced by Li et al. [5], is used. It consists of nodes (see Figure 1) which represent four different classes of molecules (cyclins transcription factors and the inhibitors, degraders, and competitors of the cyclin complexes). Those molecules are involved in the control of the cell cycle process and act as key regulators.
3.1 Robustness of function
We now apply the ideas of section 2.1 to the yeast cell cycle. Starting with the system robustness we find that only the four nodes CLN3, CLN1,2, CLB5,6 and CDC20 are robust against all single node knockouts111For CLN3 this is trivial since it corresponds to the constant map .. Regarding the knockout resilience the cell cycle still functions correctly if any one of the five nodes MBF, SBF, MCM1/SFF, SWI5 or CDH1 is knocked out.
We can now ask whether these findings are a special property of the cell cycle or rather expected for a support containing out of possible sequences. In order to answer this question we need to define a null model of sequences which corresponds to a cell cycle. A distinguished feature of the cell cycle is that it can be triggered by a single signal protein, i.e. the first and last activation pattern only differs by the activity of a single node. As a first test we generated random activation sequences of nodes where each node is active with probability . The initial activations were taken as the last activation pattern with a change in a single node activation. Cycles containing repeated node activation patterns were discarded and redrawn.
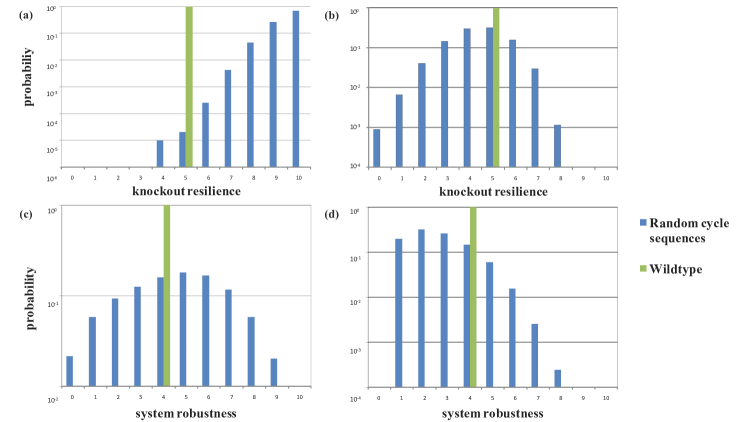
Figure 2 (a) shows the fraction of random cycles with a certain knockout resilience. The five nodes of the yeast cell cycle are untypical compared to this null model, i.e. the yeast can compensate less knockouts than expected. The system robustness of the random cycles is shown in Figure 2 (c). With respect to this measure the four robust nodes of the yeast cell cycle are rather typical.
Does this mean that the yeast cell cycle is not particularly robust against knockouts? A closer look at the cell cycle reveals that its activation pattern is far from random. Another null model which more closely resembles the observed activation pattern is based on the following properties:
-
•
CLN3 acts as an input node. Its activation starts the cycle and it remains silent throughout the sequence.
-
•
The other nodes do not switch their activations randomly during the cycle, but are activated and inactivated exactly once during the cycle. Their activity (or inactivity) is therefore constrained to a block of successive time steps.
Therefore we consider a second null model of random cycles obeying these two properties. Each node, except node CLN3 with a fixed sequence, switches its activation at two randomly drawn time steps within the cycle. As before, cycles with repeated activation patterns were discarded.
Figure 2 and show the robustness and knockout resilience for random cycles from this null model. Now the yeast cell cycle shows typical values for both considered statistics. This suggests that the yeast cell might not be optimized for high robustness and knockout resilience, but just happens to exhibit these properties due to purely statistical reasons.
3.2 Robustness of implementation
| Number | Wildtype component | All components |
CLN3 |
MBF |
SBF |
CLN1,2 |
CLB5,6 |
CLB1,2 |
MCM1 |
CDC20 |
SWI5 |
SIC1 |
CDH1 |
# Knockouts |
|---|---|---|---|---|---|---|---|---|---|---|---|---|---|---|
| 1 | 5,13E+25 | 5,07E+34 | 0 | |||||||||||
| 2 | 3,98E+24 | 2,59E+31 | 1 | |||||||||||
| 3 | 6,22E+23 | 1,50E+31 | 1 | |||||||||||
| 4 | 6,22E+23 | 1,50E+31 | 1 | |||||||||||
| 5 | 1,77E+31 | 1 | ||||||||||||
| 6 | 2,24E+29 | 2 | ||||||||||||
| 7 | 3,15E+32 | 1 | ||||||||||||
| 8 | 9,67E+28 | 2 | ||||||||||||
| 9 | 9,67E+28 | 2 | ||||||||||||
| 10 | 3,52E+27 | 2 | ||||||||||||
| 11 | 4,63E+22 | 9,62E+27 | 2 | |||||||||||
| 12 | 3,51E+27 | 2 | ||||||||||||
| 13 | 4,63E+22 | 9,62E+27 | 2 | |||||||||||
| 14 | 8,87E+25 | 3 | ||||||||||||
| 15 | 8,87E+25 | 3 | ||||||||||||
| 16 | 1,28E+29 | 2 | ||||||||||||
| 17 | 9,12E+20 | 3,22E+24 | 3 | |||||||||||
| 18 | 2,44E+22 | 4 | ||||||||||||
| 19 | 6,25E+23 | 3 | ||||||||||||
| 20 | 2,79E+25 | 3 | ||||||||||||
| 21 | 1,74E+22 | 8,04E+27 | 2 | |||||||||||
| 22 | 2,79E+25 | 3 | ||||||||||||
| 23 | 4,82E+25 | 3 | ||||||||||||
| 24 | 4,95E+21 | 4 | ||||||||||||
| Sum | 5,66E+25 | 5,11E+34 |
| Knockout Resilience | Wildtype Component | All Components |
|---|---|---|
| 0 | 1663,44 | 1447,42 |
| 1 | 1629,86 | 1485,06 |
| 2 | 1675,99 | 1513,21 |
| 3 | 1779,22 | 1588,93 |
| 4 | 1594,82 |
To further understand to what extent knockout resilience played a role for the evolutionary design of the cell cycle, we investigated its implementation as linear threshold networks. For the knockout experiment we looked at all networks which are capable of reproducing the cell cycle sequence (see Table 1). The set of all such networks can be considered as the set of vertices of the neutral graph. Two networks are then connected by an undirected edge if they differ by a single mutation. In our case a mutation corresponds to a addition or deletion of an edge or the change of a weight in the interaction network [9, 14].
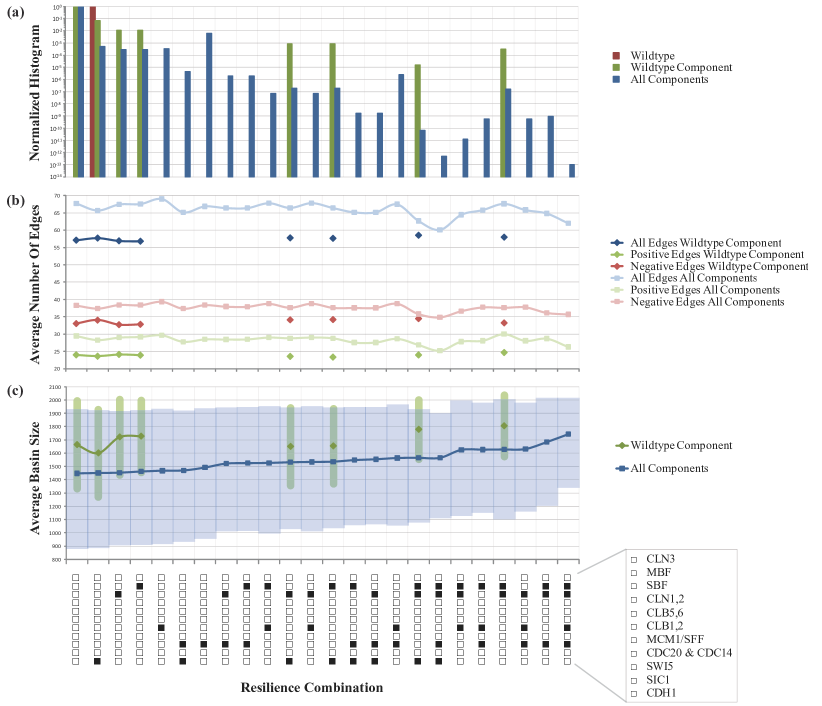
As shown in [9] the neutral graph decomposes into many different connected components. This is why we compare the wildtype network with the wildtype component as well as the whole neutral graph. For each network we checked if each possible single node knockout is changing the cell cycle sequence (see Table 1) or if it has no influence on it. We found different occurring resilience combinations. Out of these only eight were found in the component where the wildtype is situated (see Table 2).
The majority of networks, i.e. of all the functional networks of the neutral graph and of the networks in the wildtype component, cannot cope with any single node knockout. However, a maximum of four independent single node knockouts were found. The wildtype itself is found to be only capable of coping with the single node knockout of the node CDH1, see Figure 3 and networks reachable by a mutational path from the wildtype can manage at maximum three independent knockouts.
One might speculate that high knockout resilience requires redundant wiring of the network which would be observable as an increased edge density. In Figure 3 we look at the distribution of the number of positive, negative and all edges for the different resilience combinations. There is no clear correlation between the average number of edges and the knockout resilience.
As suggested by Li et al. [5], the basin of attraction of the G1 fixed point (stationary state) is a measure of robustness. The basin consists of all activation patterns from which the G1 state is eventually reached by following the dynamics (2). The average basin size of networks with a given resilience combination is shown in Figure 3 . In Table 3 the average basin size for the different knockout resiliences is shown. With an increasing capability to cope with more single node knockouts the average basin size increases. Additionally, average basins sizes in the wildtype component are larger then their corresponding basin sizes in all components. However, all network implementations in the wildtype component have a network resilience of at most three.
4 Discussion
We have studied dynamics with Boolean state vectors (activation patterns) under knockout of single components, being the nodes of an underlying network. The yeast wildtype network is not optimized for knockout resilience, given the sequence of activation patterns. There are networks with significantly larger knockout resilience implementing the same sequence.
Finally, we stress that our definition of resilience checks whether a node is dispensable for integrating and transmitting information only in the context of the regulatory network we consider. This regulatory network is far from being a complete description of cell function. In reality, therefore, the considered node may be involved in other functions and indispensable for survival thereby further reducing the knockout resilience.
Acknowledgments.
This work was supported by the Volkswagenstiftung. We are grateful to Nihat Ay for useful comments.
References
- [1] Elowitz, M.B., Levine, A.J., Siggia, E.D., Swain, P.S.: Stochastic gene expression in a single cell. Science (New York, N.Y.) 297(5584) (2002) 1183–6
- [2] Kitano, H.: Biological robustness. Nature reviews. Genetics 5(11) (2004) 826–37
- [3] Wagner, A.: Robustness and Evolvability in Living Systems. Princeton University Press (2005)
- [4] Kauffman, S.: Metabolic stability and epigenesis in randomly constructed genetic nets. Journal of Theoretical Biology 22(3) (Mar 1969) 437–467
- [5] Li, F., Long, T., Lu, Y., Ouyang, Q., Tang, C.: The yeast cell-cycle network is robustly designed. Proceedings of the National Academy of Sciences of the United States of America 101(14) (2004) 4781–6
- [6] Braunewell, S., Bornholdt, S.: Superstability of the yeast cell-cycle dynamics: Ensuring causality in the presence of biochemical stochasticity. Journal of Theoretical Biology 245(4) (2007) 638 – 643
- [7] Lee, W.B., Huang, J.Y.: Robustness and topology of the yeast cell cycle Boolean network. FEBS letters 583(5) (2009) 927–32
- [8] Lau, K.Y., Ganguli, S., Tang, C.: Function constrains network architecture and dynamics: A case study on the yeast cell cycle Boolean network. Physical Review E 75(5) (Mai 2007) 1–9
- [9] Boldhaus, G., Klemm, K.: Regulatory networks and connected components of the neutral space. (2009)
- [10] Davidich, M.I., Bornholdt, S.: Boolean network model predicts cell cycle sequence of fission yeast. PLoS ONE 3(2) (2008) e1672
- [11] Albert, I., Thakar, J., Li, S., Zhang, R., Albert, R.: Boolean network simulations for life scientists. Source code for biology and medicine 3 (Januar 2008) 16
- [12] Ay, N., Krakauer, D.C.: Geometric robustness theory and biological networks. Theory in Biosciences 125(2) (2007) 93 – 121
- [13] Herzog, J., Hibi, T., Hreinsd ttir, F., Kahle, T., Rauh, J.: Binomial edge ideals and conditional independence statements. Advances in Applied Mathematics (2010) – In Press, Corrected Proof.
- [14] Schuster, P., Fontana, W., Stadler, P.F., Hofacker, I.L.: From sequences to shapes and back: A case study in RNA secondary structures. Proc. Roy. Soc. Lond. B 255 (1994) 279–284