LITHIUM AND PROTON-CAPTURE ELEMENTS IN GLOBULAR CLUSTER DWARFS:
THE CASE OF 47 TUC
Abstract
Previous surveys in a few metal-poor globular clusters (GCs) showed that the determination of abundances for Li and proton-capture elements offers a key tool to address the intracluster pollution scenario. In this Letter, we present Na, O, and Li abundances in a large sample of dwarf stars in the metal-rich GC 47 Tucanae. We found a clear NaO anticorrelation, in good agreement with what obtained for giant members by Carretta et al. While lithium and oxygen abundances appear to be positively correlated with each other, there is a large scatter, well exceeding observational errors, and no anticorrelation with sodium. These findings suggest that Li depletion, due to mechanisms internal to the stars (which are cooler and more metal-rich than those on the Spite plateau) combines with the usual pollution scenario, responsible for the NaO anticorrelation.
Subject headings:
globular clusters: individual (NGC 104) – Stars: abundances – stars: individual (Population II)1. Introduction
The traditional paradigm of globular clusters (GCs) as the textbook example of a simple stellar population is now outdated. In the last several years, a wealth of observational studies (both photometric and spectroscopic) have been carried out, revealing the quite complex nature of this old Galactic population.
With the famous exception of Cen (Freeman & Rodgers 1975), and of the more recently scrutinized M 54 (Carretta et al. 2010), M22 (Marino et al. 2009), and Terzan 5 (Ferraro et al. 2009), GCs show homogeneous compositions in the iron peak and heavier elements (e.g., Ca and Ti). Abundance variations in the lighter elements, namely Li, C, N, O, Na, Mg and Al, have been instead recognized since the 1970’s (e.g. Cohen 1978; see Gratton, Sneden & Carretta 2004 for a recent review). These peculiarities of GC stars require that some material must have been processed through the complete CNO cycle in hot H burning, through proton-capture reactions (Denisenkov & Denisenkova 1990): element pairs C and N, O and Na, and Mg and Al are anticorrelated, the abundances of C, O and Mg being depleted while those of N, Na and Al being enhanced.
A previous generation of stars, which synthesized proton-capture elements in their interiors, is now commonly accepted as responsible for the above-mentioned chemical signatures. Regardless of the debated nature of these element polluters (asymptotic giant branch (AGB) stars experiencing hot bottom burning, e.g., Ventura & D’Antona 2009, or fast rotating massive stars (FRMS), e.g., Decressin et al. 2007), two fundamental observational facts deserve to be emphasized. (1) All the GCs surveyed so far show the NaO anticorrelation (Carretta et al. 2009b): this indicates the presence of at least two populations (neither coeval nor chemically homogeneous) within each cluster. (2) The primordial nature of such a phenomenon is uniquely indicated by the presence of these chemical signatures also among not evolved turnoff (TO) or scarcely evolved (subgiant, SGB) members (see, e.g., Gratton et al. 2001).
In this context, Li abundances play a fundamental role. In fact, this element can be easily destroyed in stellar interiors (starting at Tburn2.5106 K); and since the CNO and NeNa cycles require much higher temperatures, it is expected that in the site(s) where these cycles occur no Li is left. In particular, the Na-poor, O and Li rich stars, that are the first population born in the cluster, share the chemical composition of field stars of the same metallicity, while the Na-rich (Li- and O-poor) stars form from gas progressively enriched by ejecta (which are rich in Na, depleted in O and Li) of the first generation.
As a consequence, if primordial and processed material are mixed in different proportions, then Li and Na (Li and O) are expected to be anticorrelated (correlated) with each other.
Measuring the Li abundances in unevolved stars provides a direct indication of the amount of pristine, and by difference of polluted (CNO-cycle processed), material present in each star. This makes Li a unique tracer of the dilution process which took place in the GC, supplying also fundamental insights on its early evolutionary stages. Another important point is that Li abundances can provide strong observational constraints on the origin of the polluters: since AGB stars might also produce Li (via the CameronFowler mechanism, Cameron & Fowler 1971), while massive stars can only destroy it, if Li-rich stars are present in GCs, AGB stars would be definitely favored with respect to FRMS.
To date, only three GCs have been surveyed for correlations between Li and proton-capture elements. Pasquini et al. (2005) obtained Li abundances in nine TO members of NGC 6752: they found a depletion reaching down to 1 dex below the Spite plateau values, clearly anticorrelated with Na abundances. A similar result was obtained by Bonifacio et al. (2007) who found a scatter in Li abundances much larger than observational errors and anticorrelated with Na among (only) four stars in 47 Tuc. Very recently, Lind et al. (2009), targeting about 100 main-sequence (MS) and early subgiant branch stars in NGC 6397, detected for the first time a significant anticorrelation between Li and Na in this GC. This last investigation supersedes an older research by Bonifacio et al. (2002) based on only a few stars, and highlighting the importance of large samples of stars for similar studies.
In this Letter we present Na, O, and Li abundance determinations in 90 unevolved TO stars of the GC 47 Tucanae, providing the largest database of this kind available in the literature so far.
2. Sample and Analysis
We retrieved from the ESO Archive FLAMES-Giraffe spectra (MEDUSA configuration) of 109 unevolved members of the metal-rich GC 47 Tuc (Program 081.D-0287; PI Z. Shen). The observations were carried out in Service mode in 2008 August–September; gratings HR15n (17,000), HR18 (18,400), and HR20A (16,000) were used to cover Li i (6707 Å), O i (7771, 7773, 7774 Å), and Na i (8183, 8194 Å) features, respectively.
The data reduction was performed with the ESO Giraffe
pipeline111http://www.eso.org/sci/data-processing/software/pipelines
/giraffe/giraf-pipe-recipes.html using Gasgano and
following the standard procedure: bias subtraction, flat-field correction,
wavelength calibration, and optimal spectrum extraction.
A careful sky subtraction has been done using the IRAF222IRAF is distributed by the National Optical Astronomy Observatory,
which is oprated by the Association of Universities for Research in Astronomy, Inc., under cooperative agreement
with the National Science Foundation. task skytweak
in order to take into account wavelength shifts and possible differences
in emission line strengths between stellar and sky spectra. It is noteworthy that
the presence of the moon at more than 90% illumination along with
diffuse clouds caused some of the observed frames to be severely contaminated
and were thus discarded (the night of August 17th). Different exposures were
then co-added to improve signal-to-noise ratios, obtaining typical values of
50–100 per pixel (near the Li i region at 6708 Å).
The abundance analysis was carried out using the ROSA code (developed by R. Gratton) and Kurucz (1993) model atmospheres; for Na and O, we derived abundances from the equivalent widths (EWs), applying corrections due to non-LTE effects (Gratton et al. 1999). LTE Li abundances were instead obtained through spectral synthesis. Stellar parameters were derived as follows. (1) We obtained initial effective temperatures () from the de-reddened (=0.04; Harris 1996) colors333Data are from unpublished photometry by Y. Momany (private communication); they are derived and calibrated exactly as the other dat sets in Momany et al. (2003). and the calibration by Alonso et al. (1996). The adopted values were derived from a relation between magnitude and color-based . This reduces errors for individual stars. (2) The surface gravities were estimated from the fundamental relation between , , and (), by adopting the bolometric corrections by Alonso et al. along with a distance modulus of 13.34 (Harris 1996), while was calculated in the same fashion described in Gratton et al. (2010).
Finally we assumed for all our sample stars microturbulence =1.00 km s-1 (note that none of the elements under scrutiny is strongly affected by values).
The [X/Fe] ratios were calculated assuming as solar references =6.21 and =8.79, values obtained in a fully consistent fashion from the analysis of the solar spectrum by Gratton et al. (2003), and [Fe/H]=0.76 (Carretta et al. 2009a) as cluster metallicity.
Both internal (random) and external (systematic) errors may affect our analysis. A discussion of the first kind of uncertainty, which is predominant for investigating star-to-star variations, can be found in Carretta et al. (2007); here we just mention that errors in EWs are dominant, while the internal uncertainties on stellar parameters () can be neglected (note that the distance of a star on the color-magnitude diagram from the MS main loci represents the major error source in the adopted temperature values). Systematic errors due to the adopted set of model atmospheres and/or to reddening and Teff scale cannot be larger than 0.1 dex (see Bonifacio et al. 2002, 2007 and Gratton et al. 2001); in particular, for Li, the combination of three-dimensional and non-LTE effects yields negligible corrections (see, e.g., Asplund et al. 2003).
All the abundance values with the corresponding uncertainties, along with magnitudes and coordinates, are available only in electronic version.
3. Results and Discussion
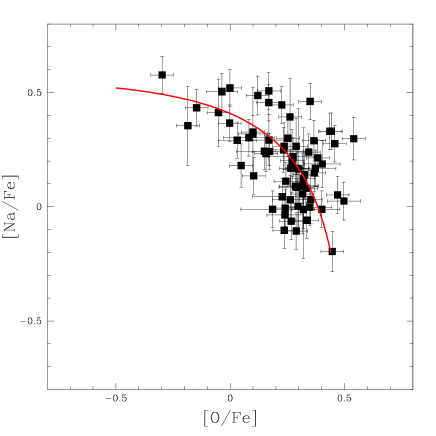
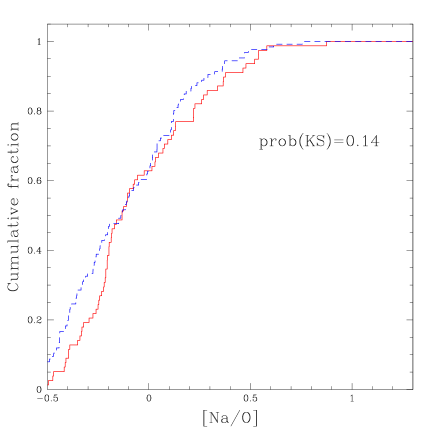
As shown in Figure 1, the unevolved cluster stars reveal a very clear NaO anticorrelation, consistently with what has been obtained for giant members (Carretta et al. 2009b). We detected an oxygen variation of about 0.80 dex and a change in Na of 0.77 dex, to be compared with 1 and 0.82 (O and Na respectively) for giants in Carretta et al. (2009b). The interquartile ranges IQR[Na/O] are 0.3680.067 and 0.4700.041, respectively. These two estimates are consistent at 1 level; however since the dwarfs are a more homogeneous sample (i.e., very similar atmospheric parameters) and the spectral features used to measure a given element are not the same in dwarfs and giants, the latter being weaker and plagued by higher uncertainties, both the spread (maximum–minimum) and the IQR result slightly higher for giants. It is noteworthy that we found an offset in Na abundances between dwarfs and giants of 0.2 dex for 47 Tuc. A similar offset can be obtained also for NGC 6397, when comparing Na abundances for dwarfs from Lind et al. (2009) and for giants from Carretta et al. (2009b). We investigated the nature of this offset, concluding that it is due to the adopted set of lines, with the doublets 5682 5688 Å and 61546160 Å (used in Carretta et al.) yielding always higher abundances than the 8183-8194 Å features (employed for dwarfs). We, in fact, detected the same effect in the Sun (with the same (Na) 0.2 dex). We propose that the way damping wings are treated is responsible for the observed difference. The present analysis uses values consistent with the Barklem et al. (2000) values; however, EWs are extracted using Gaussian profiles, which may result in systematic underestimates of the EWs for very strong lines, like the 8183-8194 Å ones. We then consider abundances from the weaker doublets as more reliable, and we offset our Na abundances for this effect.
In general, we conclude that there is a very good agreement between the two distributions as can be clearly seen in Figure 2: after applying the derived offset in Na abundances, the cumulative [Na/O] functions look very similar, and a KolmogorovSmirnov (KS) test indicates that the two distributions cannot be distinguished (the probability from KS being 14%).
Thanks to the wide sample available, we confirm that evolutionary effects, acting during the red giant branch (RGB) phase (see, e.g., D’Antona & Ventura 2007 for M 13), cannot contribute to the NaO distribution (at least for the present cluster), since the extent of anticorrelation in both giants and dwarfs is essentially the same. Furthermore, following the approach by Carretta et al. (2009b) the fractions of primordial (P)444The P stars must have [Na/Fe][Na/Fe]min + 0.3, then the remaining stars are divided in I and E according to [O/Na] larger and smaller than 0.9 dex, respectively. , intermediate (I) and extreme (E) stars computed from unevolved members are 34%5%, 63%7%, and 3%1% respectively to be compared with 27%5%, 69%8%, and 4%2% from giants (see Carretta et al. 2009b).
On the other hand, there is not a one-to-one correlation between Li and O abundances
(left-hand panel of Fig. 3): even if
some trend might be present, there is a considerable scatter, much larger than observational errors. The figure shows that, while
the stars with low O values have also low Li content, at higher O abundances, Li
can assume a large range values, from
1.540.06 to 2.510.18, with the most extreme star (# 085) having
0.08 (this very Li-rich star, which appears as
primordial type according to its O abundances, surely deserves special
attention and further
high-resolution observations, in order to investigate this extreme behaviour).
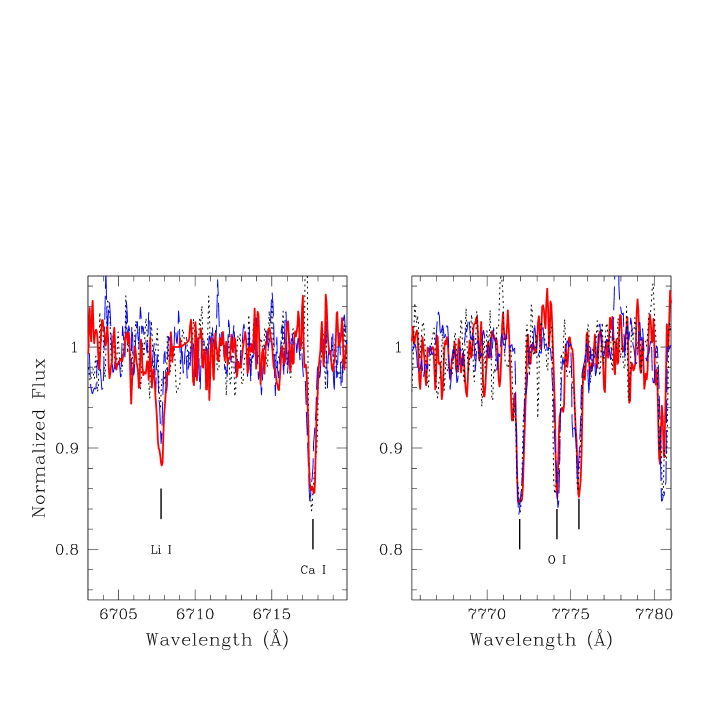
In Figure 4 we show, as explicative example, the spectra of three
stars
with almost the same O abundances; one is star # 085 and the two others have intermediate and low Li.
If we then focus on the LiNa
diagram (middle panel of Figure 3),
the scatter is even larger with no evidence for an anticorrelation.
As further evidence, the linear correlation coefficient is 0.39 (77 stars)
and 0.02 (84 stars), respectively, for the LiO and LiNa distributions: in the
first case, the significance level is 99.5%, while the second one
has no statistical
meaning.
Our study increases the sample of Li determination in this cluster, completing the previous studies by Pasquini & Molaro (1997, Li for two stars) and by Bonifacio et al. (2007), who proposed a LiNa anticorrelation on the basis of only four members.
To get more insight into this issue, we can compare it with a simple model. It is known that the NaO anticorrelation can be well described by a simple dilution model555The basic equation of this model is: , where , and are the logarithmic abundances of the element in the original and processed material, respectively., like the one proposed by Prantzos & Charbonnel (2006). On the other hand, Li abundances show a wide scatter, with values often well below those expected from a simple dilution model (red solid line in three panels of in Figure 3). However, we cannot exclude that this model might represent the upper envelope of the Li distribution. In the case of 47 Tuc, Li is telling us something different from Na and O. Different mechanism(s) have to be invoked in order to explain the observed abundance pattern.
The distribution of Li abundances for 47 Tuc hence looks very different from that found for the metal-poor ([Fe/H]=1.99; Carretta et al. 2009a) GC NGC 6397. In that case, a handful of Na-rich, Li-poor stars indicates a significant LiNa anticorrelation (Lind et al. 2009), and a simple dilution model very well reproduces the Li and Na distributions (see the right-hand panel in Figure 3).
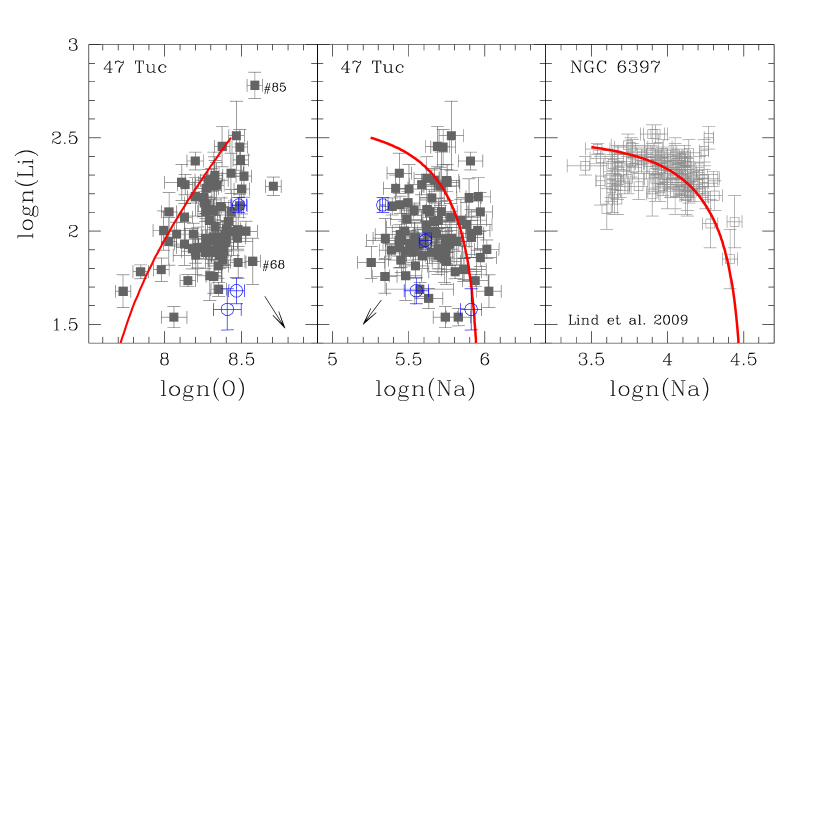
It is important to keep in mind that TO stars in 47 Tuc are cooler ( 5700-5800 K) than the TO stars of NGC 6397 ( 6100-6300 K), and they are well below the limit usually considered for the Spite plateau. The scatter found in Li abundances of 47 Tuc stars is reminiscent (or even better, is the Population ii analog) of the large scatter of Li abundances obtained for solar twins in the old open cluster M 67 (Randich et al. 2000) and in general, for old thick disk stars with effective temperatures close to 5800 K (Ryan et al. 2001). We note, however, that in this case the Li abundance variation is smaller with respect to typical values detected in Population i stars, probably because the latter ones are significantly more metal-rich.
4. Summary and Concluding Remarks
We present in this Letter Li, Na, and O abundances for a large sample (90) of TO stars in the metal-rich GC 47 Tuc, providing the largest database of this kind available so far. Our main results can be briefly summarized as follows:
-
1.
We obtained a very clear NaO anticorrelation, confirming the previous findings from giants derived by Carretta et al. (2009b). This is the first time that the NaO distributions in dwarfs and giants can be directly compared for a cluster using large samples of comparable sizes for both evolutionary stages. At least for 47 Tuc, evolutionary effects due to the RGB phase can be ruled out as contributors to the extent of NaO anticorrelation, which in both cases span the same range (within the observational uncertainties).
-
2.
As expected from stellar nucleosynthesis models in conjunction with multiple population scenarios, Li abundances should be positively correlated with O and anticorrelated with Na. At variance of the metal-poor GC NGC 6397, in the case of 47 Tuc the Li content does not show an anticorrelation with Na, and only a weak correlation appears with O, with a quite scatter distribution from both diagrams. Our result disagrees with the previous study by Bonifacio et al. (2007), who found LiNa anticorrelation from a small sample of only four stars, and once again emphasizes the crucial role of statistics in this kind of analysis. A simple dilution model fails to reproduce the LiNaO distributions for this cluster and advocates the presence of some different mechanisms responsible for the observed Li pattern.
-
3.
The scatter we find in Li abundances reminds of what has been detected, and reported in a large body of the literature, in Population I stars of similar parameters (, ), the most famous case being the old open cluster M 67 (see, e.g., Randich et al. 2000).
We are not presently able to conclude if the trend we discovered in 47 Tuc is peculiar or, on the other hand, other GCs share a similar behavior. In fact, to date, only two GCs have been investigated from this point of view. In this context, we mention that we cannot explain the unlikeness in the LiNa distributions between NGC 6397 and 47 Tuc; in particular, we cannot discriminate if the differences in ’s or metallicity can account for such a discrepancy. To probe this issue, it is crucial to enlarge the sample of simultaneous determinations of Li, Na, O in GC dwarf stars, by including other (nearby) clusters with different structural parameters (e.g., HB morphology, age, metallicity).
| StarID | R.A. | Decl. | Teff | ErrO | ErrNa | ErrLi | ||||||
|---|---|---|---|---|---|---|---|---|---|---|---|---|
| (deg) | (deg) | (mag) | (mag) | (K) | (dex) | (dex) | (dex) | (dex) | (dex) | (dex) | ||
| 001 | 6.15846 | 71.9632 | 17.347 | 17.913 | 5685 | 4.05 | 8.266 | 0.050 | 5.715 | 0.103 | 2.105 | 0.053 |
| 002 | 5.96746 | 71.9607 | 17.301 | 17.853 | 5676 | 4.02 | 8.061 | 0.083 | 5.741 | 0.080 | 1.538 | 0.057 |
| 003 | 6.33533 | 71.9429 | 17.347 | 17.913 | 5685 | 4.05 | 8.445 | 0.050 | 9.999 | 9.999 | 1.998 | 0.130 |
| 005 | 6.24487 | 71.9313 | 17.330 | 17.894 | 5681 | 4.04 | 8.112 | 0.111 | 5.752 | 0.080 | 2.261 | 0.096 |
| 006 | 6.16508 | 71.9222 | 17.372 | 17.941 | 5689 | 4.06 | 8.374 | 0.050 | 5.689 | 0.080 | 2.453 | 0.108 |
| 007 | 6.21133 | 71.9159 | 17.365 | 17.931 | 5688 | 4.05 | 8.493 | 0.050 | 9.999 | 9.999 | 2.381 | 0.087 |
| 008 | 6.27892 | 71.9146 | 17.377 | 17.940 | 5690 | 4.06 | 8.705 | 0.050 | 9.999 | 9.999 | 2.240 | 0.049 |
| 009 | 6.24204 | 71.9106 | 17.360 | 17.926 | 5687 | 4.05 | 8.327 | 0.050 | 9.999 | 9.999 | 2.299 | 0.081 |
| 010 | 6.11050 | 71.9085 | 17.335 | 17.899 | 5682 | 4.04 | 8.514 | 0.050 | 9.999 | 9.999 | 2.294 | 0.112 |
| 011 | 5.80258 | 71.9629 | 17.336 | 17.909 | 5682 | 4.04 | 9.999 | 9.999 | 5.910 | 0.083 | 1.987 | 0.129 |
References
- (1) Alonso, A., Arribas, S., & Martínez-Roger, C. 1996, A&AS, 117, 227
- (2) Asplund, M., Carlsson, M., & Botnen, A.V. 2003, A&A, 399, 31
- (3) Barklem, P.S., Piskunov, N., & O’Mara, B.J. 2000, A&A, 363, 109
- (4) Bonifacio, P., et al. 2002, A&A, 390, 91
- (5) Bonifacio, P., et al. 2007, A&A, 462, 851
- (6) Cameron, A.G.W., & Fowler, W.A. 1971, ApJ, 164, 111
- (7) Carretta, E., Bragaglia, A., Gratton, R. , D’Orazi, V., & Lucatello, S. 2009a, A&A, 508, 695
- (8) Carretta, E., Gratton, R., Bragaglia, A., Bonifacio, P., & Pasquini, L. 2004, A&A, 416, 925
- (9) Carretta, E., et al. 2007, A&A, 464, 939
- (10) Carretta, E., et al. 2009b, A&A, 505, 117
- (11) Carretta, E., et al. 2010, ApJL, in press (arXiv:1002.1963)
- (12) Cohen, J.G. 1978, ApJ, 223, 487
- (13) D’Antona, F., & Ventura, P. 2007, MNRAS, 379, 1431
- (14) Decressin, T., Charbonnel C., Prantzos, N., & Ekstrom, S. 2007, A&A, 464, 1029
- (15) Denisenkov, P.A., & Denisenkova, S.N. 1990, SvAL, 16, 275
- (16) Ferraro, F.R., et al. 2009, Nature, 462, 483-486
- (17) Freeman, K.C., & Rodgers, A.W. 1975, ApJ, 201, 71
- (18) Gratton, R., Carretta, E., Bragaglia, A., Lucatello, S., & D’Orazi, V. 2010, A&A, submitted
- (19) Gratton, R., Carretta, E., Eriksson, K., & Gustafsson, B. 1999, A&A, 350, 955
- (20) Gratton, R., Sneden, C., & Carretta, E. 2004, ARA&A, 42, 385
- (21) Gratton, R., et al. 2001, A&A, 369, 87
- (22) Harris, W.E. 1996, AJ, 112, 1487
- (23) Kurucz, R.L. 1993, CD-ROM 13, (Cambridge, MA: Smithsonian Astrophysical Observatory)
- (24) Lind, K., Primas, F., Charbonnel, C., Grundahl, F., Asplund, M. 2009, A&A, 503, 545
- (25) Marino, A.F., et al. 2009, A&A, 505, 1099
- (26) Momany, Y., et al. 2003, A&A, 407, 303
- (27) Pasquini, L., & Molaro, P. 1997, A&A, 322, 109
- (28) Pasquini, L., et al. 2005, A&A, 441, 549
- (29) Prantzos, N., & Charbonnel, C. 2006, A&A, 458, 135
- (30) Randich, S., Pasquini, L., & Pallavicini, R., 2000, A&A, 356, 25
- (31) Ryan, S., Kajino, T., & Beers, T. 2001, ApJ, 549, 55
- (32) Ventura, P., & D’Antona, F. 2009, A&A, 499, 835