The rotational excitation of HCN and HNC by He: New insights on the HCN/HNC abundance ratio in molecular clouds
Abstract
Modeling of molecular emission from interstellar clouds requires the calculation of rates for excitation by collisions with the most abundant species. The present paper focuses on the calculation of rate coefficients for rotational excitation of the HCN and HNC molecules in their ground vibrational state in collision with He. The calculations are based on new two-dimensional potential energy surfaces obtained from highly correlated ab initio calculations. Calculations of pure rotational (de)excitation cross sections of HCN and HNC by He were performed using the essentially exact close-coupling method. Cross sections for transitions among the 8 first rotational levels of HCN and HNC were calculated for kinetic energies up to 1000 cm-1. These cross sections were used to determine collisional rate constants for temperatures ranging from 5 K to 100 K. A propensity for even transitions is observed in the case of HCN–He collisions whereas a propensity for odd transitions is observed in the case of HNC–He collisions. The consequences for astrophysical models are evaluated and it is shown that the use of HCN rate coefficients to interpret HNC observations can lead to significant inaccuracies in the determination of the HNC abundance, in particular in cold dark clouds for which the new HNC rates show that the line of this species will be more easily excited by collisions than HCN. An important result of the new HNC-He rates is that the HNC/HCN abundance ratio derived from observations in cold clouds has to be revised from 1 to 1, in good agreement with detailed chemical models available in the literature.
keywords:
Molecular data, Molecular processes, scattering.1 Introduction
The isomers hydrogen cyanide (HCN) and hydrogen isocyanide (HNC) are among the most abundant organic molecules in space, from dark cold clouds (e.g. Irvine & Schloerb, 1984) to circumstellar envelopes (e.g. Cernicharo et al., 1996), cool carbon stars (Harris et al., 2003), comets (e.g. Lis et al., 1997) and active galaxies (Pérez-Beaupuits et al., 2007). HCN and HNC also belong to the small class of molecules detected in high-redshift galaxies, along with CO, CN and HCO+ (Guélin et al., 2007). In addition to thermal emission from various rotational transitions at (sub)millimeter and far-infrared wavelengths, a few masering lines have also been detected for both isomers (e.g. Lucas & Cernicharo, 1989; Aalto et al., 2009). Thus, in contrast to purely thermochemical considerations (HNC is less stable than HCN by about 0.6 eV, Bowman et al., 1993), the abundance of HNC in space is large: the abundance ratio [HNC]/[HCN] is observed to vary from 1/100, e.g. in high mass star forming regions (Schilke et al., 1992), up to 4.5 in dark cold clouds (Hirota et al., 1998). The large variation of this ratio remains a puzzle in astrochemistry, although the major source of both isomers is thought to be the dissociative recombination of HCNH+ with electrons (e.g. Amano et al., 2008, and references therein). Finally, we note that the HNC/HCN (rotational) line ratio is now employed to distinguish photon-dominated regions (PDR) and X-ray dominated regions (XDR): PDR sources all have ratios lower than unity while XDR have ratios larger than 1 (Meijerink & Spaans, 2005).
Due to the low density of the interstellar medium (cm-3), the rotational levels of molecules are generally not at local thermodynamic equilibrium (LTE). Reliable determination of molecular abundances therefore relies on accurate molecular collisional rates. Hydrogen molecules are generally the most abundant colliding parners in interstellar space, although collisions with H, He and free electrons can also play important roles in energetic regions. Rate coefficients for the rotational excitation of HCN by He atoms (employed as substitutes for H2) have been calculated by Green & Thaddeus (1974), Green (unpublished) 111The earlier calculations of Green & Thaddeus (1974) (restricted to the lowest 8 levels of HCN and temperatures of 5100 K) were extended in 1993 to obtain rate constants among the lowest 30 rotational levels and for temperatures of 1001200 K. These unpublished results are available at http://data.giss.nasa.gov/mcrates/#hcn and Monteiro & Stutzki (1986) (see also references therein). All these studies were based on the same potential energy surface (PES) obtained using the uniform electron gas model (Green & Thaddeus, 1974). For HNC, there is to the best of our knowledge no collisional data except those of Faure et al. (2007) for electron-impact excitation. In astrophysical applications, HNC and HCN have been therefore assumed to present similar collisional rates (see, in particular, the discussion in Guélin et al., 2007). Similar HCN and HNC rotational rates were also observed for electron-impact excitation which is, however, dominated by the dipole interaction (Faure et al., 2007). In contrast, inelastic collisions between neutral species are dominated by short-range interactions and larger differences between HCN and HNC are expected.
In the present work we present new rotational rate coefficients for HCN and HNC based on highly accurate, HCNHe and HNCHe PES. The paper is organized as follows: Section 2 describes the PES used in this work. Section 3 then contains a rapid description of the scattering calculations. In Section 4 we present and discuss our results. Finally, we analyze in section 5 the effect of these new rate coefficients on the excitation of HCN and HNC by modeling this excitation through a large velocity gradient code.
2 Potential energy surface
2.1 HCN–He
Several theoretical PES for the HCN–He system have been published during the last fifteen years: Atkins & Hutson (1996); Drucker et al. (1995) and Toczyłowski et al. (2001), hereafter called TDC01. In the present study, we used the latter surface. As a reminder, it was computed ab initio using the CCSD(T) method (Hampel et al., 1992), with a triple zeta (aug-cc-pVTZ) basis set and an additional [] set of bond functions (full details on the ab initio procedure used can be found in TDC01). The HCN molecule was treated as a linear rigid rotor with intramolecular distances fixed at the equilibrium values =2.01350 bohr and =2.17923 bohr (see discussion below in the case of HNC).The global minimum of this PES is in the linear He–HCN configuration at =7.97 bohr and has a well depth of 29.90 cm-1.
A semi-empirical surface (Harada et al., 2002) is the latest PES published for HCN-He. It used the TDC01 surface as a starting point. The choice of the TDC01 surface seemed more adequate to us, as it is purely ab initio and thus consistent in the whole relevant interaction range, while the empirical PES used the measured spectrum of the bound van der Waals complex to refine the TDC01 surface in the region of the attractive well, thus possibly losing precision in other regions that could be as important for the present dynamical applications. A contour plot of the potential is shown in Fig. 1 of TDC01.
The PES being strongly anisotropic due to the length of the HCN rod, we fitted the TDC01 surface with a Legendre polynomials basis
| (1) |
using exactly the same truncation technique as for the HC3N-He system in Wernli et al. (2007a, b). In this equation, is the distance from the HCN centre of mass to the He atom, being the He–HCN angle as measured from the H side of HCN. The combination of 25 polynomials () and a cubic spline interpolation for the radial coefficients () was employed to obtain a precise fitting of the PES, the standard deviation between fitted and ab initio data being cm-1 for all potential values lower than 300 cm-1. We also tested our fit against the ab initio values given in the lower part of table I of TDC01, and found a difference cm-1 for all 16 points in this table.
As a first outcome of the fitting, the with even were found to be significantly lower than those of Green & Thaddeus (1974) (table 3 in their article), indicating a lower (even) anisotropy of the TDC01 surface. This is expected to have an effect in the propensity rules, as shall be further discussed in section 4.
2.2 HNC–He
To our knowledge, no PES exists for the HNC-He van der Waals system. The ground electronic state of the weakly bound HNC–He system is a singlet with refection symmetry. Within the ground electronic state, the equilibrium geometry of the HNC molecule is linear. Therefore, HNC can be considered as a linear rigid rotor. The HNC–He “rigid rotor” PES is described by the two Jacobi coordinates , the distance from the centre of mass of HNC to the He atom, and , the angle between and the HNC bond axis , with corresponding to colinear HeCNH. The HN and NC bond distances and were frozen at their experimental equilibrium value bohr and bohr (Huber & Herzberg, 1979). As demonstrated by Lique & Spielfiedel (2007) for the CS-He system, for non-hydride diatomic molecules two-dimensional PES calculated for a frozen bond distance or obtained from full 3D PES by averaging over the intermolecular ground state vibrational wavefunction are very similar. Consequently, in the present case we anticipate that restricting and to their equilibrium value will introduce little error into the calculated inelastic rate coefficients.
The potential energy surface (PES) was calculated in the supermolecular approach by means of a single- and double-excitation coupled-cluster method (Hampel et al., 1992) (CCSD). In addition, we included perturbative contributions from connected triple excitations computed as defined by Watts et al. (1993) [CCSD(T)]. The calculations were done with the MOLPRO 2006.1 package. For all three atoms we used the standard correlation-consistent polarized valence-quadruple-zeta basis sets of Dunning (Dunning, 1989) (cc-pVQZ) augmented with the diffuse functions of , , , and symmetries by Kendall et al. (1992) (aug-cc-pVQZ). This basis set was further augmented by the [] bond functions optimized by Cybulski & Toczyłowski (1999) and placed at mid-distance between the He atom and the HNC centre of mass.
At all geometries the Boys & Bernardi (1970) counterpoise procedure is used to correct for basis set superposition error (BSSE). In this procedure the interaction energy is defined by
| (2) |
where the energies of the HNC and He subsystems are determined with the full (four atoms plus bond functions) basis set.
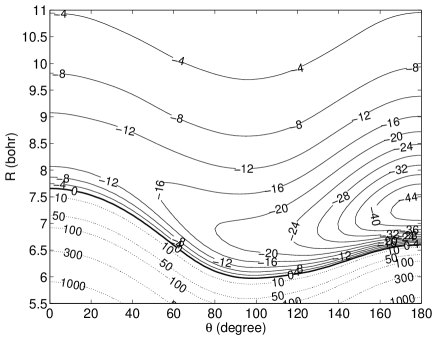
Interaction energies at a total of 446 geometries were computed. The values of the radial scattering coordinate ranged from 4 bohr to 25 bohr. The angular grid was uniform with a 15 degree spacing from 0 to 180∘. A contour plot of the potential is shown in Fig. 1. For this weakly-bound system the global minimum in the interaction energy was found to be –46.83 cm-1 ( bohr, ) corresponding to collinear He–HNC. We note the strong anisotropy of the PES.
The calculated interaction energies were fitted by means of the procedure described by Werner et al. (1989) for the CN–He system. The largest deviations between the fit and the ab initio points occur primarily in the repulsive region of the PES. Over the entire grid, the mean relative difference between the analytic fit and the ab initio calculations is 0.5%. The dependence of the potential energy surface on the He–HNC angle was fitted by the usual Legendre expansion, Eq. (1). From an ab initio grid containing 13 values of , we were able to include terms up to = 12.
The dependence on of the dominant coefficients for the HCN–He and HNC–He PESs is shown in Fig. 2.
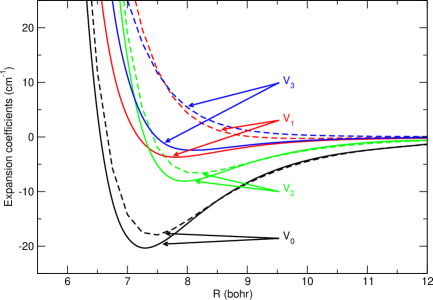
We observe that, for the HCN–He system, the largest (in magnitude) of the anisotropic terms () corresponds to . This implies that, to a first approximation, the PES is symmetric with respect to . At the opposite, for the HNC–He system, the largest of the anisotropic terms corresponds to in the relevant range of , that is between 7 and 8 bohrs. This reflects a large (odd) anisotropy for the PES. Consequences for the rotational excitation will be discussed in the next paragraph.
3 Dynamical calculations
The main focus of this paper is the use of the two fitted HCN–He and HNC–He PES to determine rotational excitation and de-excitation cross sections of HCN and HNC molecules by He atoms. In the following, the rotational quantum number of HCN and HNC will be denoted . Despite the presence of a hyperfine structure in both molecule (Garvey & de Lucia, 1974), we consider only the rotational structure of HCN and HNC.
To determine the inelastic cross sections we used the exact close coupling (CC) approach of Arthurs & Dalgarno (1960). The integral cross sections are obtained by summing the partial cross sections over a sufficiently large number of values of the total angular momentum until convergence is reached. The standard time-independent coupled scattering equations were solved using the MOLSCAT code (Hutson & Green, 1994). Calculations were carried out at values of the total energy ranging from 3.2 to 1000 cm-1. The integration parameters were chosen to ensure convergence of the cross sections. We extended the rotational basis sufficiently to ensure convergence of the inelastic cross sections. At the largest total energy considered (1000 cm-1) the rotational basis was extended to and 16, respectively, for the HCN–He and HNC–He calculations. The maximum value of the total angular momentum used in the calculations was set large enough that the inelastic cross sections were converged to within 0.005 Å2.
From the rotationally inelastic cross sections , one can obtain the corresponding thermal rate coefficients at temperature by an average over the collision energy ():
| (3) | |||||
where is the reduced mass and is Boltzmann’s constant. To obtain precise values for the rate constants, the energy grid was chosen to be sufficiently fine to include the numerous scattering resonances which will be described below.
4 Results
4.1 Cross sections
Figure 3 illustrates the typical energy dependence of the collisional de-excitation cross sections obtained from the present CC calculations for a few selected rotational levels.
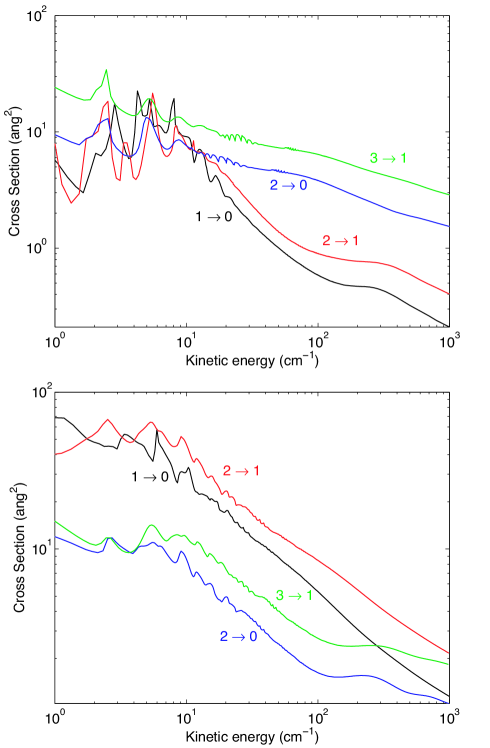
The de-excitation cross sections are almost decreasing functions of the energy. For collision energies below 50 cm-1, many resonances are found. These are a consequence of the quasibound states arising from tunneling through the centrifugal energy barrier (shape resonances), or from the presence of an attractive potential well that allows the He atom to be temporarily trapped into the well and hence quasibound states to be formed (Feshbach resonances) before the complex dissociates (Smith et al., 1979). Because of the averaging over collision energy, Eq. (3), these narrow resonances will have little, if any, effect on the relaxation rate coefficients.
4.2 Rate coefficients
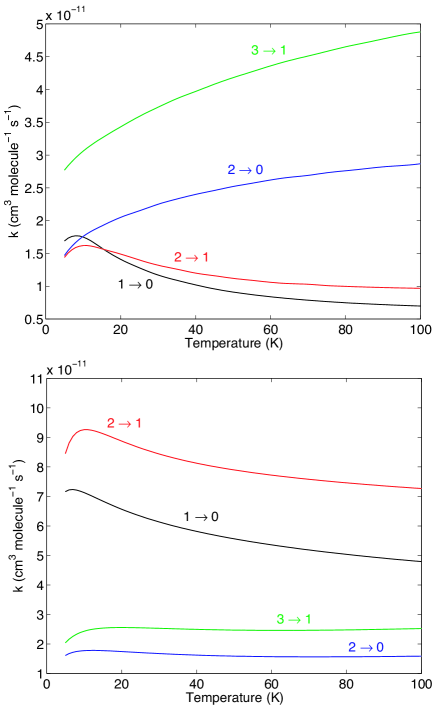
We obtained, by energy averaging, de-excitation rate coefficients for the first 8 () rotational levels of HCN and HNC, from the CC cross sections. The representative variation with temperature is illustrated in Fig 4.
This complete set of (de)excitation rate coefficients is available on-line from the LAMDA 222http://www.strw.leidenuniv.nl/ moldata/ and BASECOL333http://basecol.obspm.fr/ website. Excitation rate coefficients can be easily obtained by detailed balance:
| (4) |
where and are, respectively, the energies of the rotational levels and .
As they are the only complete set of rotational rates available in the literature, astronomers still generally use the HCN–He rates of Green & Thaddeus (1974) in order to interpret HCN and HNC observations. Table 1 compares on a small sample the temperature dependence of our HCN–He rates versus those of Green & Thaddeus (1974). We see that logically, the largest differences appear at low temperature. These differences can be attributed to the use of a new PES for the scattering calculations. The maximum difference at 100 K - the highest temperature for our data - is found on the smallest rate and is of a factor of 2. On the larger rates the two sets match nearly.
| HCN | Green & Thaddeus (1974) | HNC | |
| 10K | |||
| 1 0 | 0.175 | 0.110 | 0.817 |
| 2 0 | 0.176 | 0.241 | 0.203 |
| 3 0 | 0.005 | 0.012 | 0.058 |
| 4 0 | 0.021 | 0.045 | 0.026 |
| 100K | |||
| 1 0 | 0.070 | 0.074 | 0.549 |
| 2 0 | 0.286 | 0.285 | 0.182 |
| 3 0 | 0.009 | 0.020 | 0.107 |
| 4 0 | 0.064 | 0.068 | 0.031 |
4.3 Comparison between HCN and HNC rate coefficients
Fig. 5 shows the HCN–He and HNC–He de-excitation rate coefficients from the level at 10 K and 50 K.
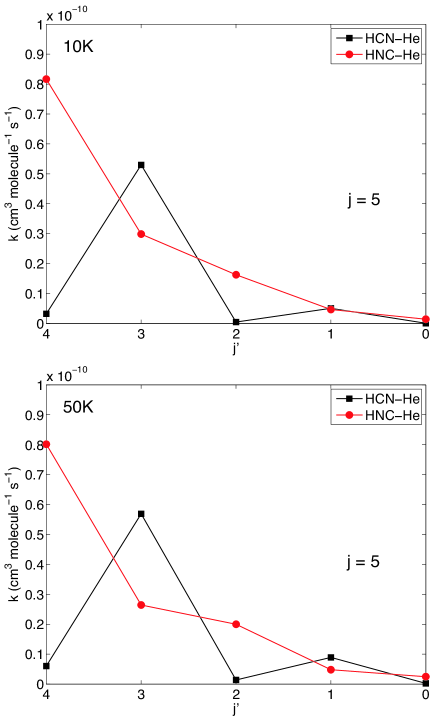
One can see that significant differences exist between the HCN–He and HNC–He rate coefficients:
(i) On the overall, the HNC rate coefficients seems to be larger than the HCN rate coefficients. This can be explained by a larger well depth of the HNC–He PES than the one of the HCN–He PES (46.83 versus 29.90 cm-1).
(ii) The propensity rules seen in the two sets of rate coefficients are different. The HCN-He rate coefficients present a strong propensity in favour of transitions with even whereas the HNC-He rate coefficients present a strong propensity in favor of transitions with odd . These propensity are due to the shape of the PESs. Indeed, near-homonuclear symmetry of the potential energy surface, such as HCN–He PES, will favor transitions with even whereas anisotropic potential energy surface, such as the HNC–He PES [see Fig. (2)], will favor transitions with odd (McCurdy & Miller, 1977).
From this comparison, one can see that the use of HCN rate coefficients, in astrophysical applications, in order to interpret HNC observations may be dangerous since the use of “real HNC rate coefficients” will probably significantly modify the excitation of the HNC molecule. This will be discussed in the next part.
5 Astrophysical applications
5.1 HCN
We have estimated the line intensities of HCN using the present rate coefficients and compared the results with those obtained using the one of Green & Thaddeus (1974). Both sets of rates have been corrected for the different reduced mass of the system HCN–H2, as molecular hydrogen is the main collision partner in molecular clouds :
| (5) |
where and are respectivelly the reduced mass of the HCN-He and HCN-H2 collisional systems.
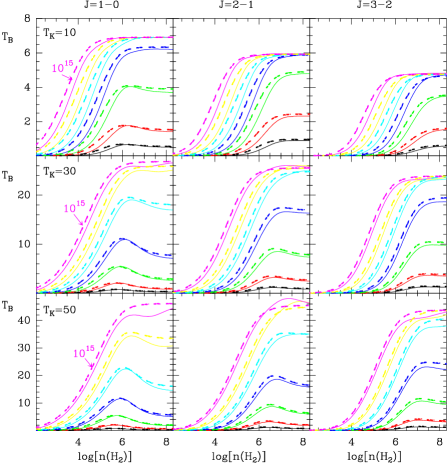
We have used a Large Velocity Gradient (LVG) code to derive excitation temperatures, opacities, and brightness temperatures under different physical conditions. We have assumed a spherical cloud with an intrinsic linewidth of 1 kms-1. We have selected three different temperatures: 10, 30 and 50 K, and the density has been varied from 102 to 109 cm-3. The column densities of HCN had gone from 1012 (optically thin case) to 1015 cm-2 (very optically thick case). The results using the new rate coefficients are shown in Fig. (6) (solid lines; dashed lines are the results for HNC - see next section -) which can be used to estimate physical conditions of the gas from the observed intensities of the , , and lines in astronomical objects.
In the optically thin case ( cm-2) very high densities are needed to excite significantly the line of HCN while in the optically thick case, the HCN excitation is dominated by radiative effects and strong emission could be obtained even in the case of densities 104 cm-3. For these large opacities and narrow lines more sophisticated models taking into account the hyperfine structure of the molecule have to be performed to deal in detail with the radiative transfer of HCN (see Kwan & Scoville (1975); Guilloteau & Baudry (1981); Cernicharo et al. (1984); Cernicharo & Guelin (1987); González-Alfonso & Cernicharo (1993)).
In order to compare our results with those obtained using the Green & Thaddeus (1974) rates, we show in Fig. (7) the ratio of the intensity for the , and lines obtained using the new rate coefficients and those derived using the previous ones, [New]/[Old]. Similarly to the calculations described above the number of rotational levels included in the calculations is 8 (). The temperature varies between 10 and 100 K, the highest temperature of the new and old HCN–He rate coefficients. We have considered three different column densities for HCN, 1012, 1013, and 1014 cm-2, which correspond for the transition to the optically thin (), moderate optically thick (), and optically thick (1) cases respectively. For the density we have selected also three values, 104, 105 and 106 cm-3, corresponding to low, moderate and high collisional excitation respectively. As one could expect from a comparison of the rates given in Table 1, only small differences are found in the predicted intensity ratios. For the line we found similar intensities using both set of collisional rates at low temperatures (a few percent difference for TK 20 K). The column density of HCN plays little effect in the low and moderate density cases. The largest differences for the line are found for (H2)=106 cm-3. The situation is slightly different for the and lines. For low temperature the intensity ratios obtained with both set of rate coefficients show differences of 20 and 35% respectively for low and moderate densities (104 and 105 cm-3).

To further explore these effects we have considered the following case: K, (H2) = 105 cm-3 and cm-2. The old rate coefficients produce intensities for the , , and lines of 3.6, 2.2 and 0.8 K respectively. These intensities can be reproduced using the new rate coefficients for a density of 1.3 105 cm-3. Hence, very small errors are introduced in the interpretation of the data using the Green & Thaddeus (1974) rate coefficients for warm molecular clouds. However, for K the predicted intensities for these lines using the old rates is 1.56, 0.57 and 0.09 K respectively. With the new rates they are 1.55, 0.45 and 0.057 K respectively. The line intensity ratios / and / are different between both sets of rates while the / intensity ratio is similar. Hence, the interpretation of astronomical observations of HCN using the old HCN–He rates will be difficult in some cases as it will be hard to fit the observed line intensity ratios. Consequently, we recommend the use of the new HCN–He rate coefficients in interpreting observed line intensities.
5.2 HNC
Rate coefficients for HNC with Helium (or H2) have not been available until the present work. Interpretation of astronomical observations has been done using the HCN-He rate coefficients on the basis that the HNC-He and HCN-He PES could not be very different, that the dipole moment of both molecules differ by less than 3%, and that the energy levels for both species are similar. However, the comparison of both set of rates done in previous sections indicate that some excitation effects could arise from the different propensity rules for both species and from the value of the rate coefficients (see Table 1), which differs by a factor between both species. We have derived brightness temperatures for the HNC , , and lines using the rates calculated in this work for the same set of models than for HCN. The results are shown Fig. 6 (dashed lines). The excitation temperature of the line of HNC is larger than that of HCN for the three temperatures considered in our calculations and for all column densities (abundances). The same applies to the and transitions for low temperature. However, the differences in predicted brightness temperatures for these two lines are less important for kinetic temperatures above 30 K. Hence, we have two different effects for HNC with respect to HCN:
(i) the line will be, for identical physical conditions and molecular abundances, considerably stronger for HNC than for HCN, i.e., it is more easily excited which is a direct result of the larger collisional rates for HNC. The same applies to the and lines but the effect is less pronounced.
(ii) the intensity line ratios will have significant differences for both molecules.
Therefore, the densities derived from astronomical observations of HNC and HCN could be different. Moreover, in the optically thin case the lines from these species could trace different areas of the cloud. Our calculations indicate that the line of HNC could show weak maser effects for moderate column densities (low line opacities) and densities between 105 and 106 cm-3 for temperatures above 30 K (i.e., similar to the behaviour of the HCN line). However, no population inversion, such as the one tentatively reported by Aalto et al. (2009) in the direction of Arp220, has been found for the line.

In order to quantify the effect of the new rate coefficients on the excitation of the rotational levels of HNC, we have compared the line intensities obtained with the HNC-He rates and those obtained when the HCN-He rates are adopted for HNC. Fig. 8 shows the intensity ratio / for the , , and transitions. Three different column densities have been considered: 1012, 1013, and 1014 cm-2 (optically thin, 1, and optically thick respectively). The volume density has been selected for the case of low, medium and high collisional excitation ((H2)=104, (H2)=105, and (H2)=106 cm-3 respectively). We see that the intensity ratios predicted by both sets of collisional rates approach unity for high temperature for all column densities. However, for low and moderate kinetic temperature there are significant differences in the derived brightness temperatures. The transition is predicted up to 2.5 times stronger using the HNC-He rate coefficients than that obtained from the HCN-He ones. The effect is less prominent for the transition and never exceeds 10% for the one. This behaviour has strong implications for the interpretation of the observations of HNC in cold dark clouds as the density required to obtain the same brightness temperature is lower for the HNC-He rates than for the HCN-He ones. Moreover, using the latter rates it will be difficult to fit the line intensity ratios , and . has a value of 7 for all column densities, n(H2)104 cm-2, and TK=10 K, using the HNC-He rates. Its value is 5.5 using the HCN-He ones. reachs a value of 17 with the HNC-He rates and of 14 with the HCN-He ones for the same range of physical conditions. For (H2) larger than a few 106 cm-3 the value of [HNC-He]/[HCN-He] approaches unity. For 30 K the ratio does not show any significant difference (below 20%) between both set of collisional rates. However, the and ratios still show important discrepancies for (H2) 105 cm-3.
As an example to quantify how important are these errors one could consider a typical dark cloud with n(H2)=104 cm-3, =10 K and (HNC)=1013 cm-2. To fit the predicted line intensity from the HNC-He rates using the HCN-He ones we will need to increase the column density of HNC by a factor 2.4. Consequently, it seems obvious that the HNC-He collisional rates have to be used over the HCN-He ones at least for low and moderate temperatures. Moreover, for low kinetic temperature the abundances of HNC reported in the litterature have to be revised as the new rates indicated that the HNC abundance has probably been overestimated by a factor 2-3 depending on the physical conditions of the cloud. It is particularly interesting to note that the line of HNC, being more easily excited than that of HCN, could be formed in zones of the cloud different from those of HCN.
The large different collisional excitation between the line of HNC and HCN has important consequences for the chemical modeling of dark clouds. Irvine & Schloerb (1984) pointed out the need for a HNC/HCN abundance ratio 1 in these objects. Many other authors have arrived to the same conclusion. However, from a detailed modeling (Herbst, Terzieva & Talbi2000) concluded that, from a chemical point of view, it was not possible to reproduce the derived abundances in dark clouds and that the HNC/HCN abundance ratio could not be very different from unity at TK=10K. The present results provide an explanation to this observational problem and allow us to conclude that in cold dark clouds the HNC/HCN abundance ratio is 1.
For K, it appears from Fig. 8 that the HCN-He collisional rates will produce reasonable results in interpreting the observed HNC line intensities and line intensity ratios. Hence, the relative abundances between both species derived in the literature toward warm molecular clouds are not significantly affected by the use of these rates.
6 Summary and conclusion
We have used quantum scattering calculations to investigate rotational energy transfer in collisions of HCN and HNC molecules with He atoms. The calculations are based on new, highly accurate 2D potential energy surfaces. Rate coefficients for transitions involving the lowest 8 levels of these molecules were determined for temperatures ranging from 5 to 100 K. Strong propensity rule for even were found in the case of HCN–He system whereas a propensity rules for odd were found in the case of HNC–He system.
The impact of these new rate coefficients on astrophysical modeling has been evaluated. The new HCN–He collisional rates have little impact on the interpretation of observations for warm and hot molecular clouds as the use of the previous rates (Green & Thaddeus, 1974) produce line intensities that differ from those obtained from our rates by an amount similar to the calibration accuracy of radio observations in the millimeter and submillimeter domains. However, for low kinetic temperature the previous collisional rates could not reproduce the observed line intensity ratios / and /. For TK100 K we recommend to use our rates. The situation is different for HNC as no previous collisional rates are available and the interpretation of astronomical observations has been based on the use of the Green & Thaddeus (1974) rates for HCN. We have found significant variations in the predicted line intensities and line intensity ratios using the HNC–He rates instead of the HCN–He ones (our calculations for HCN). In particular, in cold dark clouds the interpretation of the HNC line intensities will dramatically suffer if the HCN-He rates are used rather than the correct HNC-He ones. The main collider in molecular clouds is however molecular hydrogen. Hence, these conclusions could be limited to the case of HCN/HNC-para-H2() for which the collisional rates are expected to be very similar to those of HCN/HNC-He (see below).
Our results for HNC indicate that the HNC/HCN abundance ratio derived from observations toward dark clouds has to be revised. The best fit to the observations available in the literature is obtained for HNC/HCN 1. We have neglected in our calculations the hyperfine structure of HCN and HNC. Although difficult to spectroscopically resolve for the latter, for the former species the line intensities of the different hyperfine components are known to show important intensity anomalies (Kwan & Scoville, 1975; , Walmsley et al.1982; Cernicharo et al., 1984; González-Alfonso & Cernicharo, 1993), which can be explained as the result of their different opacities across the cloud (Cernicharo et al., 1984; Cernicharo & Guelin, 1987; González-Alfonso & Cernicharo, 1993). Line overlaps also play an important role in the excitation of HCN in molecular clouds (González-Alfonso & Cernicharo, 1993). They are responsible of the strong masers found in other species (see, e.g., Gonzalez-Alfonso et al. (1996); Gonzalez-Alfonso & Cernicharo (1997)). Hence, a correct treatment of the radiative transfer of HCN (and in some cases also of HNC) in molecular clouds will require a detailed knowledge of the collisional rates between hyperfine components. These calculations are under development and will be published elsewhere.
Finally, as already said, the great abundance of H2 in the interstellar medium makes this molecule the primary collision partner for any other species. It is generally assumed (Lique et al., 2008) that rate coefficients with He can provide a good estimate of rate coefficients for collision with para-H2(). This approximation postulates that collisional cross sections with He and para-Hj=0 are equal, so that the rate coefficients differ only by a reduced mass factor of 1.4 arising from the thermal averaging (Eq. 3). Recent results on rotational excitation of CO (Wernli et al., 2006), SO (Lique et al., 2007) and SiS (Lique & Kłos, 2008; Kłos & Lique, 2008) have pointed out that rate coefficients for collisions with para-H2() can be up to a factor of 3 larger or smaller than those for collisions with He, depending on the selected transition, but that the He rate coefficients scaled by a factor 1.4 provide the correct order of magnitude of the H rate coefficients444We note, however, that much larger differences between He and para-H2() have been observed for small hydride molecules like H2O (Dubernet et al., 2009) and NH3 (Maret et al., 2009). However, detailed calculations by Cernicharo et al. (2009) indicate very little differences in the water vapour predictions in protoplanetary disks using H2O-He and H2O-H collisional rates.. Therefore, the present results should provide a reasonable first estimate of collisional rate coefficients for collisions of HCN and HNC with para-H2(). On the other hand, it may be unadvisable to use the present He rate coefficients as an estimate of the ortho-H2 rate coefficients, since the He and ortho-H2 rate coefficients usually differ significantly. Specific calculations with ortho-H2 must be performed. Thus, it is crucial to extend the calculations, both of the PES and of the inelastic cross sections, to the HCN–H2 and HNC–H2 systems.
In any case, the full set of rate coefficients presented here will enhance our ability to understand and interpret future HCN and HNC observations. Collisonal rates when the hyperfine structure is considered can be obtained from the present results and the standard assumption that the rates will be proportional to the degeneracy of the final hyperfine state, or employing the more physical IOS scaling method (Faure et al., 2007).
Acknowledgments
F.L. and A.F acknowledge the CNRS national program “Physique et Chimie du Milieu Interstellaire” for supporting this research. J. C. would like to thank the Spanish Ministerio de Ciencia e Innovaci on for funding support through grants AYA2006-14876, and the DGU of the Madrid community government under IV-PRICIT project S-0505/ESP-0237 (ASTROCAM).
References
- Aalto et al. (2009) Aalto S., Wilner D., Spaans M., Wiedner M. C., Sakamoto K., Black J. H., Caldas M., 2009, A&A, 493, 481
- Amano et al. (2008) Amano T., Zelinger Z., Hirao T., Takano J., Toyoda R., 2008, Journal of Molecular Spectroscopy, 251, 252
- Arthurs & Dalgarno (1960) Arthurs A. M., Dalgarno A., 1960, Proc. R. Soc. London, Ser. A, 256, 540
- Atkins & Hutson (1996) Atkins K. M., Hutson J. M., 1996, J. Chem. Phys., 105, 440
- Bowman et al. (1993) Bowman J. M., Gazdy B., Bentley J. A., Lee T. J., Dateo C. E., 1993, J. Chem. Phys., 99, 308
- Boys & Bernardi (1970) Boys S. F., Bernardi F., 1970, Mol. Phys., 19, 553
- Cernicharo et al. (1996) Cernicharo J., Barlow M. J., Gonzalez-Alfonso E., Cox P., Clegg P. E., Nguyen-Q-Rieu A., et al. 1996, A&A, 315, L201
- Cernicharo et al. (1984) Cernicharo J., Castets A., Duvert G., Guilloteau S., 1984, Astron. Astrophys., 139, L13
- Cernicharo et al. (2009) Cernicharo J., Ceccarelli C., Ménard F., Pinte C., Fuente A., 2009, ApJL, 703, L123
- Cernicharo & Guelin (1987) Cernicharo J., Guelin M., 1987, A&A, 176, 299
- Cybulski & Toczyłowski (1999) Cybulski S. M., Toczyłowski R., 1999, J. Chem. Phys., 111, 10520
- Drucker et al. (1995) Drucker S., Tao F.-M., Klemperer W., 1995, J. Phys. Chem., 99, 2646
- Dubernet et al. (2009) Dubernet M., Daniel F., Grosjean A., Lin C. Y., 2009, A&A, 497, 911
- Dunning (1989) Dunning T. H., 1989, J. Chem. Phys., 90, 1007
- Faure et al. (2007) Faure A., Varambhia H. N., Stoecklin T., Tennyson J., 2007, MNRAS., 382, 840
- Garvey & de Lucia (1974) Garvey R. M., de Lucia F. C., 1974, Journal of Molecular Spectroscopy, 50, 38
- Gonzalez-Alfonso et al. (1996) Gonzalez-Alfonso E., Alcolea J., Cernicharo J., 1996, A&A, 313, L13
- González-Alfonso & Cernicharo (1993) González-Alfonso E., Cernicharo J., 1993, Astron. Astrophys., 279, 506
- Gonzalez-Alfonso & Cernicharo (1997) Gonzalez-Alfonso E., Cernicharo J., 1997, A&A, 322, 938
- Green & Thaddeus (1974) Green S., Thaddeus P., 1974, ApJ., 191, 653
- Guélin et al. (2007) Guélin M., Salomé P., Neri R., García-Burillo S., Graciá-Carpio J., Cernicharo J., Cox P., Planesas P., Solomon P. M., Tacconi L. J., vanden Bout P., 2007, A&A, 462, L45
- Guilloteau & Baudry (1981) Guilloteau S., Baudry A., 1981, A&A, 97, 217
- Hampel et al. (1992) Hampel C., Peterson K. A., Werner H.-J., 1992, Chemical Physics Letters, 190, 1
- Harada et al. (2002) Harada K., Tanaka K., Tanaka T., Nanbu S., Aoyagi M., 2002, J. Chem. Phys., 117, 7041
- Harris et al. (2003) Harris G. J., Pavlenko Y. V., Jones H. R. A., Tennyson J., 2003, MNRAS., 344, 1107
- (26) Herbst E., Terzieva R., Talbi D., 2000, MNRAS., 311, 869
- Hirota et al. (1998) Hirota T., Yamamoto S., Mikami H., Ohishi M., 1998, ApJ., 503, 717
- Huber & Herzberg (1979) Huber K. P., Herzberg G., 1979, Molecular Spectra and Molecular Structure. IV. Constants of Diatomic Molecules. Van Nostrand Reinhold, New York
- Hutson & Green (1994) Hutson J. M., Green S., , 1994
- Irvine & Schloerb (1984) Irvine W. M., Schloerb F. P., 1984, ApJ., 282, 516
- Kendall et al. (1992) Kendall R. A., Dunning T. H., Harrison R. J., 1992, J. Chem. Phys., 96, 6796
- Kłos & Lique (2008) Kłos J., Lique F., 2008, MNRAS., 390, 239
- Kwan & Scoville (1975) Kwan, J., Scoville, N., 1975, ApJ., 195, L85
- Lique & Kłos (2008) Lique F., Kłos J., 2008, J. Chem. Phys., 128, 034306
- Lique et al. (2007) Lique F., Senent M.-L., Spielfiedel A., Feautrier N., 2007, J. Chem. Phys., 126, 164312
- Lique & Spielfiedel (2007) Lique F., Spielfiedel A., 2007, A&A, 462, 1179
- Lique et al. (2008) Lique F., Toboła R., Kłos J., Feautrier N., Spielfiedel A., Vincent L. F. M., Chałasiński G., Alexander M. H., 2008, A&A, 478, 567
- Lis et al. (1997) Lis D. C., Keene J., Young K., Phillips T. G., Bockelee-Morvan D., Crovisier J., Schilke P., Goldsmith P. F., Bergin E. A., 1997, Icarus, 130, 355
- Lucas & Cernicharo (1989) Lucas R., Cernicharo J., 1989, A&A, 218, L20
- McCurdy & Miller (1977) McCurdy C. W., Miller W. H., 1977, J. Chem. Phys., 67, 2488
- Maret et al. (2009) Maret S., Faure A., Scifoni E., Wiesenfeld L., 2009, MNRAS., 399, 425
- Meijerink & Spaans (2005) Meijerink R., Spaans M., 2005, A&A, 436, 397
- Monteiro & Stutzki (1986) Monteiro T. S., Stutzki J., 1986, MNRAS., 221, 33P
- Pérez-Beaupuits et al. (2007) Pérez-Beaupuits J. P., Aalto S., Gerebro H., 2007, A&A, 476, 177
- Schilke et al. (1992) Schilke P., Walmsley C. M., Pineau Des Forets G., Roueff E., Flower D. R., Guilloteau S., 1992, A&A, 256, 595
- Smith et al. (1979) Smith L. N., Malik D. J., Secrest D., 1979, J. Chem. Phys., 71, 4502
- Toczyłowski et al. (2001) Toczyłowski R. R., Doloresco F., Cybulski S. M., 2001, J. Chem. Phys., 114, 851
- (48) Walsmley C. M., Churchwell, E., Nash, A., & Fitzpatrick E., 1982, A&A, 258, L75
- Watts et al. (1993) Watts J. D., Gauss J., Bartlett R. J., 1993, J. Chem. Phys., 98, 8718
- Werner et al. (1989) Werner H.-J., Follmeg B., Alexander M. H., Lemoine D., 1989, J. Chem. Phys., 91, 5425
- Wernli et al. (2006) Wernli M., Valiron P., Faure A., Wiesenfeld L., Jankowski P., Szalewicz K., 2006, A&A, 446, 367
- Wernli et al. (2007a) Wernli M., Wiesenfeld L., Faure A., Valiron P., 2007a, A&A, 464, 1147
- Wernli et al. (2007b) Wernli M., Wiesenfeld L., Faure A., Valiron P., 2007b, A&A, 475, 391