Episodic Transient Gamma-Ray Emission from the Microquasar Cygnus X-1
Abstract
Cygnus X-1 (Cyg X-1) is the archetypal black hole (BH) binary system in our Galaxy. We report the main results of an extensive search for transient gamma-ray emission from Cygnus X-1 carried out in the energy range 100 MeV – 3 GeV by the AGILE satellite, during the period 2007 July – 2009 October. The total exposure time is about 300 days, during which the source was in the ”hard” X-ray spectral state. We divided the observing intervals in 24 week periods, and searched for transient and persistent emission. We report an episode of significant transient gamma-ray emission detected on 2009, October 16 in a position compatible with Cyg X-1 optical position. This episode, occurred during a hard spectral state of Cyg X-1, shows that a 1-2 day time variable emission above 100 MeV can be produced during hard spectral states, having important theoretical implications for current Comptonization models for Cyg X-1 and other microquasars. Except for this one short timescale episode, no significant gamma-ray emission was detected by AGILE. By integrating all available data we obtain a 2 upper limit for the total integrated flux of in the energy range 100 MeV – 3 GeV. We then clearly establish the existence of a spectral cutoff in the energy range 1–100 MeV that applies to the typical hard state outside the flaring period and that confirms the historically known spectral cutoff above 1 MeV.
Subject headings:
gamma rays: stars — stars: individual (Cygnus X-1) — X-rays: binaries1. Introduction
Cyg X-1 is a binary system (discovered by Bowyer et al. 1965) containing a O9.7 Iab supergiant star orbiting (5.6 days of period) around a compact star with a mass function of (Gies et al. 2008) and a mass lower limit in the range (Ziółkowski 2005). Cyg X-1 is then the only known high-mass black hole (BH) binary system in our Galaxy (e.g., Tanaka & Lewin 1995), and attracted considerable attention since its initial mass range determinations Bolton (1972); Webster & Murdin (1972). Being among the brightest X-ray binaries in our Galaxy (for a relatively small distance of 2 kpc and average sub-Eddington X-ray luminosity for a 10 solar mass compact object), the system has been extensively monitored in the radio, IR, UV and X-ray energy bands (see Zdziarski & Gierliński 2004 for a review).
The system spends most of its time in the so called ”hard state” characterized by a relatively low flux of soft X-ray photons (1–10 keV), a clear peak of the photon energy spectrum in the hard X-ray band (around 100 keV), and an energy cutoff around 1 MeV (e.g., Gierliński et al. 1997, McConnell et al. 2002, Del Monte et al., 2010). Occasionally, Cyg X-1 changes state shifting its energy power spectrum to a ”soft state” characterized by a large flux in soft X-rays, a lower hard X-ray flux, and a tail extending to energies up to 1 MeV and beyond McConnell et al. (2002). Cyg X-1 is also detected in ”intermediate hard states”, which usually show a less intense hard X-ray emission and a shift of the spectral hump towards energies less than 100 keV Malzac et al. (2006); Wilms et al. (2006).
Variability in Cyg X-1 above 100 keV was observed on several different time scales, from months to milliseconds (e.g. Brocksopp et al. 1999, Ling et al. 1997, Pottschmidt et al. 2003, Zdziarski & Gierliński 2004) and giant outburst episodes have been detected in the 15–300 keV by the Interplanetary Network Golenetskii et al. (2003) during both spectral states.
Theoretically, accretion processes onto a BH system are extensively studied using Cyg X-1 as a typical example. In particular, disk hydrodynamics and radiative and pair-creation properties of Cyg X-1 have been modeled with particular emphasis on the X-ray range and the highest detectable energies (e.g., Zdziarski 1988; Gierliński et al. 1999; Bednarek & Giovannelli 2007; Zdziarski, Malzac & Bednarek 2009). Extensive modelling of Cyg X-1 X-ray spectral states have been carried out using Comptonization models (e.g., Titarchuk 1994; Poutanen & Svensson 1996; Coppi 1999) and interpret the historical data available in the literature with a spectral cutoff near 1 MeV. Since the detection of a non-thermal power law spectral component extending up to MeV energies during the ”soft” and ”intermediate” states, the issue of determining the variability and highest photon energies from Cyg X-1 has been of crucial theoretical importance. A detection of photon emission well above a few MeV from Cyg X-1 would provide a clear signature of efficient non-thermal acceleration processes occurring in the system, that would need to be accounted for in Cyg X-1 models and BH accretion disk modelling.
Before the AGILE extensive monitoring of Cyg X-1, only temporally sparse information has been available in the energy range above a few MeV. The gamma-ray instruments on board of CGRO observed the Cygnus region several times (typically with 24 weeks long integrations) during the period 1991-1997. In particular, the EGRET instrument provided an overall upper limit to the flux of above 100 MeV. EGRET observations occurred always during ”hard” spectral state, and did not cover at all the ”soft” state.
The only observation of CGRO during a soft state of Cyg X-1 was carried out in June, 1996, following an X-ray alert provided by RXTE Cui et al. (1997). OSSE and COMPTEL observed Cyg X-1 from June 14 to June 25, 1997 and this led for the first time to the detection of a high energy power-law up to about 7 MeV McConnell et al. (2002). This indication of a power-law component extending to MeV and beyond was also supported in recent years by several INTEGRAL observations of Cyg X-1 Cadolle Bel et al. (2006).
A remarkable, although isolated, TeV flaring event of very high-energy emission above 300 GeV from Cyg X-1 was reported by the MAGIC Cherenkov telescope during a set of observations in 2006 Albert et al. (2007). The reported VHE emission (for a pre-trial significance above 4) was detected on 2006, September 24, for about 1 hour (corresponding to an orbital phase of 0.9) during a relatively bright hard X-ray emission phase. Simultaneous INTEGRAL data Malzac et al. (2008) show that the TeV flare from Cyg X-1 was detected day before an intense peak in hard X-rays. However, at the time of the TeV flare, both the soft and hard X-ray emission do not show significant variations or rapid state changes: the spectral state was a ”hard” one. This detection of transient and very rapid TeV emission from Cyg X-1 indicates that extreme particle acceleration processes may occur also during a hard spectral state, paving the way to detect non-thermal components also in states previosly believed to be characterized by a cutoff above a few MeV.
In this Letter we report the AGILE search for short (days-weeks) timescale gamma-ray emission from Cyg X-1 in the energy range 100 MeV – 3 GeV with a total exposure time of days, during the period 2007 July – 2009 mid-October. Our data provide the first long timescale monitoring for this important BH system. A separate paper (Del Monte et al. 2009) addresses the details of the X-ray emission as monitored by AGILE and other detectors during our first year of observations.
2. AGILE 2007-2009 Observations of Cygnus X-1 and data analysis
The AGILE mission has been operating since 2007 April (Tavani et al., 2008). The AGILE scientific instrument is very compact and is characterized by two co-aligned imaging detectors operating in the energy ranges 30 MeV – 30 GeV (GRID, Barbiellini et al. 2002, Prest et al. 2003) and 18–60 keV (Super-AGILE, Feroci et al. 2007), as well as by an anticoincidence system (Perotti et al., 2006) and a calorimeter (Labanti et al., 2006). AGILE’s performance is characterized by large fields of view (2.5 and 1 sr for the gamma-ray and hard X-ray bands, respectively) and optimal angular resolution (PSF= at 100 MeV and PSF= at 400 MeV). Flux sensitivity for a typical 1-week observing period can reach the level of several tens of above 100 MeV, and 10–20 mCrab in the 18–60 keV range depending on off-axis angles and pointing directions (see Tavani et al. 2008 for details about the mission and main instrument performance).
The AGILE satellite repeatedly pointed at the Cygnus region for a total of 315 days ( 13 Msec net exposure) during the period 2007 July – 2009 mid-October. The analysis of gamma-ray data presented in this paper was carried out with the AGILE-GRID FT3ab2Build18 calibrated filter with a gamma-ray event selection that takes into account South Atlantic Anomaly event cuts and 80∘ Earth albedo filtering. Throughout the paper, statistical significance assessment and source flux determination was established using the standard AGILE multi-source likelihood analysis software Chen et al. (2010). The method provides an assessment of the statistical significance in terms of a Test Statistic (TS) defined as in Mattox et al. 1996 and asymptotically distributed as a for 3 degrees of freedom ().
2.1. Search for persistent gamma-ray emission
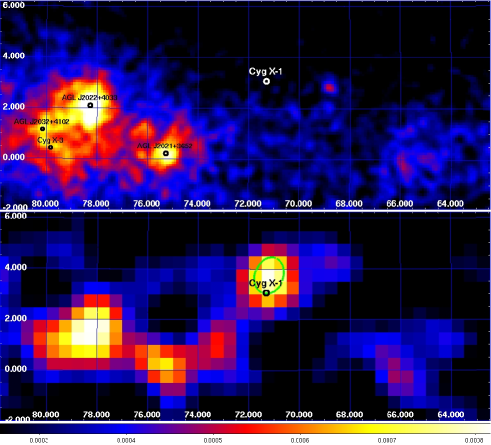
Multi-source likelihood analysis was used to search for persistent emission from Cyg X-1 position in the integrated sky map of the Cygnus region above 100 MeV for the period 2007 July – 2009 October (Fig 1, upper panel). The region is characterised by AGILE gamma-rays data showing two most prominent sources 1AGL J2022+4032 and 1AGL J2021+3652 detected with high confidence (38.8 and 24.6 respectively) and a gamma-ray flux and respectively Pittori et al. (2009). We also detect Cygnus X-3 (3.2, ; Tavani et al, 2009), and the nearby pulsar source 1AGL J2032+4102 (10.8, )222AGILE flux values are in agreement with the Fermi detections Abdo et al. 2009a for common sources.. No statistically significant gamma ray source is detected at a position consistent with that of Cyg X-1. The 2-sigma upper limit for the gamma-ray flux in the energy range 100 MeV – 3 GeV is equal to 3 .
Data integrations of 24 weeks exposure from single observation blocks give typical 2- upper limits in the range .
2.2. Search for transient gamma-ray emission
Motivated by the X-ray variability of Cyg X-1 and by the particular sequence of flaring gamma-ray emission from Cygnus X-3 Tavani et al. (2009), we carried out a systematic search for short (day) timescale variability of the Cyg X-1 gamma-ray emission. We used two independent and automatic methods for a blind search of candidate gamma-ray transients in the region surrounding Cyg X-1.
1.The AGILE-GRID multi-source Likelihood method. The standard analysis pipeline uses a multiple source likelihood analysis that iteratively optimizes position, flux and significance of each source by successive repetitions in which the parameters of one source are varied keeping all the others fixed. This method is very efficient for relatively strong sources and takes into account the Galactic diffuse emission and residual background Bulgarelli et al. (2008). It provides a pre-trial assessment of statistical significance that needs to be corrected when used in repeated systematic searches. For this reason we also developed an independent method, that takes into account multiple comparison corrections (see below).
2.The False Discovery Rate Method (FDRM). We developed a detection method based on the False Discovery Rate technique (FDR, Benjamini et al. 1995; Miller et al. 2001, Hopkins et al. 2002) that is a statistical test taking into account the corrections for multiple testing, as needed for example in repeated systematic searches. The FDRM allows to control the expected rate of false detections (due to background fluctuations) within a selected sample. The method was adapted to the analysis of AGILE gamma-ray data of the Galactic plane Sabatini et al. (2010). Given an observed distribution of background counts-per-pixel (the null hypothesis), the selection is based on choosing pixels characterized by -values333Given a statistical distribution, a ”-value” assigned to a given value of a random variable is defined as the probability, when the null hypothesis is true, of obtaining that value or larger. smaller than a threshold, . The crucial FDRM feature is that a -value threshold is not fixed a priori (as in traditional statistical methods), but is estimated on the data with the requirement that the rate of false detections, within the selected sample, is the chosen or smaller. A typical value used in the literature Miller et al. (2001); Hopkins et al. (2002), and that we adopt as a starting value for our search, is =0.05. The FDRM ensures to control this rate, while accounting for the ’post-trial’ correction of a single detection significance Benjamini & Hochberg (1995). We apply the FDRM in two different ways.
The global-FDRM (G-FDRM): in this case we carry out a blind search for (persistent or transient) sources in large (global) daily counts maps of the Galactic plane ( pixel size). The null hypothesis for these daily maps is the (background dominated) counts distribution of the Galactic plane (). The random fluctuations and the diffuse gamma-ray emission of these daily maps are well described by Poissonian distributions in AGILE-GRID data. Candidate sources in the daily maps are identified as significant deviations from the average distribution that applies to that specific day. In our analysis we use a threshold of that limits the contamination by false positive sources in the sample below 5.
The source-FDRM (S-FDRM): the S-FDRM searches for flaring episodes in the counts’ light curve extracted from the position of a single candidate source location. In the (verified) assumption that the average source flux at a given position is typically below the instrument sensitivity, unless it is producing (rare) flares, the null hypothesis in this case is obtained by measuring the distribution of photon counts for the specific sky location observed at intervals of 1-day. We considered the nominal Cyg X-1 position and used an aperture search radius of 1.5∘. As in the case for G-FDRM, candidate flaring sources are detected as deviations from the Poissonian average distribution, i.e. fluctuations with value below the chosen threshold.
3. The gamma-ray flare of October 15-16, 2009
All of the available AGILE data in the archive from 2007 June to 2009 mid-October were searched for variability on timescales of 1-day with both the Likelihood and FDR methods. We used only data within 40∘ from the pointing direction and removed all data affected by non-nominal satellite pointings. In this Letter we consider only candidates with at least 5 pre-trial significance. Only one gamma-ray flaring episode was definitely detected in our thorough search by both independent methods. The bottom panel of Fig 1 shows the AGILE gamma-ray intensity map above 100 MeV for this episode. The emission peaked during the time interval 2009 October, 15 (UTC 23:13:36) to 2009 October, 16 (UTC 23:02:24). The AGILE-GRID multi-source likelihood analysis finds a TS=28.09 (=5.3 pre-trial, 4 post-trial444This corresponds to a value of (pre-trial) and (post-trial). , according to distribution and multiple testing correction) detection at the position (l,b)=71.2, 3.8 0.7 (stat) 0.1 (syst) consistent with the position of Cyg X-1, for a gamma-ray flux of in the energy range 100 MeV – 3 GeV. The detection is validated by both FDR methods: the G-FDRM analysis finds the source with and the S-FDRM analysis with a highly significant . G-FDRM detection has a lower significance due to the use of an average background distribution which in this case overestimates the local background. For comparison, during the same time interval the source 1AGL J2022+4032 (Pittori et al. 2009), apparently coincident with the SNR Gamma-Cygni, is detected with 3.1 significance with the likelihood analysis (and ), and a flux of . The Super-AGILE (18–60 keV) flux for Cyg X-1 for the day is mCrab and the ASM flux is mCrab in the 2–12 keV range. The spectral state of the source was determined by means of the colour-colour diagram obtained from ASM data as discussed in Del Monte et al. 2010. Interestingly the flaring episode (MJD= 55120) occurred during a hard spectral state. The orbital phase of Cyg X-1 was in the range 0.38-0.56. The system was detected to subsequently evolve into one of the relatively rare dips of the hard X-ray light curve.
4. Discussion
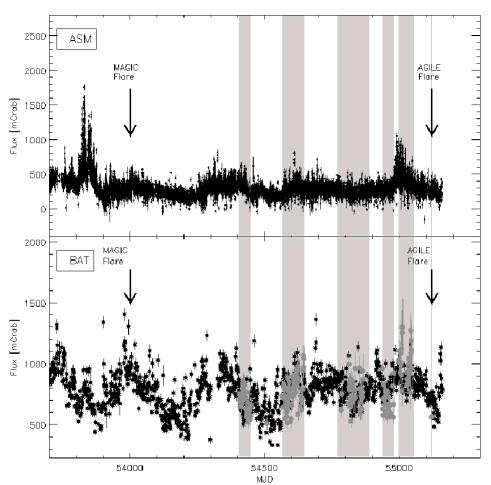
Fig 2 shows the X-ray historical light curves of Cyg X-1 from 2005 November: the upper panel reports the RXTE/ASM data, and the lower panel the Swift/BAT data, superimposed with the Super-AGILE data from 2007 November (gray dots). Gray zones highlight AGILE pointings of the Cygnus region. The ASM data show that after MJD 53900 the system did not undergo clear transitions to one of its soft states anymore. The Swift/BAT hard X-ray data are available for the last 4 years and show a pattern with rare dips occurring almost once a year.
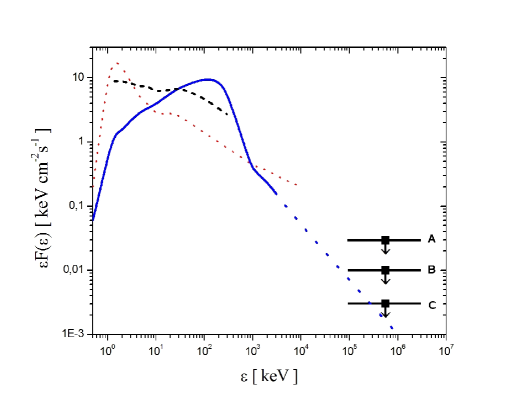
The AGILE dataset extends for 300 days, during which the system was in its typical hard X-ray state Del Monte et al. (2010). The lack of relatively strong gamma-ray emission on a timescale of weeks together with the deep upper limit obtained by integrating all AGILE-GRID data clearly confirms the existence of a spectral cutoff between 1 and 100 MeV in the typical hard state. Fig. 3 (upper panel) shows the spectral energy distribution of Cyg X-1 with its typical historical spectral states In the same figure, typical AGILE upper limits are given for 2-, 4-weeks and days integrations. This gamma-ray average spectral behaviour of Cyg X-1 in the hard state during week-month timescales is in overall agreement with Comptonization models of black hole candidates (e.g., Titarchuk 1994; Poutanen & Svensson 1996; Coppi 1999) and more specifically of Cyg X-1 (Gierliński et al. 1997; McConnell et al. 2002).
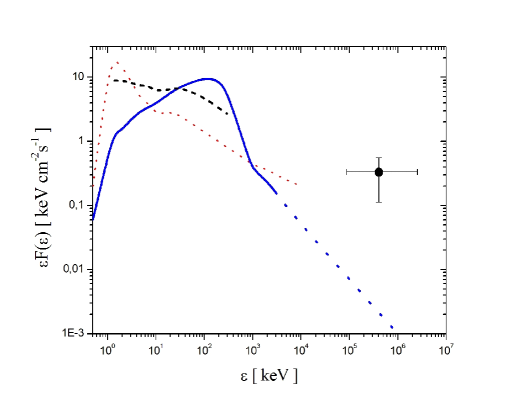
However, our detection of October 16, 2009 is the first reported 1-day gamma-ray flare in the energy range 100 MeV – 3 GeV from the system during a hard state. This shows that physical processes can occasionally be more complex than predicted by current models. The lower panel of Fig. 3 shows the AGILE-GRID gamma-ray detection during such flare together with the spectral shapes characterizing the different spectral states for reference. Efficient particle acceleration occurs also in states characterized by the presence of a hot corona that should be in pair-Comptonized equilibrium (e.g., Zdziarski 1988; Zdziarski et al. 2009). The gamma-ray emission can have leptonic or hadronic origin (e.g., Perucho & Bosch-Ramon 2008), depending on the model as well as on the assumptions on the acceleration site (close or far from the inner disk and/or jet). Lack of simultaneous TeV data prevents a more complete spectral analysis of the gamma-ray flaring event. We note that the TeV spectrum reported by MAGIC occurred also during a hard state and having a photon spectral index Albert et al. (2007) is in qualitative agreement with our AGILE spectral detection555 The gamnma-ray detection has a flux about a factor three above the model of Zdziarski et al. 2009., even though the broad-band spectrum may be complex and have several independent components. A theoretical analysis of our results is well beyond the scope of this paper.
5. Conclusions
AGILE extensive monitoring of Cyg X-1 in the energy range 100 MeV – 3 GeV during the period 2007 July – 2009 October confirmed the existence of a spectral cutoff between 1–100 MeV during the typical hard spectral state of the source. However, even in this state, Cyg X-1 is capable of producing episodes of extreme particle acceleration on 1-day timescales. Our first detection of a gamma-ray flare above 100 MeV adds to the even shorter detection in the TeV range by MAGIC. These data have great relevance for a more detailed theoretical modeling of pair equilibrium Comptonized coronae and non-thermal particle acceleration that may co-exist for short timescales of order of hours-days.
We note that the gamma-ray flaring activity detected by AGILE from Cyg X-1 during its decreasing trend of hard X-ray emission is qualitatively similar (transition to a hard x-ray minimum) to what observed in the case of the other microquasar Cygnus X-3 Tavani et al. (2009); Abdo et al. 2009b . Whether this behavior is common to microquasars and BH accreting systems is a fascinating question that will be addressed by future observations.
6. Acknowledgements
We thank the anonymous referee for the contribution to the improvement of our manuscript. The AGILE mission is funded by the Italian Space Agency with scientific and programmatic participation by the Italian Institute of Astrophysics and the Italian Institute of Nuclear Physics.
References
- (1) Abdo A.A. et al., 2009, ApJS,183, 46A
- (2) Abdo A.A. et al., 2009, Science, 326, 1512
- Albert et al. (2007) Albert J. et al, 2007, ApJ, 665, L51
- Barbiellini et al. (2002) Barbiellini G. et al, 2002, NIM A, 490, 146
- Bednarek & Giovannelli (2007) Bednarek, W. & Giovannelli, F., 2007, A&A, 464, 437
- Belloni (2009) Belloni, T.M., 2009, to appear in Belloni, T. (ed.): The Jet Paradigm - From Microquasars to Quasars, Lecture Notes Phys. 794; arXiv:0909.2474
- Benjamini & Hochberg (1995) Benjamini Y., & Hochberg, Y., 1995, J. R. Stat. Soc. B, 57, 289
- Bolton (1972) Bolton, C.T., 1972, Nature, 235, 271
- Bowyer et al., (1965) Bowyer, S.C., Byram, E. T., Chubb, T. A., Friedman, M., 1965, Science, 147, 394
- Brocksopp et al. (1999) Brocksopp C. et al, 1999, MNRAS, 309, 1063
- Bulgarelli et al. (2008) Bulgarelli et al, 2008, in Astronomical Data Analysis Software and Systems XVIII, ASP Conference Series, Vol XXX
- Cadolle Bel et al. (2006) Cadolle Bel et al, 2006, A&A, 446, 591
- Chen et al. (2010) Chen et al, 2010, in preparation
- Coppi (1999) Coppi, P.S., 1999, in High Energy Processes in Accreting Black Holes, ASP Conference Series 161, ed. J. Poutanen & R. Svensson, p.375
- Cui et al. (1997) Cui et al., 1997, ApJ, 474, L57
- Del Monte et al. (2010) Del Monte E., et al., 2010,A&A, submitted
- Feroci et al. (2007) Feroci M., et al., 2007, NIM A, 581, 728
- Gierliński et al. (1997) Gierliński, M. et al., 1997, MNRAS, 288, 958
- Gierliński et al. (1999) Gierliński, M., Zdziarski, A.A., Poutanen, J., Coppi, P.S., Ebisawa, K. & Johnson, W.N., 1999, MNRAS, 309, 496
- Gies & Bolton (1986) Gies D.R. & Bolton C.T., 1986, ApJ, 304, 371
- Gies et al. (2008) Gies D.R. et al., 2008, ApJ, 678, 1237
- Golenetskii et al. (2003) Golenetskii S. et al, 2003, ApJ, 596, 1113
- Hopkins et al. (2002) Hopkins, A.M., et al., 2002, AJ, 123, 1086
- Labanti et al. (2006) Labanti C. et al., 2006, proc SPIE, 6266, 62663
- Ling et al. (1997) Ling J.C., et al., 1997, ApJ, 484, 375
- Malzac et al. (2006) Malzac J. et al, 2006, A&A, 448, 1125
- Malzac et al. (2008) Malzac J. et al, 2008, A&A, 492, 527
- McConnell et al. (2000) McConnell M.L. et al., 2000, ApJ, 543, 928
- McConnell et al. (2002) McConnell M.L. et al., 2002, ApJ, 572, 984
- Miller et al. (2001) Miller C.J. et al., 2001, ApJ, 122, 349
- Perotti et al. (2006) Perotti F. et al, 2006, MIN A, 556, 228
- Perucho & Bosh Ramon (2008) Perucho M. & Bosh-Ramon V., 2008, A&A, 482, 917
- Pittori et al. (2009) Pittori, C., e al., 2009, A&A, 506, 1563
- Poutanen & Svensson (1996) Poutanen, J. & Svensson, R., 1996, ApJ, 470, 249
- Pottschmidt et al. (2003) Pottschmidt et al, 2003, A&A, 407, 1039
- Prest et al. (2003) Prest M. et al. 2003, NIM A, 501, 280
- Sabatini et al. (2010) Sabatini et al, 2010, in preparation
- Tanaka & Lewin (1995) Tanaka Y. & Lewin, W.H.G., 1995, in X-Ray Binaries, edited by W.H.G. Lewin, J. van Paradijs, E.P.J. van den Heuvel (Cambridge, Cambridge University Press), p. 126
- Tavani et al. (2008) Tavani, M., et al. 2008, A&A, 502, 995
- Tavani et al. (2009) Tavani, M., et al. 2009, Nature, 462, 620
- Titarchuk (1994) Titarchuk, L., 1994, ApJ, 434, 570
- Webster & Murdin (1972) Webster, B.L., & Murdin, P., 1972, Nature, 235, 37
- Wilms et al. (2006) Wilms, J., Nowak, M. A., Pottschmidt, K., Pooley, G. G., Fritz, S., 2006, A&A, 447, 245
- Zdziarski (1988) Zdziarski, A .A., 1988, ApJ, 335, 786
- Zdziarski et al. (2002) Zdziarski, A. A., Poutanen J., Paciesas W. S., Wen L., 2002, ApJ, 578, 357
- Zdziarski & Gierliński (2004) Zdziarski, A. A. & Gierliński, M., 2004 Prog. Theor. Phys. Suppl., No. 155, 99
- Zdziarski, Malzac & Bednarek (2009) Zdziarski, A .A., Malzac, J., & Bednarek, W., 2009, MNRAS, 394, L41
- Ziółkowski (2005) Ziółkowski J., 2005, MNRAS, 358, 851