The High-Density Ionized Gas in the Central Parsecs of the Galaxy
Abstract
We report the results from observations of H30 line emission in Sgr A West with the Submillimeter Array at a resolution of 2′′ and a field of view of about 40′′. The H30 line is sensitive to the high-density ionized gas in the minispiral structure. We compare the velocity field obtained from H30 line emission to a Keplerian model, and our results suggest that the supermassive black hole at Sgr A* dominates the dynamics of the ionized gas. However, we also detect significant deviations from the Keplerian motion, which show that the impact of strong stellar winds from the massive stars along the ionized flows and the interaction between Northern and Eastern arms play significant roles in the local gas dynamics.
Harvard-Smithsonian Center for Astrophysics, 60 Garden Street, MS 78, Cambridge, MA 02138
Institut de Radio Astronomie Millimétrique, 38406 Saint Martin d’Hères, France
Department of Astronomy, University of Chicago, Chicago, IL 60637
1. Introduction
The Galactic Center harbors a supermassive black hole (SMBH) with a mass of M⊙ at the position of Sgr A* (Ghez et al. 2008; Gillessen et al. 2009). Previous radio recombination line studies (Schwarz, Bregman, & van Gorkom 1989; Roberts & Goss 1993; Roberts, Yusef-Zadeh, & Goss 1996) revealed complex structures of ionized gas around Sgr A*, including the “minispiral” and “Bar.” Parts of these structures have been modeled as gas orbiting Sgr A* (Schwarz, Bregman, & van Gorkom 1989; Sanders 1998; Paumard, Maillard, & Morris 2004; Vollmer & Duschl 2000; Liszt 2003; Zhao et al. 2009) while other parts of the structures may be gravitationally unbound (Yusef-Zadeh et al. 1998). In particular, the strong stellar winds from the clusters of massive stars in the vicinity of Sgr A*, with the help of gravitational focusing, create large-scale, unbound features (Lutz, Krabbe, & Genzel 1993). There are a number of difficulties in existing line observations of these structures. In the cm–radio maps from the Very Large Array (VLA), the recombination line strength is low, the line-to-continuum ratio is low, the bandwidth coverage is limited or irregular, and it is especially difficult to detect high-velocity line wings. In the IR, the picture given by the emission lines from the ionized gas is distorted, because of high obscuration by dust. In this paper, we summarize the main results from our observations of the H30 line at 1.3 mm with the SMA from three array configurations, the combination of which provides an angular resolution of 2′′.
2. Distribution of the High-Density Ionized Gas
Figure 1 presents the image integrated H30 line emission observed in the central 1.5 parsecs, showing the Northern and Eastern arms of the minispiral. The Western Arc does not shown well in our image in the H30 line since most of the line emission is below the 4 sensitivity cutoff. The H30 line spectra are shown toward selected regions with IR sources. A detailed comparison of the H30 line spectra and the H92 line spectra observed with the VLA yields line ratios of H30/H92 in most of the regions that are close to the frequency ratio , suggesting that the ionized gas in the central parsecs is optically thin and under LTE conditions. In some regions, however (e.g., IRS 1W and 10W), the line ratios are significantly smaller than the LTE value.
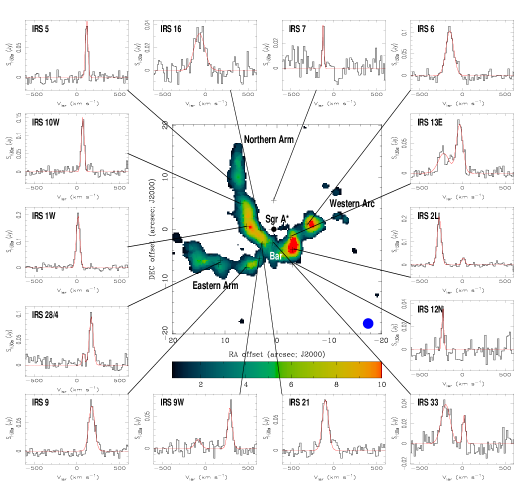
To assess the physical conditions of the ionized gas, we have also fit a model to the observed lines based on the assumption that the HII sources are isothermal and homogeneous. The derived typical electron densities in the HII clumps are 5–10 cm-3, consistent with the values ( cm-3) derived from Pa line emission at 1.87 m (Scoville et al. 2003) for a given uncertainty in extinction corrections in the near IR. The typical electron temperature in the minispiral arms is 5000–7000 K, in good agreement with the previous determination from H92 (Roberts & Goss 1993). The highest density of cm-3 occurs in the IRS 13E region while the highest temperatures of up to 13000 K were found in the Bar. Both the H30 and H92 line profiles are broadened due to the large velocity gradients along the line of sight and across the 2′′ beam produced by the large dynamical motions near Sgr A*. For the H92 line, the line width due to pressure broadening appears to be comparable to that of thermal Doppler broadening while for the H30 lines, the pressure broadening is negligible.
3. Kinematics and Dynamics
Figure 2a shows the image of radial velocities determined from fitting the peak velocities of the H30 line in the central 40′′, showing large velocity gradients along the Northern and Eastern arms. The observed radial velocity field is, in general, consistent with that predicted from a Keplerian model (Zhao et al. 2009), suggesting that the SMBH at Sgr A* governs the dynamics of the ionized gas. However, in several regions, the observed kinematics deviate significantly from those predicted from the Keplerian model, as described below.
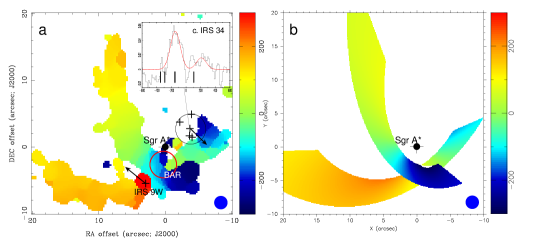
IRS 34: In the northwest end of the Eastern Arm, a kinematic feature with radial velocity of up to km s-1 shows a large deviation from the value of km s-1 predicted from the Keplerian model (see Figure 2b). Near this region, there is a group of Wolf-Rayet (WR) stars, evolved from early-type O stars with a mass loss rate of 10-5 M⊙ yr-1. The suspected strong stellar winds from these massive stars may play a considerable role in the local kinematics.
IRS 9W: In the “tip” region (Paumard, Maillard, & Morris 2004), a peculiar radial velocity of +300 km s-1 was detected from our H30 observations, showing a large deviation from the radial velocity of +150 km s-1 predicted from the Keplerian model. The impact of the strong stellar wind from the IRS 9W star (WN8) on the orbiting ionized flow in the Eastern Arm is likely responsible for the high velocity of the tip.
The Bar: Deviations from Keplerian motion are also observed in the Bar region. These non-Keplerian kinematics could be attributed to the interaction between the ionized flows in both Northern and Eastern arms and the interaction of ionized flows with the strong winds from the massive star clusters, e.g., IRS 16 and 13.
Finally, in the locations with large offsets from Sgr A*, we noticed that the deviations in radial velocity from the Keplerian motions become significant for the Northern Arm ( 50 km s-1) while for the Eastern Arm the deviations are less significant. The difference in the deviation of the observed radial velocities from the Keplerian velocities between the Northern and Eastern arms might suggest that the distribution of mass has a preference for the plane of the circumnuclear disk, which is coplanar with the orbit of the Northern Arm flow.
References
- Ghez et al. (2008) Ghez, A. M., et al., 2008, ApJ, 689, 1044
- Gillessen et al. (2009) Gillessen, S., et al., 2009, ApJ, 692, 1075
- Liszt (2003) Liszt, H. S., 2003, A&A, 408, 1009
- Lutz, Krabbe, & Genzel (1993) Lutz, D., Krabbe, A., & Genzel, R., 1993, ApJ, 418, L244
- Paumard et al. (2006) Paumard, T., et al., 2006, ApJ, 643, 1011
- Paumard, Maillard, & Morris (2004) Paumard, T., Maillard, J. P., & Morris, M., 2004, A&A, 426, 81
- Roberts & Goss (1993) Roberts, D. A. & Goss, W. M., 1993, ApJS, 86, 133
- Roberts, Yusef-Zadeh, & Goss (1996) Roberts, D. A., Yusef-Zadeh, F., & Goss, W. M., 1996, ApJ, 459, 627
- Sanders (1998) Sanders, R. H., 1998, MNRAS, 294, 35
- Schwarz, Bregman, & van Gorkom (1989) Schwarz, U. J., Bregman, J. D., & van Gorkom, J. H., 1989, A&A, 215, 33
- Scoville et al. (2003) Scoville, N. Z., et al., 2003, ApJ, 594, 294
- Vollmer & Duschl (2000) Vollmer, B. & Duschl, W.J., 2000, New Astronomy, 4, 581
- Yusef-Zadeh et al. (1998) Yusef-Zadeh, F., Roberts, D. A., Biretta, J., 1998, ApJL, 499, L159
- Zhao et al. (2009) Zhao, J.-H., Morris, M. R., Goss, W. M., & An, T., 2009, ApJ, 699, 186