Ultraluminous X-ray sources out to z in the COSMOS field.
Abstract
Context. Using Chandra observations we have identified a sample of seven off-nuclear X-ray sources, in the redshift range z=0.072-0.283, located within optically bright galaxies in the COSMOS Survey. All of them, if associated with their closest bright galaxy, would have L keV erg s-1 and therefore can be classified as ultraluminous X-ray sources (ULXs).
Aims. Using the multi-wavelength coverage available in the COSMOS field, we study the properties of the host galaxies of these ULXs. In detail, we derived their star formation rate from H measurements and their stellar masses using SED fitting techniques with the aim to compute the probability to have an off-nuclear source based on the host galaxy properties. We divide the host galaxies in different morphological classes using the available ACS/HST imaging.
Methods. We selected off-nuclear candidates with the following criteria: 1) the distance between the X-ray and the optical centroid has to be larger than 0.9″, larger than 1.8 times the radius of the Chandra positional error circle and smaller than the Petrosian radius of the host galaxy; 2) the optical counterpart is a bright galaxy (R22); 3) the redshift of the counterpart is lower than z; 4) the source has been observed in at least one Chandra pointing at an off-axis angle smaller than 5′; 5) the X-ray positional error is smaller than 0.8″. We verified each candidate super-imposing the X-ray contours on the optical/IR images. We expect less than one misidentified AGN due to astrometric errors and on average 1.3 serendipitous background source matches.
Results. We find that our ULXs candidates are located in regions of the SFR versus M⋆ plane where one or more off-nuclear detectable sources are expected. From a morphological analysis of the ACS imaging and the use of rest-frame colours, we find that our ULXs are hosted both in late and early type galaxies. Finally, we find that the fraction of galaxies hosting a ULX ranges from to going from L erg s-1 to L erg s-1.
Key Words.:
Xrays: galaxies – X-rays: binaries – X-rays: general – Surveys
1 Introduction
An intriguing class of X-ray objects are the so called ultraluminous
X-ray sources (ULXs). Here an ULX is defined as an X-ray source in an
extra-nuclear region of a galaxy with an observed luminosity in excess
of erg s-1 in the 0.5-7 keV band. Such X-ray
luminosities are higher than expected for spherical Eddington-limited
accretion onto a black hole. ULXs were known already
from studies with Einstein, ROSAT, and ASCA (e.g. Fabbiano 1989; Colbert & Ptak 2002; Makishima et al. 2000), but it was after the advent of Chandra
with its combination of high angular resolution and moderate spectral
resolution that has been possible to make significant progresses in
their study (e.g. Roberts et al. 2004; Swartz et al. 2004). There is a wide
debate in the literature on the nature of these sources. ULXs may be
powered by accretion onto stellar-mass black holes assuming that there
is relativistic beaming (e.g. Körding et al. 2002), or radiative
anisotropy (e.g. King 2002), or they may be associated with
super-Eddington discs (e.g. Begelman 2002). It has been also
suggested that ULXs represent a new class of intermediate-mass
( M⊙) black holes
(e.g. Colbert & Mushotzky 1999; Miller & Colbert 2004). These intermediate-mass black
holes may be fed by Roche lobe overflow from a tidal captured stellar
companion that is not destroyed by tidal heating
(Hopman et al. 2004). Off-nuclear AGN activity could be also a
signature of a recoiling massive black hole: a massive black hole
binary coalesces and gives origin to gravitational waves which can
give a kick to the center of mass of the system. If the recoiling
black hole retains the inner parts of its accretion disk, we could see
its luminous phase as an off-nuclear AGN (see Volonteri & Madau 2008
and references therein). Finally, ULXs could also be the
high-luminosity extension of supernovae
(e.g. Swartz et al. 2004).
Many of the previous studies based on
Chandra data are focused on local galaxies, where the Chandra angular
resolution allows to detect several off-nuclear sources in one single
galaxy. In this paper, we select a sample of ULXs from the Chandra
survey in the COSMOS field. We have here the advantage to combine deep
X-ray observation with a wealth of multiwavelength ancillary data that
we will use to put constraints on the nature of these sources and on
the properties of their host galaxies. The redshift range that we are
covering is up to . A study on off-nuclear sources in a
similar redshift range was performed by Lehmer et al. (2006) on the
Chandra Deep Fields (CDFs).
We quote in this paper magnitudes in the
AB system and we assume a cosmology with H km s-1
Mpc-1, and .

2 Sample selection
We have selected off-nuclear X-ray candidates from the Chandra COSMOS Survey (C-COSMOS), which is a recently completed 1.8 Ms Chandra program to image the central 0.9 deg2 of the COSMOS field with an effective exposure ranging from ksec to ksec going from the center to the borders of the field (Elvis et al. 2009). The limiting source detection depths are erg cm-2 s-1 in the [0.5-2 keV] band, erg cm-2 s-1 in the [2-10 keV] band, and erg cm-2 s-1 in the [0.5-10 keV] band. We used a point source catalogue including 1761 objects detected in at least one band (0.5-2, 2-7 and 0.5-7 keV) with a maximum likelihood ratio larger than detml, corresponding to a probability of that a catalog source is instead a background fluctuation (Puccetti et al. 2009). The optical and infrared identifications of almost all () of the sources are reported in Civano et al. (2010)111The ULX candidates presented in this paper are flagged as ’off-nuclear’ sources in Civano et al. (2010)..
As a first step to select off-nuclear X-ray sources, we verified the X-ray position accuracy that we have in the C-COSMOS observations following the procedure presented in Sec. 4.3 of Puccetti et al. (2009). A set of 49 Chandra ACIS-I pointings has been simulated with the MARX222http://space.mit.edu/CXC/MARX. simulator, adopting the same exposure times, aim points, and roll-angles as the real C-COSMOS pointings. The detection code PWDetect (Damiani et al., 1997) was applied to the simulated data. We then compared the output of the detection algorithm with the input catalogue of the simulation. In Fig. 1, we show the distribution of the difference between the detection algorithm positions and the input positions in units of the X-ray positional error. The latest has been estimated as the ratio of the PSF at the position of the source and the square root of the net, background subtracted, source counts. In comparison with Fig. 10 of Puccetti et al. (2009), we have restricted the analysis only to sources that have been detected at least in one image at an off-axis angle smaller than 5′ to take advantage of an excellent PSF. From the distribution in Fig. 1, we find that of the sources have offsets below 1.8 times the positional error. We will adopt this value as a threshold to select off-nuclear candidates and therefore we expect that up to of our sample is contaminated by nuclear X-ray sources with large astrometric errors. We will shortly come back to this issue. Another possible source of spurious off-nuclear objects could be a poor astrometric accuracy of the X-ray images. According to Fig. 6 of Elvis et al. (2009), of the Chandra sources have an absolute astrometric accuracy better than 1.4″. For our study we aim at even better astrometric accuracy, therefore we have considered only the X-ray sources with an X-ray positional error smaller that 0.8″. We show the comparison between X-ray coordinates and optical coordinates for sources with a secure identification in Fig. 2: of the X-ray sources have an absolute astrometric accuracy better than 0.9″.
Summarizing, the off-nuclear candidates were selected using the following criteria:
-
a)
The distance between the X-ray centroid and the optical centroid has to be larger than 1.8 times the radius of the Chandra positional error circle at that position.
-
b)
The X-ray positional error is smaller than 0.8″.
-
c)
The source has been observed in at least one Chandra pointing at an off-axis angle smaller than 5′.
-
d)
The optical counterpart is a bright galaxy (R22).
-
e)
The redshift of the host galaxy is less than z=0.3. The projected linear distance corresponding to an average Chandra positional error is kpc at z=0.3. This means we will consider only off-nuclear candidates that are more than kpc away from the center of the galaxy at z=0.3. At larger redshifts we would be able to select only off-nuclear candidates that are at larger distances ( kpc) from the host galaxy center, where the number of observed off-nuclear sources seems to decrease (Swartz et al. 2004) and we would be more affected by the contamination of background objects. Therefore we limit our sample to z.
-
f)
The distance between the X-ray centroid and the optical centroid is larger than 0.9″and smaller than the Petrosian radius (Petrosian 1976, RP333RP is defined as the radius at which the ratio (rP) of the local surface brightness at that radius and the mean surface brightness within that radius equals some specified value rP,lim. For a surface brightness distribution described by a de Vaucouleurs or an exponential profile, a value r is reached at R R1/2 and R R1/2, respectively (R1/2 is the half-light radius of the galaxy, see Fig. 17 of Scarlata et al. 2007). ) of the galaxy, which we use as a measure of the galaxy’s extension.
If we consider the selection criteria b), c), d), and e), only sixteen sources from the C-COSMOS catalogue satisfy all of them. Based on our previous discussion of Fig. 1 we expect up to of our sample to be due to nuclear X-ray sources with large astrometric errors, therefore we can conclude that our sample of ULXs contains less than one misidentified AGN.
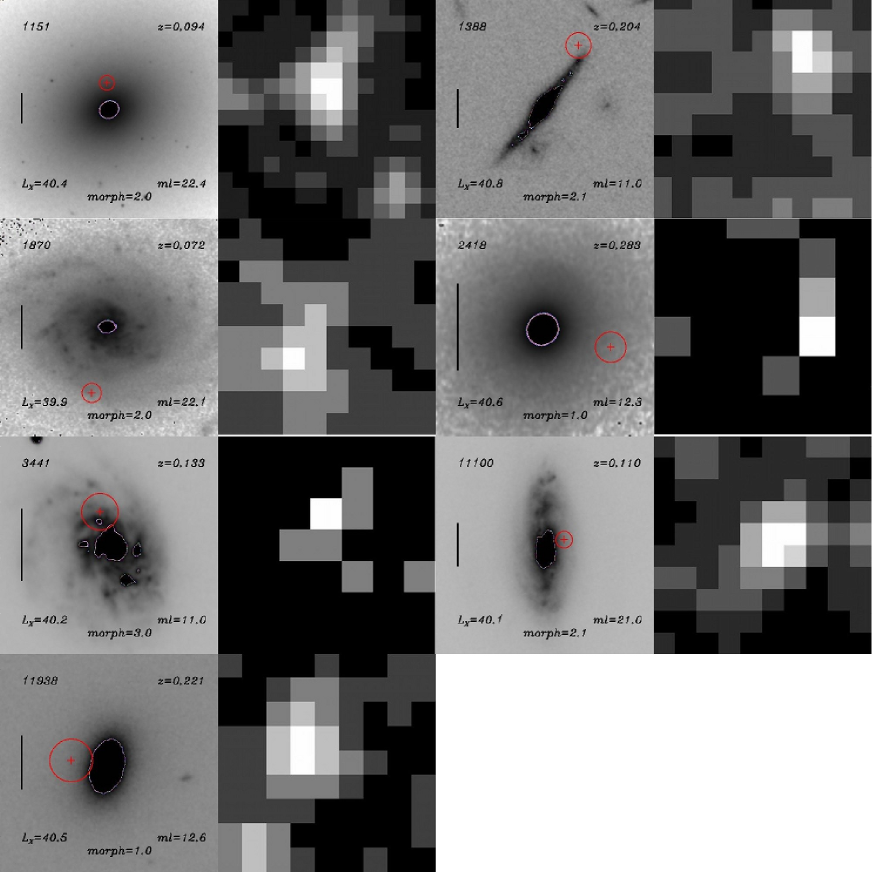
For all the candidates provided by these selection criteria we have verified that no other counterpart closer to the Chandra position was present in any band from the ( nm) filter to 24 micron. After this one-by-one check, we were left with seven off-nuclear source candidates. Cutouts of these objects, obtained from the COSMOS HST/ACS F814W imaging (Koekemoer et al. 2007), are shown in Fig. 3, together with the corresponding Chandra [0.5-7 keV] image.
Each one of our off-nuclear sources has an estimate of the X-ray flux
in the [0.5-7] keV band reported in Elvis et al. (2009). These fluxes are
derived from the counts estimated by
EMLdetect444http://xmm.esac.esa.int/sas/8.0.0/emldetect,
corrected to an area including of the PSF
(Puccetti et al., 2009). In some cases such an area is large enough to
include the whole host galaxy and therefore the X-ray flux could be
the total integrated flux of the host galaxy itself. This would
include the contribution from the population of X-ray binaries in the
host, emission from diffuse gas and a possible weak central AGN. In
order to estimate these possible contaminations on the measured X-ray
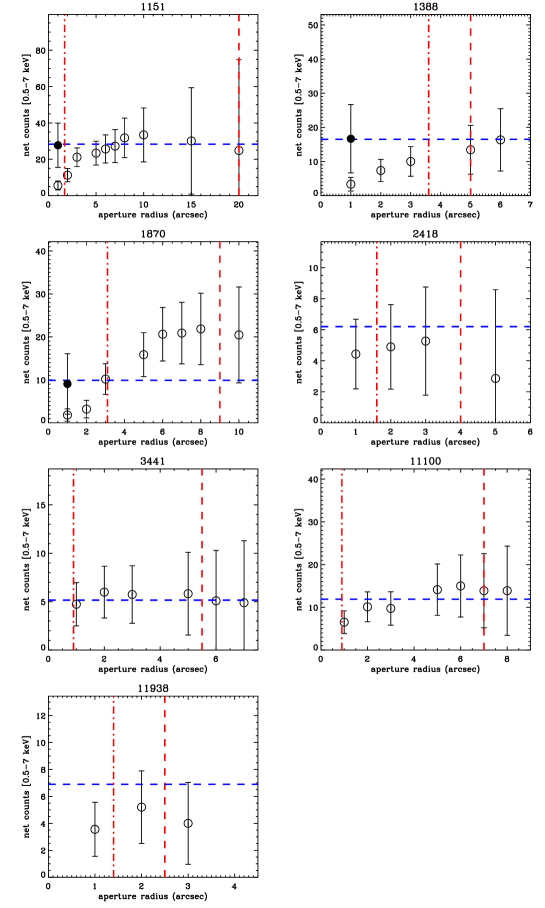
fluxes, we have performed aperture photometry for each off-nuclear
source. The radii of the apertures have been chosen with increasing
size from a minimum of 1″ up to include the whole galaxy. In
Fig. 4, we plot the net counts in the [0.5-7] keV band
as a function of the aperture radius. For four of our sources (XID=
2418, 3441, 11100, 11938) the counts measured at different apertures
are constant within the uncertainties. Therefore, we assume that the
contribution of the host galaxy is not significant compared with the
uncertainties on the measure. For the remaining three sources (XID=
1151, 1388, 1870) the counts rise with the aperture radius and there
may be a significant contamination due to the integrated flux of the
whole galaxy. In order to minimize this contamination, we have
considered the measured counts in the smaller aperture (1″). We have then used the known PSF shape at the position of the
source to estimate the expected fraction between the counts measured
in an aperture of 1″and the ones over an area corresponding to
of the PSF. We have then used this ratio to convert our
measured counts on the 1″aperture into the expected ones on a
PSF area. These corrected counts are indicated with a filled
circle in the plots of Fig. 4, and we have used them in
order to estimate the X-ray fluxes.
Full band 0.5-7 keV fluxes and
errors were computed converting counts rates to fluxes using the
formula: Flux=Brate/(CF), where Brate is the
count rate estimated as described above, and CF is the energy
conversion factor. This conversion factor varies with the energy band
and the spectral index assumed for the power-law
spectrum. We have used the correction factor CF counts
erg-1 cm2 reported in Tab. 4 of Elvis et al. (2009) obtained for
the 0.5-7 keV band and . We decided for this average
value of the spectral index following the study of Swartz et al. (2004)
that has found a mean power-law index of for a
sample of 154 ULX candidates observed with Chandra. We finally report
on Tab. 1 the 0.5-7 keV luminosities and errors for the
seven off-nuclear sources. All sources have luminosities well in
excess of erg s-1 in the 0.5-7 keV band (the lowest
X-ray luminosity in this band is erg
s-1) and are therefore classified as ULX sources, using either
spectroscopic or photometric redshifts.
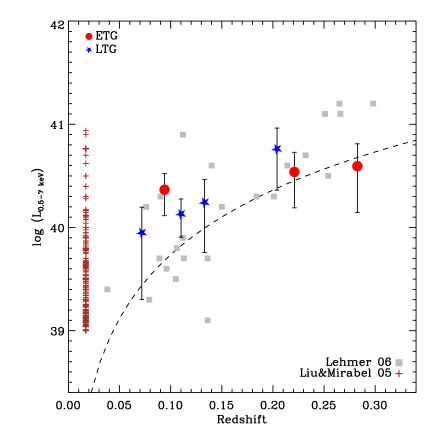
We have secure spectroscopic redshifts for four host galaxies from zCOSMOS VIMOS observations at VLT (Lilly et al. 2007, 2009). For the remaining three objects we have used the extremely accurate photometric redshifts available in the COSMOS field (Ilbert et al. 2009; Salvato et al. 2009) based on 30 broad, intermediate, and narrow bands from the UV to the mid-IR. We show in Fig. 5 the X-ray luminosity in the [0.5-7] keV band versus redshift of the seven ULXs. The X-ray luminosities were computed according to the formula:
| (1) |
where is the luminosity distance, is the X-ray flux in the [0.5-7] keV band, and is the X-ray photon index. We assumed (see discussion in this section). Different symbols correspond to the morphological classes of the host galaxies (see Sec. 3.1). Squares are the off-nuclear sources from Lehmer et al. (2006); crosses are the collection of local ULXs by Liu & Mirabel (2005). The dashed line corresponds to the flux limit of the C-COSMOS survey, S erg cm-2 s-1.
In order to estimate how many background sources we expect to contaminate our sample, we applied a random shift between 30″and 2′ to the C-COSMOS sources and searched for chance coincidences with R22 and z galaxies. We repeated this procedure times and we found that, on average, the chance coincidences are . Only for of the simulations we found more than 3 chance coincidences. Summarizing, we expect less than one misidentified AGN due to astrometric errors and on average 1.3 serendipitous background source matches.
3 Host galaxy properties
3.1 Galaxy classification
Studies of local samples of ULXs (e.g. Swartz et al. 2004) have shown that these sources are mainly present in late type galaxies. A visual inspection of Fig. 3 suggests that the ULXs at intermediate redshifts that we are studying are hosted in both early and late type galaxies (ETGs and LTGs, hereafter).
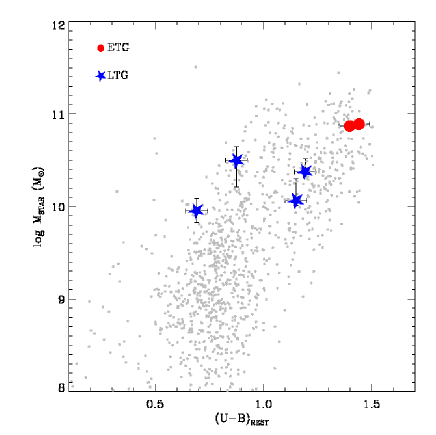
To confirm this impression we classified the host galaxies based on their morphology and colours (e.g. Mignoli et al. 2009). Taking advantage of the COSMOS HST/ACS F814W images (Koekemoer et al. 2007), we have used an accurate morphological classification derived by Scarlata et al. (2007) through the Zurich Estimator of Structural Type (ZEST). Scarlata et al. (2007) describe in detail the methodology and the performances of this method. We only recall here that the ZEST classification is based on: a) five non-parametric diagnostics (asymmetry A, concentration C, Gini coefficient G, 2nd order moment of the brightest of galaxy pixels M20, ellipticity ); and b) the exponent of single Sersic fits to the two-dimensional surface brightness distributions. ZEST assigns to each galaxy a morphological type (1=early type; 2=disk; 3=irregular) and a bulgeness parameter that splits the disk galaxies in four separate bins, from bulge dominated disks (2.0) to pure disk galaxies (2.3). For the bulge-dominated galaxies (2.0), we complemented the morphological information with their rest-frame colours to further subdivide them: if they have red U-B rest-frame colours we include them in the ETGs sample (XID), otherwise we classify them as LTGs (XID). In Fig. 6 we plot the colour-mass diagram for our ULX host galaxies: they can be divided into three ETGs and four LTGs. We will describe in Sec. 3.2 the method used to estimate stellar masses.
The slight preference for ULXs to be hosted in LTGs could be explained by the different shapes of the X-ray luminosity function (XLF) for Low-Mass X-ray Binaries (LMXBs) and High-Mass X-ray Binaries (HMXBs) derived for local galaxies (Grimm et al. 2003; Gilfanov 2004): the former has an abrupt cut-off at L erg s-1, while the latter can be described with a power-law with a slope . Since early-type stars are the dominant stellar population of LTGs, we expect X-ray binaries with O or B type companions, HMXBs, to be common in these objects. This translates into a higher chance to detect ULXs in LTGs or, in any case, in galaxies with current star formation activity.
3.2 Stellar masses and SFR
Stellar masses (M⋆) are derived from the stellar population synthesis model that represents the best fit to the observed photometry (from the band to 4.5 m) using a minimization technique. The procedure is explained in detail by Bolzonella et al. (2009). Here we only recall the basic ingredients of the Spectral Energy Distribution (SED) fitting procedure:
-
•
stellar population synthesis models from the libraries of Bruzual & Charlot (2003);
-
•
eleven “smooth” star formation histories for each library: one constant star formation model plus 10 -model with e-folding time-scales Gyr;
-
•
a Chabrier initial mass function;
-
•
a Calzetti extinction law with ;
-
•
solar metalicity (ZZ⊙).
The star formation rate (SFR) values have been estimated using when possible (for three ULXs) the H 6563 line flux as measured by the routine Platefit (Lamareille et al. 2009), with a correction for reddening. We used the Kennicutt (1998) relation between H and SFR: SFR(M⊙ yrL() ergs s-1. The de-reddened flux of H has been computed according to the formula: where and (Seaton 1979; Maier et al. 2005). If a measure of the H flux was available we have estimated EB-V from the Balmer decrement, adopting the O’Donnell (1994) Milky Way extinction curve. Otherwise, we used the average value mag derived by Moustakas et al. (2006). For the sources without H in the spectral range or for which we have only a photometric redshift, we have used the SFR estimate from the SED fitting procedure.
From the COSMOS catalogue (Capak et al. 2007; Ilbert et al. 2009), we have selected a comparison sample of galaxies inside the area covered by Chandra. We imposed the same constraints used to select the off-nuclear candidates: z0.3 and R. We have also removed all the sources that are best fitted by stellar SED templates (Ilbert et al. 2009). At the end, the comparison sample consists of 2066 galaxies. For all of them we have derived stellar masses and SFR values as described above.
We now estimate the probability to have an off-nuclear source given a host galaxy with a particular stellar mass and SFR. We will consider both LMXBs and HMXBs.
For LMXBs we used the average XLF derived by Gilfanov (2004). This is described by a powerlaw with two breaks, from their formula (8):
| (6) |
where erg/s and normalizations are defined as:
We used the best fitting parameter derived by Gilfanov (2004): , L, , L, . The high-luminosity cut-off was fixed at L. For the average normalization we used the best fitting value given by Gilfanov (2004), , and we will assume a linear relation between the number of X-ray sources and stellar mass as found by the same authors (see Sec. 5 of Gilfanov 2004). We note that up to L ergs s-1 the XLF of Gilfanov (2004) is consistent with later studies (e.g. see Fig. 14 of Humphrey & Buote 2008). Above this luminosity we are extrapolating the XLF since no data are currently available and therefore the uncertainties are large. For the slope at the highest luminosities, we have considered values in the range and we did not find any significant difference from the contours reported in Fig. 7.
For the HMXBs we used instead the luminosity function derived by Grimm et al. (2003). In particular, we used the cumulative form of it, corresponding to their formula (7):
where SFR is in units of yr-1.
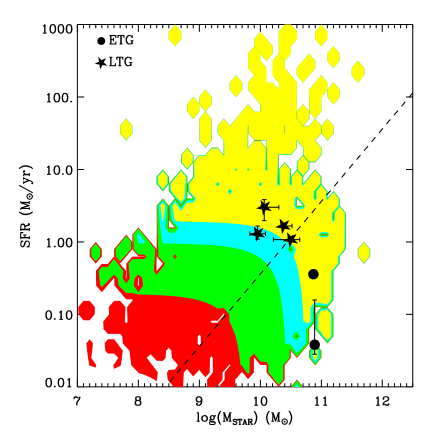
We have then calculated the number of X-ray binaries with L erg s-1 that we expect in each galaxy integrating the XLFs for a given SFR and M⋆. In Fig. 7 we show the contours corresponding to regions where we expect more than 0.1 (red), 1 (green), 5 (cyan), 10 (yellow) X-ray sources with L erg s-1. In reality these numbers have to be considered upper limits because we have not taken into account the limited Chandra spatial resolution that does not allow to detect off-nuclear sources with small offsets (see Fig. 10 of Lehmer et al. 2006).
From Fig. 7, we find that all our ULX candidates are hosted in galaxies for which a large number of X-ray binaries is predicted. The dashed line in Fig. 7 is the locus where we expect the same number of LMXBs and HMXBs with L erg s-1. This line clearly divides a region (below the line) where the XLF of LMXBs is dominating and therefore the contours are mainly defined by the M⋆ values, from a region (above the line) where the HMXBs are more numerous and the contours are determined by the level of the SFR. Our morphological classification is consistent with this picture: ETGs, characterized by lower SFR and high stellar masses, are located in the bottom-right part of the plot, where the expected number of LMXBs is higher than the number of HMXBs. However, we note that there are suggestions in the literature that no ULX LMXBs may actually exist. Irwin et al. (2004) had shown that the number of ULXs detected in a sample of 28 ellipticals observed with Chandra is equal to the number of expected foreground/background objects. Additionally, such ULXs are uniformly distributed and do not follow the optical light of the galaxies. Irwin et al. (2004) also verified that the same statements can be made for the ULXs associated to early-type galaxies presented in Colbert & Ptak (2002).
It would be interesting to repeat the same computation that generated Fig. 7 considering only X-ray binaries with L erg s-1, and therefore to be able to verify the hypothesis that ULXs are the high-luminosity tail of normal X-ray binaries. Unfortunately, this is not possible due to the poor-knowledge of the high luminosity slope of the XLF for LMXBs and HMXBs.

4 Fraction of galaxies hosting a ULX
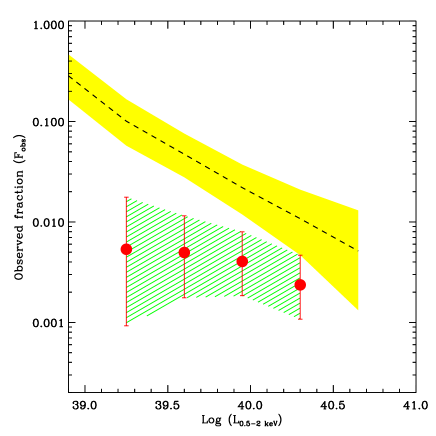
As already pointed out by Ptak & Colbert (2004), useful constraints on the nature of ULXs can be obtained deriving the fraction of galaxies that harbor a ULX as a function of the X-ray luminosity. For example, Körding et al. (2002) have compared the luminosity distribution of X-ray point sources in nearby galaxies with that predicted by X-ray population synthesis models to check whether microblazars (microquasars with relativistically beamed jets pointing towards the observer) may represent an alternative to the intermediate mass black holes scenario for ULXs. In order to compute this fraction, we have used the comparison sample selected in Sec. 3.2. We derived for each individual galaxy a upper limit on its X-ray flux in the [0.5-2] keV band according to the procedure described in Sec. 6.5 of Puccetti et al. (2009), to which we refer the reader for details. The top panel of Fig. 8 shows the number of galaxies for which we could detect an off-nuclear source of 0.5-2 keV luminosity L or larger. The bottom panel of the same figure shows the observed number of galaxies in each L bin hosting an ULX of luminosity L or larger. In order to derive the observed fraction of galaxies with an off-nuclear source, we divided the values of the histogram in the bottom panel by those in the top panel of Fig. 8. The result is shown in Fig. 9. The red points are the result of our analysis, and the dashed area is the 1 confidence region computed using the prescriptions for small numbers statistic by Gehrels (1986). For comparison, we report in the same figure also the fractions obtained by Lehmer et al. (2006) from the Chandra Deep Fields (dashed line and 1 confidence region). These fractions should be considered as lower limits due to the limited Chandra spatial resolution that does not allow to detect off-nuclear sources with small offsets (see Fig. 10 of Lehmer et al. 2006). The agreement between our results and the CDFs points is reasonably good above log(, although our point and the associated confidence contours are about a factor of two lower than, but consistent with, those derived by Lehmer et al. (2006). In the lower luminosity bins, it seems that the two measures are discrepant; however, we do not consider this difference highly significant, since the measured fractions are consistent at the 2 level. Also, at the faintest fluxes the differences between the two X-ray catalogs used is more severe. For these faint sources the positional uncertainties affecting our sample are larger than for the same sources detected in the longer Chandra exposures of the CDFs, and therefore we may be missing the faintest ULXs in the sample if their error box is consistent with the position of the nucleus. We also note that our selection criteria for off-nuclear sources reported in Sec. 2 are more conservative than the ones used by Lehmer et al. (2006). From Fig. 9 we found that and of the galaxies are hosting a ULX with L and L erg s-1, respectively.
| XID555ID of the Chandra source (Elvis et al. 2009) | RA | Dec | Counts666X-ray counts in the [0.5-7] keV band. | log LX777Logarithm of the [0.5-7] keV X-ray luminosity. | Pos. error888X-ray positional error. | Offset | Offset | Offset999Ratio of the distance between the X-ray centroid and the optical centroid over the radius of the Chandra positional error circle. | Off-axis101010Off-axis angle value in the image where the source is closer to the on-axis position. |
| (J2000)111111X-ray coordinates of the ULX. | (0.5-7 keV) | (erg s-1) | (arcsec) | (arcsec) | (kpc) | (arcmin) | |||
| 1151 | 10:00:10.39 | 02:09:23.40 | 28 | 40.4 | 0.5 | 1.67 | 2.91 | 3.42 | 2.8 |
| 1388 | 10:01:08.46 | 02:01:06.05 | 17 | 40.8 | 0.6 | 3.62 | 12.12 | 5.73 | 2.6 |
| 1870 | 10:01:03.76 | 02:30:50.22 | 9 | 39.9 | 0.4 | 3.12 | 4.66 | 7.25 | 2.6 |
| 2418 | 10:00:08.43 | 02:14:47.65 | 6 | 40.6 | 0.3 | 1.58 | 6.76 | 4.53 | 1.3 |
| 3441 | 09:59:33.78 | 01:49:06.92 | 5 | 40.2 | 0.5 | 0.95 | 2.26 | 1.87 | 3.7 |
| 11100 | 10:00:58.65 | 02:11:39.90 | 12 | 40.1 | 0.4 | 0.92 | 1.85 | 2.37 | 3.4 |
| 11938 | 10:00:43.02 | 02:00:32.74 | 7 | 40.5 | 0.8 | 1.39 | 4.79 | 1.77 | 4.4 |
We now discuss the observed trend of the fraction of ULX as a function of their X-ray luminosities in the frame of the beaming model of King (2009). According to this model, ULX are stellar mass black holes accreting at a super-Eddington rate (, for a typical radiative efficiency and accretion rate ). Matter accreting at such rates is easily blown away close to the inner edge of the accretion disc (Shakura & Sunyaev 1973); then, the radiative output from the resulting flow pattern is of the order of , but emerges collimated by the central funnel with a beaming121212Note that here ’beaming’ simply means geometrical collimation, and not relativistic beaming. factor , so that an external observer who happens to have its line of sight within the beaming cone would infer a spherical luminosity: erg/s (where is the black hole mass in units of 7 solar masses; see King 2009 for further details). Thus, neglecting the weak logarithmic dependence on , this model directly links the observed luminosity of a ULX with its beaming factor .
Let us now consider a population of ULX with host galaxy space density (as a function of distance ): Mpc-3. The results of Lehmer et al. (2006) imply an almost linear decline of the cumulative number of ULX per galaxy with observed luminosity, , where is the observed fraction of galaxies hosting a ULX with . The differential fraction , i.e. the fraction of galaxies containing a ULX with luminosity per unit logarithmic interval of luminosity can be derived by simply differentiating the above expression, to obtain , where the last approximate equality has been derived neglecting the logarithmic dependence of on .
We now consider the application of such a model to a multi-wavelength survey like COSMOS. We define the limiting flux of the survey in the X-ray band as erg s-1 cm-2, so that an object of beaming factor can be seen out to a distance of Mpc, and express, in full generality, the number density of galaxies as a function of distance as , where is the number density of possible host galaxies in the survey at the maximum distance where an un-beamed source () can be seen. Such an expression is a very general form appropriate for power-law luminosity functions in Euclidean Universes and is adopted here for the sake of simplicity131313Although we have applied a k-correction to the luminosity values in equation (1), we resolved to make the calculations in this paragraph under the assumption of a Euclidean Universe to simplify the derivation of equation (5).; the exponent depends both on the galaxy luminosity function slope and on the survey selection function and can in principle be derived empirically for any given survey: typically, for flux-limited surveys, we have , while volume limited ones have . Given the observed cumulative fraction 141414We assume in this calculation that the fraction of galaxies hosting a ULX does not change as a function of distance. This is an approximation, since the star formation rate varies with redshift and therefore it is plausible that the fraction of galaxies hosting a ULX varies too., and the corresponding differential one has to search through a space volume to find a ULX with beaming factor (within a unit logarithmic interval of b). From this expression for the volume we derive:
| (8) |
Thus, the minimum beaming factor (corresponding to the maximal luminosity) of a ULX in a survey of area (in units of square degrees), is given by:
| (9) |
where . The overall efficiency of finding ULX scales as . We recall that LULX is the spherical luminosity that would be inferred by an external observer who happens to have its line of sight within the beaming cone. Applying this rough estimate with , m, n, F to the COSMOS survey (, ), we obtain , in reasonable agreement with the present data. Interestingly, this also suggests that larger, but shallower, surveys could be more efficient in finding ULX (provided a similarly deep sample of host galaxies can be identified): the all sky eROSITA survey (, ) could find a large number of ULX, including microblazars up to , .
5 Conclusions
We have presented a sample of ultraluminous X-ray sources (ULXs) selected from the Chandra survey in the COSMOS area (C-COSMOS). From 1761 X-ray sources detected with a maximum likelihood threshold of detml=10.8 in at least one detection band, we have selected 7 ULX candidates covering the redshift range z=0.072-0.283.
Taking advantage of the excellent ancillary data available in the COSMOS field, we have studied the properties of their host galaxies. From a detailed morphological analysis of the ACS images and rest-frame colours, we found that ULXs are hosted both in late and in early type galaxies, with a slight preference for the former.
From the multi-band photometry and from the optical spectral lines, we have measured stellar masses and star formation rates for the host galaxies. Using literature X-ray luminosity functions for HMXBs and LMXBs, we have defined probability areas for having detectable off-nuclear sources in the plane SFR versus M⋆. All our ULXs candidates are hosted in galaxies for which we expect a large number of X-ray binaries with L erg s-1.
The presence of IMBHs () in some of our ULXs cannot be excluded with the current data. The best candidates for this new class of accreting black holes are the ULXs hosted in early type galaxies (therefore not associated with recent star formation activity) and with X-ray luminosity above erg s-1 that can be difficult to explain with high-mass stellar black holes. The objects that satisfy these criteria from our sample are XID 2418 and 11938. Longer X-ray exposures could give us more insights on the real nature of these sources from a detailed study of the X-ray spectrum. Similarly, we cannot set constraints on the recoiling black-hole nature of our sources with the current data, but it is worth mentioning that recent predictions by Volonteri & Madau (2008) expect at most one of such objects in the C-COSMOS survey, assuming the most favorable scenario (spinning black holes, no bulge in the host galaxy, long active phase).
Finally, we have derived the fraction of galaxies hosting a ULX as a function of the X-ray luminosity. We found that and of the galaxies are hosting a ULX with L and L erg s-1. This is in reasonably good agreement with the observed fraction derived in the Chandra Deep Fields by Lehmer et al. (2006) above log(L erg s-1. A possible discrepancy in the lower luminosity bins can be likely attributed to the differences in the limiting fluxes of the two catalogs and, therefore, to the different positional uncertainties affecting faint X-ray sources.
| XID151515ID of the Chandra source (Elvis et al. 2009) | i mag | RP161616Petrosian radius of the host galaxy Petrosian (1976) | z171717Redshift of the host galaxy: “s” for spectroscopic and “p” for photometric redshifts. | Class181818Morphological classification of the ULX host galaxy: early type galaxy (ETG) or late type galaxy (LTG). | log(M⋆) | SFR |
|---|---|---|---|---|---|---|
| (AB) | (arcsec) | (M⊙) | (M⊙/yr) | |||
| 1151191919The photometric coverage is limited to few bands and we cannot constrain its M⋆ or SFR | 15.62 | 19.89 | 0.094 p | ETG | … | … |
| 1388 | 20.39 | 5.20 | 0.204 p | LTG | 10.1 | 3.0 |
| 1870 | 18.40 | 9.21 | 0.072 s | LTG | 9.9 | 1.3 |
| 2418 | 19.45 | 3.99 | 0.283 s | ETG | 10.9 | 0.3 |
| 3441 | 18.19 | 5.50 | 0.133 s | LTG | 10.5 | 1.1 |
| 11100 | 18.48 | 6.90 | 0.110 s | LTG | 10.4 | 1.7 |
| 11938 | 18.94 | 2.53 | 0.221 p | ETG | 10.9 | 0.04 |
Acknowledgements.
This work is based on observations made with ESO Telescopes at the La Silla or Paranal Observatories under programme ID 175.A-0839. We are grateful to the referee for detailed and extremely useful comments that improved the quality of the paper. We thank Piero Rosati and Bret Lehmer for useful scientific discussions. We are grateful to Bret Lehmer for providing the data points of the CDFs used in Fig. 9. This work has been supported in part by the grants: ASI/COFIS/WP3110 I/026/07/0, ASI/INAF I/023/05/0, ASI I/088/06/0, PRIN/MIUR 2006-02-5203.References
- Begelman (2002) Begelman, M.C. 2002, ApJ, 568, 97
- Brusa et al. (2010) Brusa, M. et al. 2010, ApJ, in preparation
- Bruzual & Charlot (2003) Bruzual, G. & Charlot, S. 2003, MNRAS, 344, 1000
- Bolzonella et al. (2009) Bolzonella, M. et al 2009, submitted to A&A, [arXiv:0907.0013]
- Capak et al. (2007) Capak, P. et al 2007, ApJS, 172, 99
- Civano et al. (2010) Civano, F. et al 2010, in preparation
- Colbert & Mushotzky (1999) Colbert, E.J.M. & Mushotzky, R.F. 1999, ApJ, 519, 89
- Colbert & Ptak (2002) Colbert, E.J.M. & Ptak, A.F. 2002, ApJS, 143, 25
- Damiani et al. (1997) Damiani, F. et al 1997, ApJ, 483, 350
- Elvis et al. (2009) Elvis, M. et al 2009, ApJS, 184, 158
- Fabbiano (1989) Fabbiano, G. 1989, ARA&A, 27, 87
- Gehrels (1986) Gehrels, N. 1986, ApJ, 303, 336
- Gilfanov (2004) Gilfanov, M. 2004, MNRAS, 349, 146
- Grimm et al. (2003) Grimm, H.-J. et al. 2003, MNRAS, 339, 793
- Hopman et al. (2004) Hopman, C. et al. 2004, ApJ, 604, L101
- Humphrey & Buote (2008) Humphrey, P.J. & Buote, D.A. 2008, ApJ, 689, 983
- Ilbert et al. (2009) Ilbert, O. et al 2009, ApJ, 690, 1236
- Irwin et al. (2004) Irwin, J. A. et al 2004, ApJ, 601, L143
- Kennicutt (1998) Kennicutt, R.C. Jr. 1998 , ARA&A, 36,189
- Kim et & Fabbiano (2004) Kim,D.-W. & Fabbiano, G. 2004, ApJ, 611, 846
- King (2002) King, A.R. 2002, MNRAS, 335, L13
- King (2009) King, A.R., 2009, MNRAS, 393, L41
- Koekemoer et al. (2007) Koekemoer, A. M. et al. 2007, ApJS 172, 196
- Körding et al. (2002) Körding, E., Falke, H. & Markoff, S. 2002, A&A, 382, L13
- Lamareille et al. (2009) Lamareille, F. et al 2009, in preparation
- Lehmer et al. (2006) Lehmer, B.D. et al. 2006, AJ, 131, 2394
- Lilly et al. (2007) Lilly, S. et al 2007, ApJS, 172, 70
- Lilly et al. (2009) Lilly, S. et al 2009, ApJS, 184, 218
- Liu & Mirabel (2005) Liu, Q.Z. & Mirabel, I.F. 2005, A&A, 429, 1125
- Makishima et al. (2000) Makishima, K. et al. 2000, ApJ, 535, 632
- Maier et al. (2005) Maier, C. et al 2005, ApJ, 634, 849
- Mignoli et al. (2009) Mignoli, M. et al 2009, A&A, 493, 39
- Miller & Colbert (2004) Miller, M.C. & Colbert, E.J.M. 2004, Int.J.Mod.Phys., D13, 1
- Moustakas et al. (2006) Moustakas, J., Kennicutt, R.C. Jr. & Tremonti, C. 2006, ApJ, 642, 775
- Ptak & Colbert (2004) Ptak, A. & Colbert, E. 2004, ApJ, 606, 291
- Petrosian (1976) Petrosian, V. 1976, ApJ, 209, L1
- Puccetti et al. (2009) Puccetti, S. et al. 2009, ApJS, 185, 586.
- O’Donnell (1994) O’Donnell, J.E. 1994, ApJ, 422, 158
- Roberts et al. (2004) Roberts, T.P. et al. 2004, MNRAS, 349, 1193
- Shakura & Sunyaev (1973) Shakura N. and Sunyaev, R., 1973, A&A, 24, 337
- Salvato et al. (2009) Salvato, M. et al 2009, ApJ, 690, 1250
- Scarlata et al. (2007) Scarlata, C. et al 2007, ApJS, 172, 406
- Seaton (1979) Seaton, M.J. 1979, MNRAS, 187, 76P
- Swartz et al. (2004) Swartz, D.A. et al. 2004, ApJS, 154, 519
- Volonteri & Madau (2008) Volonteri, M. & Madau, P., 2008, ApJ, 687, L57