Fluctuations and Elastic Properties of Lipid Membranes in the Gel State: A Coarse-Grained Monte Carlo Study
Abstract
We study the stress distribution profiles and the height and thickness fluctuations of lipid membranes in the gel state by Monte Carlo simulations of a generic coarse-grained model for lipid membranes, which reproduces many known properties of dipalmitoylphosphatidyncholine (DPPC) bilayers. The results are related to the corresponding properties of fluid membranes, and to theoretical predictions for crystalline and hexatic membranes. One striking observation is that the spontaneous curvature of the monolayers changes sign from the fluid to the gel phase. In the gel-phase, the long-wavelength height fluctuations are suppressed, and the fluctuation spectrum is highly anisotropic. In the direction of tilt, it carries the signature of soft modes that are compatible with the wavelength of the ripple phase , which emerges in the transition region between the fluid and the gel state. In the direction perpendicular to the tilt, the thickness fluctuations are almost entirely suppressed, and the height fluctuations seem to be dominated by an interfacial energy, i.e., by out-of-layer fluctuations, up to length scales of tens of nanometers.
1 Introduction
Lipid molecules in water self-assemble into a variety of nanostructures. Among the most prominent are bilayers, where the lipids are arranged such that their hydrophobic hydrocarbon tails are shielded from the water by the hydrophilic head groups. Lipid bilayers form the matrix for biological membranes, and they are ubiquitous in all living matter .
Model systems of pure (one-component) lipid membranes in water have been studied extensively for many decades . Depending on the temperature and on the structure of the lipids, one finds a variety of phases: A high-temperature “fluid” phase () where the lipid tails are highly disordered, a low-temperature “gel” phase with either straight () or collectively tilted () tails, and in the latter case an intermediate modulated “ripple” phase (). At still lower temperatures, other even more ordered phases can be identified. Nature usually maintains biomembranes in the fluid state. Nevertheless, it is remarkable that the transition between the fluid and the gel state, the so-called main transition, occurs at temperatures well above room temperature for some of the most common lipid molecules, (e.g., C for the phospholipid dipalmitoylphosphatidyncholine (DPPC)) .
The gel state of membranes differs from the fluid state in several respect. As mentioned above, the hydrocarbon chains are much more ordered i.e., they have fewer gauche bonds. As a result, the membrane is thicker and the nematic order parameter inside the membrane is higher. Furthermore, the molecules also have a higher degree of (two-dimensional) positional order within the membrane: Gel membranes are presumably hexatic or (quasi)crystalline . Both factors, the higher chain order and the higher positional order, significantly affect the elastic properties of membranes: They are much stiffer in the gel state than in the fluid state.
The simplest Ansatz for the curvature elastic free energy density per unit area of a tensionless fluid membrane is given by
| (1) |
where is the total curvature of the membrane, i.e., the sum of the inverse curvature radii, and is the Gaussian curvature, i.e., their product. The elastic parameters , , and are the bending rigidity, the Gaussian rigidity, and the spontaneous curvature of the membrane6. For symmetric bilayers, is zero. Furthermore, the Gauss-Bonnet theorem states that the integral over on closed membranes contributes a constant which only depends on the topology, hence it can be omitted if the latter is fixed. The only remaining parameter is the bending rigidity .
In hexatic or crystalline membranes, the situation is more complex due to the fact that lipids have fixed neighbors and membranes can sustain elastic shear stress. In a seminal paper of 1987 , Nelson and Peliti have pointed out that in this case, fluctuations stiffen the membranes, and the effective bending rigidity appears to be increased on larger length scales. Out-of-plane thermal undulations with different wavevectors are accompanied by in-plane shear deformations and thus penalized. This leads to long-range phonon-mediated interactions between capillary waves, which renormalize the free energy (1). For crystalline membranes, Nelson and Peliti predicted that the effective bending rigidity scales as as a function of the wavevector. Later, this estimate was refined by Le Doussal and Radzihovsky , who obtained within a self-consistent screening approximation. In hexatic membranes, the positional order is destroyed due to the presence of free dislocations, but they still have long range ’bond-orientational’ order, i.e., the vectors connecting nearest neighbor lipids have well-defined average orientations. According to Nelson and Peliti, the bending stiffness then still increases for large length scales, but only logarithmically, , where is a translational correlation length. Nelson and Peliti also argued that physical lipid membranes should be hexatic rather than crystalline, because the ability to buckle reduces the elastic energy of free dislocations.
The situation is further complicated in the phase due to the collective tilt of the molecules. Park has studied fluctuating tilted hexatic membranes within a model where two order parameter fields, one describing tilt order and one bond-orientational order, evolve on a fluctuating fluid surface (1). Local shear modes, which play a major role in the bending renormalization mechanism of Nelson and Peliti, are not included. In this theory, the bending rigidity in the so-called ’strong coupling limit’ renormalizes to a fixed -independent value, both for untilted and tilted membranes.
It should be noted that fluctuations also renormalize the bending rigidity in fluid membranes, albeit in the opposite way than in hexatic/crystalline membranes. On large length scales the membranes become softer, and effectively vanishes in the infinite wavelength limit. However, this softening becomes only relevant on length scales where the membranes exhibit large deviations from planar. In practical simulation studies of fluctuating self-assembled planar fluid membranes, a well-defined bending rigidity that can be associated with the unrenormalized (local) bending rigidity can usually be extracted from the capillary fluctuation spectrum .
The purpose of the present work was to study the elastic properties of membranes in the fluid and the gel state, and in particular, to look for signatures of the liquid/gel transition in the membrane fluctuation spectrum. To this end we use a coarse-grained approach to membrane modeling . We have carried out extensive simulations of a very simple generic lipid model , which has been shown to self-assemble into bilayers with reasonably realistic elastic parameters in the fluid phase and to reproduce the most important membrane phase transitions of DPPC , i.e., the transition between the -phase, the phase, and the -phase. In previous work, we have characterized the fluid phase and analyzed the resulting membrane-protein and membrane-mediated protein-protein interactions . Now, we will consider the phase, focussing on the stress profiles in the membranes, which can be related to the elastic parameters, and on the capillary fluctuations.
2 Model and Methods
In our model, each lipid is represented by a chain of seven beads with one head bead of diameter followed by six tail beads of diameter . Non-bonded beads interact, via a truncated and lifted Lennard-Jones potential:
| (2) |
with
| (3) |
where is the mean diameter of the two interacting beads, ( or ). Head-head and head-tail interactions are purely repulsive (), while tail-tail interactions also have an attractive contribution (). Bonded beads are connected by FENE (Finitely Extensible Nonlinear Elastic) springs with the spring potential
| (4) |
where is the equilibrium distance, the maximal deviation, and the FENE spring constant. In addition, we introduce a bond-angle potential
| (5) |
The aqueous environment of the membrane is modeled with “phantom” solvent beads , which interact with lipids like head beads (), but have no interactions with each other.
The model parameters are , , , , and , and the pressure was chosen . At these parameters, the lipids spontaneously self-assemble into stable bilayers , and the bilayer undergoes a main transition to a tilted gel phase via a ripple phase at the temperature .
The system was studied using Monte Carlo simulations at constant pressure and temperature with periodic boundary conditions in a simulation box of variable size and shape: The simulation box is a parallelepiped spanned by the vectors , and all and are allowed to fluctuate. This ensures that the membranes have no interfacial tension. We have verified that the total pressure tensor had the form with the applied pressure . We have studied systems of up to lipids, and the run lengths were up to to million Monte Carlo steps, where one Monte Carlo step corresponds to one Monte Carlo move per bead, and moves that change the shape of the simulation box were attempted every 50th Monte Carlo step. The code was parallelized using a domain decomposition scheme described in Ref. 21. The configurations were initially set up as an ordered bilayers with straight chains in the -plane. Typical equilibration times were million Monte Carlo steps for the small systems, which we used to determine pressure profiles, and million Monte Carlo steps for the large systems, which we used to extract fluctuation spectra. After this time, the results for the fluctuation spectra did not change any more. In the fluid state, one can potentially reduce the equilibration and the correlation times by applying additional cluster moves that specifically speed up the long-wavelength modes . This was not done here, since these modes were not the most critical ones in the gel state (see below), and the length of the runs was mainly dictated by the need to accumulate good statistics over the whole range of wavevectors. It should be noted that in the gel state, lipids never flipflopped from one monolayer to the other, hence the number of lipids on both sides remained equal throughout the simulation.
The model units can approximately be translated into standard SI units by comparing the bilayer thickness ( in the phase and in the phase) and the area per lipid ( in the phase and in the phase) with the corresponding numbers for real lipid bilayers. The numbers in our model roughly reproduce those of DPPC bilayers if we identify Å . The energy scale can be estimated by matching the temperatures of the main transition: J.
3 Results
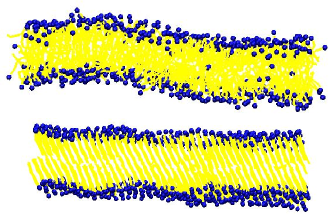
The simulations were mainly carried out at , which is well in the phase. For comparison, we also show data for fluid membranes at . Fig. 1 shows slices through membrane configurations in the fluid and the gel state. The corresponding structure factors (data not shown) feature distinct peaks in the gel state, corresponding to triangular positional order, and diffuse Debye-Scherrer rings in the fluid state, reflecting lack of positional order in that phase . At the available system sizes, it was not possible to determine whether the positional order in the gel phase is hexatic or crystalline.
We begin with considering the local pressure profiles, which give information on the internal stress distribution in the membranes. The pressure tensor was determined using a version of the virial theorem that contains only relative coordinates,
| (6) | |||||
where is the number of particles, the temperature, the volume, the vector connecting the particles and , the pairwise force acting on particle from particles , and the angle between the two bonds from bead . To determine the local pressure profiles, the system was divided in bins of length along the -axis. The contributions of relative vectors were parceled out on the bins according to the Irving-Kirkwood convention .
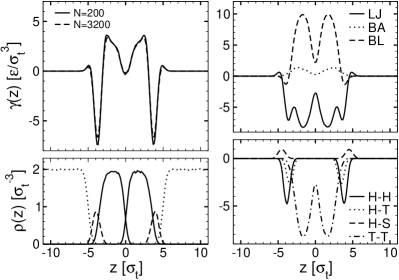
Fig. 2 shows profiles of the local interfacial tension , defined as the difference of the normal and the tangential pressure profile,
| (7) |
for membranes in the gel state. We note that for our tensionless membranes, the integral vanishes. The contributions of different forces to the full profile are shown in Fig. 2 (right).
The main features of the profile can be summarized as follows: It features (i) maxima in the regions where head and tail beads meet, reflecting the interfacial energy of the hydrophilic/hydrophobic interface, (ii) minima in the head regions, reflecting the tendency of the heads to spread out, and (iii) a minimum at the center of the bilayer, reflecting the ’negative interfacial tension’ or adhesive coupling between the monolayers (i.e., a tendency of the monolayer-monolayer interface to spread out). These peaks were also found in the stress profiles of fluid membranes in our and similar coarse-grained models, as well as in atomistic and more reastically coarse-grained simulations of fluid lipid bilayers . The additional weak maxima at the head/solvent interfaces reflect a head-solvent interfacial energy which is specific for our model and not always present. Overall, the stress profiles in the fluid and the gel phase are strikingly similar. They differ mainly in amplitude. Compared to the fluid state, the surface tension profile is amplified by roughly a factor of ten in the gel state, thus the membrane is under much higher internal tension. Furthermore, the relative depth of the minima in the head region increases, compared to the central minima, i.e., the spreading pressure in the head region gains importance. As a result, the monolayers develop a tendency to bend inwards, i.e. they acquire a spontaneous curvature.
For fluid membranes, the latter can be estimated by the first moment of the stress profile 30, with
| (8) |
where we have used , and is the monolayer bending rigidity. We emphasize that refers to the spontaneous curvature of a monolayer. The spontaneous curvature of the bilayer is zero, as mentioned in the introduction. In the gel state, the interpretation of is less obvious, since the Helfrich description (1) is no longer valid. As we shall show below, the very notion of a bending rigidity becomes questionable on nanometer length scales. Nevertheless, one can argue that still gives qualitative information on the propensity of monolayers to bend in one direction.
Applying Eq. (8) yields . In the fluid state, we had obtained in Ref. 17: Thus fluid monolayers were found to have a weak tendency to bend outwards, in agreement with the results from atomistic simulations . Here, in the gel state, they have a tendency to bend inwards. We conclude that the elastic properties of monolayers in the gel phase differ qualitatively from those in the fluid phase. The interplay of two spontaneous curvatures is presumably one of the factors that stabilize a modulated ripple phase in the transition region between the fluid and gel phase.
Next we discuss the fluctuation spectra of the membranes. We have simulated lipid bilayers containing up to 7200 lipids, corresponding to patches with areas of roughly 1300 nm2. The data were analyzed following a procedure described in Refs. 15, 17. Basically, we determine the mean head positions , of the two monolayers on a grid , and derive the height and thickness profiles and . The spectra are Fourier transformed according to
| (9) |
and averages and are evaluated in -bins of size .
Fig. 3 shows the radially averaged results. For comparison, the corresponding data for the fluid phase (from Ref. 17) are shown in the inset. In the fluid phase, the data could be fitted very nicely with an elastic theory due to Brannigan and Brown, which describes the bilayer in terms of two coupled elastic sheets (monolayers) with two types of independent fluctuations: ”bending” fluctuations and ”protrusion” fluctuations. The spectra are dominated by the protrusion modes at high -vectors , and by the bending modes at low -vectors.
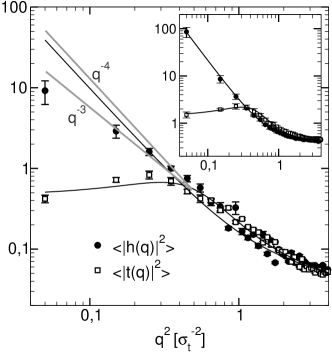
In the gel state, the qualitative features of the radially averaged spectra are at first sight very similar. For example, the height and the thickness spectra nearly fall on top of each other at high , and the thickness spectrum seems to feature a a soft peristaltic mode at , corresponding to a wavelength around . Quantitatively, however, one notices distinct differences between the fluid and the gel state: First, the amplitudes of the fluctuations in the gel state are much smaller than in the fluid state. Second, the elastic theory fails at low -vectors, even though it seems to describe the data reasonably well at high -vectors. Compared to the theoretical prediction, the long-wavelength height fluctuations are suppressed. The low- limit is never encountered. The data are more consistent with the asymptotic behavior predicted by Nelson and Peliti for crystalline membranes , , but in a double-logarithmic plot, even the slope of is slightly too steep (Fig. 3).
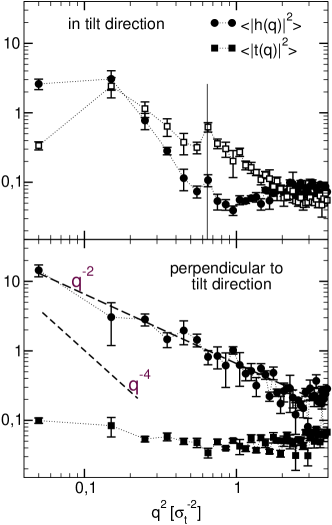
To explore this phenomenon in more detail, we have analyzed separately the fluctuations in tilt direction and perpendicular to the tilt direction. Since the tilt direction slowly fluctuated throughout the simulations, this means that before averaging and , every configuration had to be rotated such that the tilt points along a given axis. The results are shown in Fig. 4. Both in the direction parallel and perpendicular to the tilt, the thickness and height fluctuation spectra differ strongly from the radially averaged spectra, and are no longer compatible with the elastic theory.
In the tilt direction, the thickness fluctuation amplitudes are largely comparable to those of the radially averaged spectrum, with the exception of the -region around , where they exhibit a maximum. In contrast, the height fluctuations are strongly suppressed, most notably for large -vectors beyond , but also for small -vectors. Both the thickness and the height fluctuation spectra feature small but distinct peaks at , which clearly rise above the range of statistical fluctuations. These peaks correspond to undulations with wavelength . The tendency of the gel membrane to exhibit structure on that length scale can already be sensed when looking at the bare snapshots of the gel phase (Fig. 1). The other maximum at (or ) in the thickness spectrum, which was mentioned in the beginning, corresponds to undulations with twice the wavelength, . In the height spectrum, one can vaguely discern a ’peak’ in the same -region, which however interferes with the general growth of fluctuation amplitudes for small -vectors.
Hence we conclude that both the thickness and the height fluctuation spectra feature soft modes with wavelength and . The wavelength happens to coincide with the period of the ripple phase . This suggests that the fluctuations in tilt direction already carry the signature of the modulated phase which intrudes between the liquid and the gel state.
In the direction perpendicular to the tilt, the situation is different. The thickness fluctuations are almost entirely suppressed. The height fluctuations rise smoothly and are best compatible with a slope, suggesting that they are controlled by an interfacial tension rather than a bending rigidity. On the other hand, the evaluation of the pressure tensor clearly shows that the total interface tension, integrated over the membrane, vanishes within the error ().
An alternative potential explanation for the observed shape of the fluctuation spectrum can be derived based on the following two assumptions: (i) The membrane undulations in the direction perpendicular to the tilt (denoted hereafter) are dominated by out-of-layer fluctuations, i.e., the lipids mainly move up and down, keeping their orientation, such that energy contributions due to bending or splay are negligible (see Fig. 5). (ii) The effective interfacial tension in -direction depends on the angle between the projections onto the plane of the lipid orientation vector and the local interface normal. (We note that this second assumption implies that the -direction can be defined independently of the tilt direction, e.g., in terms of the hexatic order in the membrane.) For small angles , the function can then be expanded in powers of , . For constant lipid orientation, the angle depends on the local membrane height position via . Hence the fluctuations of in -direction contribute to the total free energy with the term , which looks formally like an interfacial tension contribution with tension . This explains how out-of-layer fluctuations can display a tension-like behavior. One would expect the out-of-layer fluctuations to eventually give way to bending-dominated fluctuations at very long wavelengths, but the latter are not observed in our simulations.

4 Discussion and Summary
To summarize, we have analyzed the elastic behavior and the fluctuations of lipid membranes in the gel state. They are distinctly different from those in the fluid state. Whereas the liquid state can be described nicely by an elastic theory for fluid coupled monolayers, this description fails in the gel state. The failure can be attributed to the ordered structure of the gel membrane and to its anisotropy. Our simulation results disclose a complex fluctuation spectrum, which cannot be understood within any of the available continuum theories for membranes.
The spectrum is anisotropic and features two soft modes that are very likely related to the ripple phase, which is known to emerge in the transition region between the liquid and the gel phase. Given the fact that the latter has a periodic modulation with wavelength nm, we must conclude that our systems, which have linear dimensions of around nm, are still much too small to give insight into the asymptotic elastic behavior of the membranes. Unfortunately, the simulation of much larger systems (at least a factor of ten would be necessary) is unfeasible with our currently available computer resources. Our simulations can be used to analyze the elastic behavior of the membrane on the length scale of tens of nanometers. Based on our data, it is clear that the membrane in the gel state still has no single unique ’bending rigidity’ on this lateral length scale, even though it exceeds the molecular scale (the monolayer thickness) by more than an order of magnitude. Rather, the elastic behavior results from a complex interplay of different contributions which cannot easily be told apart. Formulating an elastic theory for such membranes will be a challenge for future theoretical work, which should presumably also contribute to a better understanding of the mechanisms driving the formation of the ripple phase.
In the present work, we have discussed ’monodomain’ gel membranes with a uniform tilt direction. This seems realistic, given that scanning optical microscope studies of supported DPPC-bilayers in the gel phase 31 have shown that single-tilt domains in such membranes extend over 1-2 micrometers. On larger scales, the membranes are effectively ’polycrystalline’, and their fluctuations will be dominated by processes at the domain boundaries and/or defects in the tilt order. Preliminary studies, where we have enforced such defects, have shown that they amplify the fluctuations considerably. It will be interesting to study these effects in more detail in the future.
5 Acknowledgments
We thank Jörg Neder and Olaf Lenz for useful discussions. The simulations were carried out at the Paderborn center for parallel computing (PC2) and the John von Neumann Institute for Computing in Jülich. This work was funded by the German Science Foundation (DFG) within the SFB 613.
References
- Gennis 1989 R. B. Gennis, Biomembranes - Molecular Structure and Function, Springer Verlag, New York, 1989
- Bloom et al. 1991 M. Bloom, E. Evans and O. G. Mouritsen, Quarterly Reviews of Biophysics, 1991, 24, 293–397
- Koynova and Caffrey 1994 R. Koynova and M. Caffrey, Chemistry and Physics of Lipids, 1994, 69, 1–34
- Koynova and Caffrey 1998 R. Koynova and M. Caffrey, Biophysica Biochimica Acta, 1998, 1376, 91–145
- Smith et al. 1988 G. S. Smith, E. B. Sirota, C. R. Safinya and N. A. Clark, Physical Review Letters, 1988, 60, 813–816
- 6 We should note that there is a factor-of-two convention disagreement in the literature regarding the definition of . Here and throughout this paper, we use the convention where it is subtracted from the mean curvature. (Eqs. (1) and (8)).
- Nelson and Peliti 1987 D. R. Nelson and L. Peliti, Journal de Physique, 1987, 48, 1085–1092
- Le Doussal and Radzihovsky 1992 P. Le Doussal and L. Radzihovsky, Physical Review Letters, 1992, 69, 1209–1211
- Park 1996 J.-M. Park, Physical Review E, 1996, 56, R47–R50
- Park and Lubensky 1995 J.-M. Park and T. C. Lubensky, Physical Review E, 1995, 53, 2648–2664
- Peliti and Leibler 1985 L. Peliti and S. Leibler, Physical Review Letters, 1985, 54, 1690–1693
- Goetz et al. 1999 R. Goetz, G. Gompper and R. Lipowsky, Physical Review Letters, 1999, 82, 221–224
- Lindahl and Edholm 2000 E. Lindahl and O. Edholm, Biophysical Journal, 2000, 79, 426–433
- Marrink and Mark 2001 S. J. Marrink and A. E. Mark, Journal of Physical Chemistry B, 2001, 105, 6122–6127
- Loison et al. 2003 C. Loison, M. Mareschal, K. Kremer and F. Schmid, Journal of Chemical Physics, 2003, 119, 13138–13148
- Brannigan and Brown 2006 G. Brannigan and F. L. H. Brown, Biophysical Journal, 2006, 90, 1501–1520
- West et al. 2009 B. West, F. L. H. Brown and F. Schmid, Biophysical Journal, 2009, 96, 101–115
- Venturoli et al. 2006 M. Venturoli, M. M. Sperotto, M. Kranenburg and B. Smit, Physics Reports, 2006, 437, 1–57
- Schmid 2009 F. Schmid, Macromolecular Rapid Communications, 2009, 30, 741–751
- Lenz and Schmid 2005 O. Lenz and F. Schmid, Journal of Molecular Liquids, 2005, 117, 147–152
- Schmid et al. 2007 F. Schmid, D. Düchs, O. Lenz and B. West, Computer Physics Communications, 2007, 177, 168–171
- Lenz and Schmid 2007 O. Lenz and F. Schmid, Physical Review Letters, 2007, 98, 058104
- Düchs and Schmid 2001 D. Düchs and F. Schmid, Journal of Physics: Condensed Matter, 2001, 13, 4853–4862
- Farago 2008 O. Farago, Journal of Chemical Physics, 2008, 128, 184105
- Lenz 2007 O. Lenz, Dissertation, Universität Bielefeld, 2007
- Irving and Kirkwood 1950 J. H. Irving and J. G. Kirkwood, Journal of Chemical Physics, 1950, 18, 817–829
- Goetz and Lipowsky 1998 R. Goetz and R. Lipowsky, Journal of Chemical Physics, 1998, 108, 7397–7409
- Marrink et al. 2007 S. J. Marrink, H. J. Risselada, S. Yefimov, D. P. Tielemann and A. H. de Vries, Journal of Physical Chemistry B, 2007, 111, 7812–7823
- 29 Fig. 3 in Ref. 28 displays (), even though the text suggests otherwise (S.-J. Marrink, private communication).
- Safran 1994 S. A. Safran, Statistical Thermodynamics of Surfaces, Interfaces, and Membranes, Perseus Books, Cambridge, Massachusetts, 1994
- Lee et al. 2003 C.-W. Lee, R. S. Decca, S. R. Wassall and J. J. Breen, Physical Review E, 2003, 67, 061914