Probing the terminator region atmosphere of the Hot-Jupiter XO-1b with transmission spectroscopy
Abstract
We report here the first infrared spectrum of the hot-Jupiter XO-1b. The observations were obtained with NICMOS instrument onboard the Hubble Space Telescope during a primary eclipse of the XO-1 system. Near photon-noise-limited spectroscopy between 1.2 and 1.8 m allows us to determine the main composition of this hot-Jupiter’s planetary atmosphere with good precision. This is the third hot-Jupiter’s atmosphere for which spectroscopic data are available in the near IR. The spectrum shows the presence of water vapor (H2O), methane (CH4) and carbon dioxide (CO2), and suggests the possible presence of carbon monoxide (CO). We show that the published IRAC secondary transit emission photometric data are compatible with the atmospheric composition at the terminator determined from the NICMOS spectrum, with a range of possible mixing-ratios and thermal profiles; additional emission spectroscopy data are needed to reduce the degeneracy of the possible solutions. Finally, we note the similarity between the 1.2-1.8 m transmission spectra of XO-1b and HD 209458b, suggesting that in addition to having similar stellar/orbital and planetary parameters the two systems may also have a similar exoplanetary atmospheric composition.
Keywords: planetary systems - techniques: spectroscopy
1 Introduction
The exoplanet XO-1b is the first one discovered by the XO project (McCullough et al., 2006), and belongs to the so called hot-Jupiter class of objects, i.e. gas giant planets orbiting very close to their parent stars. XO-1 is a G1V star, almost identical to our own Sun. The primary transit and radial velocity measurements (McCullough et al., 2006; Holman et al., 2006; Torres et al., 2008) are consistent with a planet of mass , planetary/stellar radii ratio , semi major axis AU and a stellar K. The equilibrium temperature of XO-1b is K. Follow-up observations of XO-1 with the IRAC camera on board the Spitzer Space Telescope were recently obtained (Machalek et al., 2008), providing new insight into the thermal properties of this exoplanet atmosphere.
We present here new primary transit spectroscopy data of the exoplanet XO-1b obtained with the NICMOS instrument on board the Hubble Space Telescope. A combination of high quality data and the presence of strong molecular features offers the opportunity for a robust determination of chemical composition of a hot-Jupiter’s atmosphere. Having secured the atmospheric composition of XO-1b with the NICMOS transmission spectrum in the terminator region, the emission photometry data recorded by Machalek et al. (2008) can be used to constrain the vertical thermal structure of the planetary atmosphere on the day side. Emission data are, in fact, highly sensitive to atmospheric thermal gradients and thus complement transmission spectra, which are less dependent on the temperature profile.
We remark that the stellar/planetary and orbital parameters of XO-1b are quite similar to the ones of the hot-Jupiter HD 209458b (Mazeh et al., 1999; Charbonneau et al., 2000, Torres et al., 2008), for which , , semi major axis AU, stellar K. The equilibrium temperature of HD 209458b is K; photometric and spectroscopic data in the NIR and MIR were used to constrain its thermal profile (Swain et al., 2009b).
Previous observations of HD 209458b with NICMOS were made in the same instrument configuration of the spectrum reported here (Deroo et al., submitted) thus providing an ideal basis for comparison. While H2O, CH4 and CO2 are present in both HD 209458b and XO-1b, the HD 209458b spectrum suggests the additional presence of hazes, non detectable in the atmosphere of XO-1b.
2 Observations & Data Analysis
The transit of XO-1b in front of its host star was monitored spectro-photometrically using HST/NICMOS on February 9 and 21, 2008. The observations were performed using the G141 grism covering the wavelength range between 1.2 and 1.8 m. The instrument was defocused resulting in a spectral resolution of . In both cases, five HST orbits cover the event. This paper is focused on the second observation for two reasons: (1) the second observation covers the full eclipse in two HST orbits instead of one for the first observation, and (2) the raw signal of the first observation is less stable than the second observation by a factor 2.5. As a result, even though both transmission spectra are compatible, only the second observation provides sufficient signal to noise for molecular spectroscopy. An upcoming publication (Burke et al., in prep) will focus on the ephemerides derived from these measurements and for this, the first observation is the most decisive dataset. To combine the two observations one would need to assume that the distribution of stellar spots remained unchanged, but such an assumption is not granted. First of all stellar spots are not uniformly distributed in longitude, as observed in the Sun and as inferred by the light curve modulation in other stars, as e.g. observed by CoRoT (Mosser et al. 2009). The low projected rotational velocity of the XO-1 star implies a period comparable to the solar one ( km s-1, McCullough et al. 2006): since our two observations are separated by ca. 12 days, the XO-1 star will have shown two different hemispheres on the two dates, with likely two different spot distributions. Additionally, as shown by Mosser et al. (2009), the stellar spot distribution evolves on time scales comparable to the rotational period of the star. Therefore, even if the transit observations were planned to fall always against the same stellar hemisphere, still the spot distribution would be different. As a consequence, primary eclipse average depths can and do change due to variable star spot distribution, and there is no obvious way to correct for them at the level of accuracy required for molecular spectroscopy.
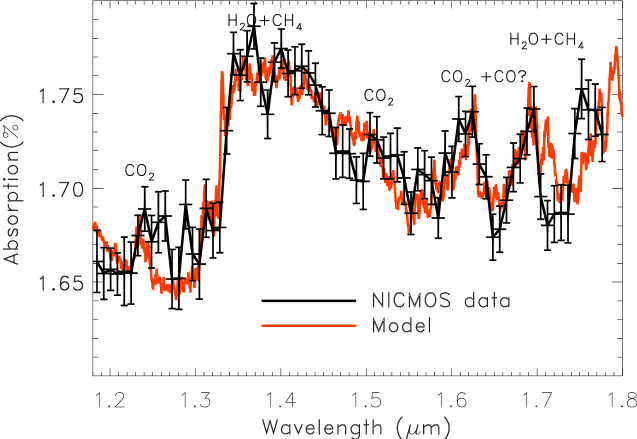
The observation on February 21, 2008 covers the pre-, full and post-transit phase with two, two, and one HST orbit respectively. In total, 279 spectra were measured with an integration time of 40 sec each. Because the signal was still stabilizing in the first orbit, we omitted this data in the analysis. We analyzed the observations with a previously established method (Swain et al., 2008b, Swain et al., 2009a, Swain et al., 2009b). The recorded signal needs to be corrected for systematics, which is done through a multi-dimensional minimization taking into account the planet’s orbital parameters (transit depth, semi major axis, inclination, eclipse timing etc.) previously obtained (McCullough et al., 2006; Holman et al., 2006; Torres et al., 2008) and the optical state vectors (see Swain et al. 2008b). Limb darkening parameters were taken from Claret (2000) for the and bands and interpolated to the appropriate wavelength. In the minimization, the only free parameter is the depth of the eclipse, which is derived for each spectral channel. The final spectrum is shown in Fig. 1.
The zero point of the derived spectrum implies %, which is within 1- from the radius ratio reported in McCullough et al. (2006) and Holman et al. (2006). The error bar on the zero point is significantly larger than the point-to-point uncertainty on the spectrum, since it is more sensitive to errors introduced by stellar variability or limits in the ephemeris determination. For this reason, the approach based on multiple bands observed at different times, recently proposed by Sing et al., (2009) as an alternative to transmission spectroscopy, cannot provide the level of accuracy needed to detect molecular signatures. In contrast, simultaneous measurements at all relevant wavelengths make the measured spectral shape relatively insensitive to such errors and quite robust to determine the presence of molecular species in the 1.2-1.8 m region.
3 Spectral interpretation
We modeled the transmission spectrum of XO-1b using line by line radiative transfer models optimized for hot-Jupiter planets, which account for the effects of molecular opacities (Tinetti et al., 2007a,b) and hazes (Griffith et al. 1998). In our simulations we included H2O, CH4, CO and CO2. While the BT2 line list for water (Barber et al., 2006) can be calculated at the appropriate temperatures, the available data lists for methane at high temperature are inadequate to probe the modulations of the atmospheric thermal profile. To cover the spectral range of our data, we had to use multiple data lists for methane, HITRAN 2008 (Rothman et al., 2009), PNNL, and hot-temperature measurements at 800, 1000 and 1273 K (Nassar and Bernath, 2003). For CO2 we used HITEMP (Rothman et al., private comm.) and CDSD-1000 (Tashkun et al., 2003), for CO we used HITEMP. The contribution of H2-H2 at high temperatures was taken from Borysow et al. (2001).
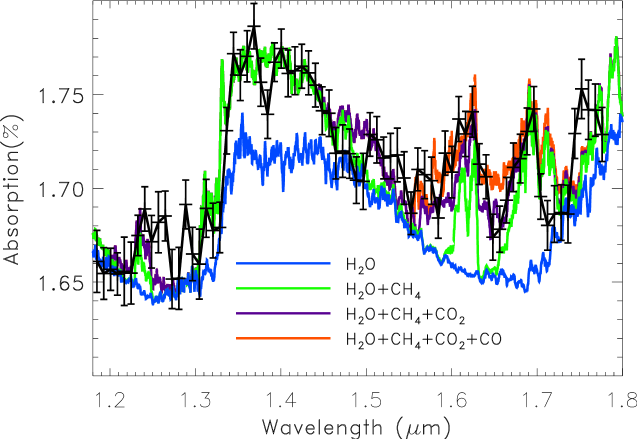
We find that absorption due to H2O, CH4 and CO2 explains all the features visible in the NICMOS spectrum. The additional contribution of CO may improve the fit between 1.55 and 1.75 m, Fig. 1 and Fig. 2, but we cannot discard the possibility that improved data lists for methane and/or CO2 would provide the missing opacity.
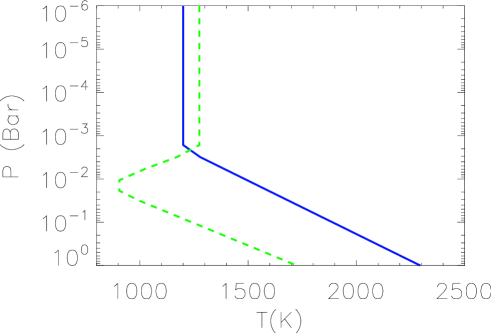
The H2O abundance determined from the spectrum depends on the assumed temperature and planetary/stellar radii. Although transmission spectra are not very sensitive to thermal gradients, certainly not as sensitive as emission spectra, the atmospheric temperature may play an important role in the overall scale height, hence in the amplitude of the spectral signatures, as well as in the molecular absorption coefficients. A range of profiles similar to those plotted in Fig. 3 combined with a thermochemical equilibrium H2O abundance of (Liang et al., 2003; 2004) provide an excellent match. However, a 1% difference in the estimate of the planetary radius at the 1 bar pressure level, would result in a variation of the H2O abundances of a factor of 10. Additional primary transit data at different wavelengths are needed to constrain the H2O abundance. The mixing ratio determined for CH4 depends on the data list used and on the H2O mixing ratio. For standard quantity of H2O (), the retrieved mixing ratio of methane is if we use Nassar and Bernath (2003) line lists. Mixing ratios 10-50 times larger are needed for methane if we use PNNL or HITRAN 2008. The HITRAN 2008 data bank has the advantage of covering the entire spectral range measured by NICMOS, with the downside (shared also by the PNNL list) is that it results from measurements at room temperature, and therefore is quite inadequate to estimate the mixing ratio of methane at the temperatures of interest here. The Nassar and Bernath (2003) data provide a much better fit to our observations in the region where they overlap with HITRAN 2008. The contribution of CO2 is clearly shown in Fig. 2, and its mixing ratio is consistent with the one of H2O. An upper limit of was found for CO.
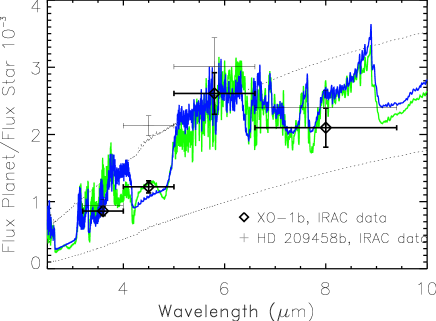
As previously mentioned, these observations of XO-1b allow a direct comparison with HD 209458b. Concerning the NICMOS transmission spectra, we find that H2O, CH4, CO2 and possibly CO explain the spectra for XO-1b and HD209458b. However, a haze component may be present in the HD 209458b atmosphere while the XO-1b data do not require it. For consistency, we also tried to fit the photometric data points obtained by Machalek et al. (2008) using the secondary transit technique. We have tried different classes of profiles (Fig. 3) as we did in the case of HD 209458b (Swain et al., 2009b). The assumption that the chemical abundances of the atmospheric components do not change dramatically from the day to the night side needs further confirmation. To maintain mixing ratios of H2O, CH4 and CO2 consistent to those adopted to fit the terminator spectroscopy data, a profile relatively hot towards the 1 bar level and with decreasing with altitude is needed (blue curve in Fig. 3), while classes of profiles with an inversion (e.g. green curve) need to be combined with smaller mixing ratios to match the IRAC photometric data. Given the highly degenerate nature of the problem, we cannot conclude which thermal profile and combination of mixing ratios characterize the day-side atmosphere. Broad-band emission photometry data alone cannot provide an accurate retrieval of four molecules and of a profile. Additional spectroscopic data are needed to constrain the number of plausible solutions. By comparing the IRAC emission photometry data for XO-1b with the same datasets for HD 209458b (Knutson et al., 2007), we clearly see that HD 209458b is slightly hotter, as expected, but there is also a hint that the CO2 and/or CO abundance may be higher in XO-1b due to the more pronounced absorption in the 4.5 m band (Fig. 3).
4 Conclusions
We present in this paper the first transmission spectrum of the hot-Jupiter XO1b, recorded with the HST-NICMOS instrument. The data can be explained mainly with the combined presence of H2O, CH4 and CO2 in the atmosphere of the planet, but we suggest that CO might also be present in XO-1b. The photometric emission data observed by Machalek et al. (2008) are consistent with the above composition but a variety of profiles and mixing ratios are compatible with the data. In particular profiles with no inversion and a hotter temperature at the 1 bar pressure level, are compatible with the mixing ratios that fit the terminator spectroscopy data presented here. Other thermal profiles with a stratosphere can fit the day-side observations if we change the mixing ratios of the atmospheric components proposed for the terminator. With only four broad-band emission photometry points we cannot retrieve simultaneously the thermal structure and the molecular composition from the data, a task that requires additional spectroscopic data.
Finally we compare the atmospheres of two hot-Jupiters showing stellar, orbital, and planetary similarities, i.e. XO1b and HD 209458b, for which we have data obtained with the same instrument and technique. While these data are consistent with a similar atmospheric composition for the two planets, hints of the presence of hazes on HD 209458b and more abundant CO and/or CO2 on XO-1b show a departure from the affinity. Additional observations of transiting hot-Jupiters, especially spectroscopic data, will allow a more thorough classification of this type of planets unknown in our Solar System.
References
References
- [1] Barber, R. J., Tennyson, J., Harris, G. J. & Tolchenov, R. N., 2006, MNRAS, 368, 1087
- [2] Borysow, A., Jorgensen, U.G., Fu, Y., 2001, JQSRT 68, 235
- [3] Claret, A., 2000, A&A, 363, 1081
- [4] Deroo, P., et al., submitted
- [5] Charbonneau D., Brown T., Latham D., Mayor M., 2000, ApJ 529, L45
- [6] Deming, D., Seager, S., Richardson, L. J., & Harrington, J., 2005, Nature, 434, 740
- [7] Griffith, C. A., Yelle, R. V. & Marley, M. S., 1998, Science, 282, 2063
- [8] Grillmair, C. J, et al., 2008, Nature, 456, 767
- [9] Holman, M. J., et al., 2006, ApJ, 652, 1715
- [10] Knutson, H. A., et al., 2008, ApJL, 673, 526
- [11] Liang, M. C., et al., 2003, ApJL, 596, 247
- [12] Liang, M.C., et al., 2004, ApJL, 605, 61, 2004
- [13] Machalek, P., et al., 2008, ApJ, 684, 1427
- [14] Mosser, B., et al., 2009, A & A, 506, 245.
- [15] McCullough, P. R., et al., 2006, ApJ, 648, 1228
- [16] Mazeh, T., et al., 2000, ApJ, 532, L55
- [17] Nassar, R., & Bernath, P., 2003, JQSRT, 82, 279
- [18] Rothman, L. S., et al., 2009, JQSRT 11,533
- [19] Sing, D., et al., 2009, A&A, 505, 891
- [20] Swain, M. R., et al., 2008a, ApJ, 674, 482
- [21] Swain, M. R., Vasisht, G., & Tinetti, G., 2008b, Nature, 452, 329
- [22] Swain, M. R., et al., 2009a, ApJ, 960, L114
- [23] Swain, M. R., et al., 2009b, ApJ, 704, 1616
- [24] Swain, M. R., et al., 2010, Nature, 463, 637
- [25] Tashkun, S. A., et al., 2003, JQSRT, 82 1 4, 165
- [26] Tinetti G., et al., 2007, ApJ, 654, L99
- [27] Tinetti G., et al., 2007, Nature, 448, 169
- [28] Torres, G., Winn, J. N., Holman, M. J., 2008, ApJ, 677, 1324