Laboratoire des Colloïdes, Verres et Nanomatériaux, Université Montpellier 2, CNRS, Montpellier, France
Measuring Nanoscale Stress Intensity Factors with an Atomic Force Microscope
Abstract
Atomic Force Microscope images of a crack intersecting the free surface of a glass specimen are taken at different stages of subcritical propagation. From the analysis of image pairs, it is shown that a novel Integrated Digital Image Correlation technique allows to measure stress intensity factors in a quantitative fashion. Image sizes as small as 200 nm can be exploited and the surface displacement fields do not show significant deviations from linear elastic solutions down to a 10 nm distance from the crack tip. Moreover, this analysis gives access to the out-of-plane displacement of the free surface at the crack tip.
pacs:
68.37.Pspacs:
46.50.+apacs:
07.05.PjAtomic force microscopy Fracture mechanics, fatigue and cracks Image processing
The mechanisms of subcritical crack propagation in silicate glasses have been the subject of extensive research (cf. [1, 2] for recent reviews). The development of advanced AFM techniques to probe in-situ crack propagation or post-mortem crack surface morphologies have recently led to explore these mechanisms at their relevant nanometric scale leading to remarkable observations on plastic crack tip damage [3, 4], stress-induced ion migration [5] and capillary condensation inside the crack tip cavity [6]. However, a proper understanding of these observations in terms of sound mechanical modeling has been hampered by the lack of a technique to measure the stress and strain fields at the crack tip with a nanometric resolution, and the proposed interpretations are still subject of debate [2]. Another weakness of the in-situ AFM observations is their limitation to access the external surface of the sample, that is intersected by the propagating crack front with a small tilt angle, thus making the local three-axial condition of stress not trivial [7]. The present letter reports a concomitant solution of all these problems. By extending the Digital Image Correlation technique to AFM topographical images of in-situ crack propagation in a silica glass it was possible (1) to characterise properly the 3D surface displacement fields with nanometric resolution, (2) to show that they can be fitted by appropriate elastic solution down to a 10 nm distance from the crack tip and (3) that the locally measured surface stress-intensity factor is in agreement with the macroscopically measured value within 5% uncertainty.
Digital Image Correlation (DIC) is a technique which allows one to measure displacement fields by matching a reference with a deformed image, most often an optical image. Introduced a long time ago in the field of solid mechanics by Sutton et al. [8], this technique has known a very rapid development due to the wide availability of digital imaging devices, and the increasing performance and reliability of analyses. In particular for cracks, since the pioneering work of Sutton [9], recent works [10, 11, 12] have shown that stress intensity factors can be estimated very accurately either directly through Integrated DIC (IDIC) which incorporates analytic crack fields [10], or through a tailored post-processing of the displacement field [10, 11, 13]. However, most applications of DIC deal with optical images, and very few with Atomic Force Microscopy (AFM) images. Among those, the most advanced published works concern thin polycrystalline silicon films [14, 15, 16, 17, 18]. In particular, the measurement of a uniform strain field from AFM images at different scales down to scale m2 images [17] allowed to estimate the elastic properties of polycristalline Silicon used for MEMS. More recently, stress intensity factors were evaluated for cracks propagating in such films [18]. AFM was used to locate the crack geometry. Stress Intensity Factors (SIFs) were then indirectly estimated through an elastic finite element simulation of the test and specimen geometry. In a different spirit, a recent study by Xu et al. [19] investigated systematic bias such as drift and distorsion of large AFM images ( m2) on unstrained samples in order to estimate (and reduce) strain measurement uncertainties. These two sets of studies have demonstrated the feasibility of using DIC on AFM images, mostly for simple strain fields and large scanned regions.
The present work is aimed at a direct determination of stress intensity factors through DIC at a much lower scale than previously considered, (from m2 down to nm2, i.e. about 100 times smaller than in previously reported studies [18]), without any recourse to numerical finite-element simulations. This analysis also provides information on inelastic processes at play in the crack tip neighborhood through unresolved discrepancies after accounting for a simple linear elastic-brittle behavior. Applying DIC requires to overcome a number of very significant challenges: As the size of the region of interest is reduced, the noise level of AFM images becomes very significant. Moreover, images consist in topographic measurements. In contrast with classical speckle patterns which are simply advected by the displacement field, the topography is affected by out-of-plane motion of the free surface. In the present study, we will see that the typical peak-to-valley roughness of say 1 m size images is of order 3 nm. The out-of-plane displacement difference due to a crack at the critical stress intensity factor will be estimated below as being of order 2 nm, and thus cannot be ignored. Thus, the very foundation of DIC, i.e. the conservation of optical flow, has to be revisited and generalized to account for this effect.
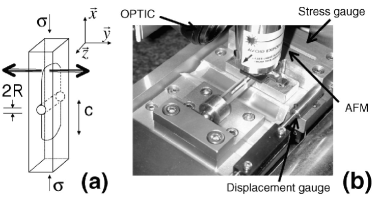
In the present experiments, fractures were initiated and propagated on a Double Cleavage Drilled Compression (DCDC) set-up (cf. Fig. 1) at a constant temperature of C in a leak-proof chamber under an atmosphere composed of pure nitrogen and water vapor at relative humidity %. The DCDC test set-up is particularly convenient for these studies due to its excellent stability and several theoretical modeling were devoted to it [20, 21]. The parallelepipedic DCDC samples ( mm3, 10 m) of pure fused silica glass (Suprasil 311, Heraeus, Germany) were polished to a RMS roughness of 0.5 nm (for an area of 1x1 m2) and a hole of radius m was drilled at their center to trigger the initiation of the two symmetric fractures of length . AFM observations are done in tapping mode on a D3100 from Veeco Metrology Inc., Santa Barbara, CA. The details of the setup and techniques can be found in [3, 6]. After an extensive stabilization consisting of several hours of stationary propagation and imaging, all the images presented here were acquired within two-hours, so that crack propagation conditions can be considered as stable at a propagation velocity nm/s and AFM drifts are minimized. For an applied force N and an average crack length m, the SIF can be estimated to MPa.m1/2 according to Ref. [20].
Let us denote by and the topographic images of the reference and deformed states, where are the coordinates in the observation plane. and are the height of the observed surface in nanometers. The generalization of the so-called “optical flow conservation” which relates the two images can be written
| (1) |
where (resp. ) denotes the in-plane (resp. out-of-plane) displacement field.
In order to develop a robust method, we resort to an “Integrated” DIC (IDIC) approach as introduced in Ref. [10]. The displacement field is searched for as a combination of a few expected fields
| (2) |
Those fields consist in rigid body motions and mode I crack displacement fields detailed in the following: The latter fields are well known in either plane stress or plane strain conditions [22], which unfortunately do not strictly apply for a crack front emerging on the free surface of a 3D sample [21]. Nevertheless, the in-plane component can be well approximated by the plane stress condition. We introduce the notation for such an in-plane displacement field for a crack tip located at the origin, and crack path along the semi-axis. The displacement field normal to the free surface is not known analytically. The latter, for a unit mode I stress intensity factor, is denoted for the same reference geometry. Because of their different status, the in-plane and out-of-plane displacements will be treated in the sequel as two independent fields.
An additional difficulty is that as we follow a crack propagation under a constant load, the crack tip is present in both images although at different locations. Let us call and the crack tip positions in and respectively. The displacement field to be applied to the reference image thus consists in closing the crack at point and opening it at . Thus the and basis fields are and respectively, while the and fields are the out-of-plane components and respectively. For a steady state propagation under the same stress intensity factor, we can write and . Those equalities can be enforced using Lagrange multipliers. Thus the problem consists in evaluating the above 10 unknowns, , (8 degrees of freedom) through a weak form of the extended optical flow conservation to be minimized:
| (3) |
where and designate respectively the in-plane and out-of-plane displacement. When suitably normalized (using the pixel size and the elastic properties of the silica glass specimen), we see that the SIF is directly estimated as the parameter value. The problem as it is written is strongly non-linear because of the occurrence of unknowns as arguments of the topography . To avoid secondary minima trapping the determination of the displacement is performed hierarchically from the minimization of the above functional from coarse-grained images down to the original images. Each minimization is performed iteratively resorting to a linearization in the unknowns . This procedure is similar to the one introduced by Hild et al. [23].
Finally, the above computation requires the knowledge of the crack tip location. If, at a large scale, the crack path is clearly visible on the topographic images, the exact position of the tip is more uncertain (cf. Fig. 2(a)). However, the hydrophilic nature of the glass surface induces a capillary condensation of water at the crack tip, and when the AFM tip probes the immediate vicinity of the crack, the formation (and disruption) of a water meniscus induces a significant change in the phase angle measurements [6] as can be seen in Fig. 2(b). Thus, albeit phase angle maps are much more homogeneous than topographic ones, and hence can hardly be used for IDIC, the crack path and tip can be resolved precisely on those images. We should note that the present phase images are acquired using the repulsive tapping mode, which allows for a resolution of 10 nm on the lateral positioning of the crack tip, but good results can also be obtained using either the attractive mode or a spatially mixed mode between the surface and the condensate (cf. [24, 6]). In addition, starting from these observations of the crack tips on both reference and deformed images, a final optimization can be performed based on the minimization of the functional .
a)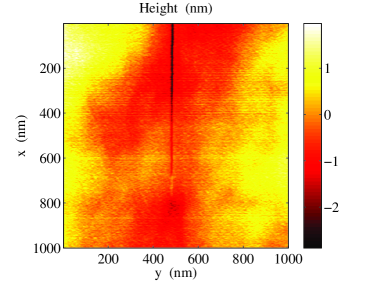 b)
b)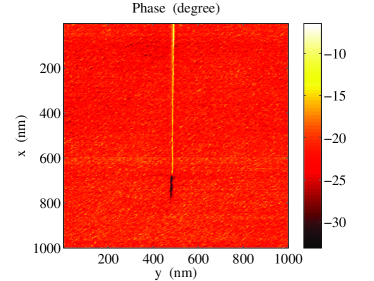
One major difficulty is that the analytical form of the out-of-plane field is unknown. The general problem of the emergence of a crack on a free face, is a difficult issue. In the framework of linear elasticity, at the very point of intersection between the crack front and the free surface, i.e. the observed “crack tip”, a point singularity occurs, whose exponent depends continuously on the angle of the crack front incidence to the external surface and on the Poisson’s ratio [25]. A detailed theoretical and numerical study of this effect applied to glass and specifically in the very same DCDC test as the one here considered can be found in Ref. [21].
It has been argued [7] that the crack front geometry adjust itself at propagation so that the singularity exponent is the same, , as for a planar crack. Thus, as a rough approximation, we first used . Although, not equal to the actual displacement field, yet it allowed to register both images, with the appropriate in-plane displacement. Once this is achieved, we can extract the height difference between the reference and deformed surfaces, ignoring the contribution. This difference (or “residual”) should be expressed as . A simple algebraic expression for is proposed as a systematic Fourier expansion respecting the mode I crack symmetries
| (4) |
where is the polar angle of the current point with respect to the crack tip. Low orders for the parameter are chosen. This allows for a direct experimental determination of the out-of-plane displacement field which is then used in the IDIC analysis.
a)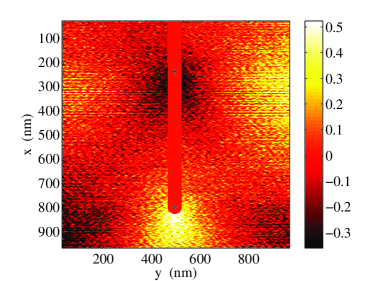 b)
b)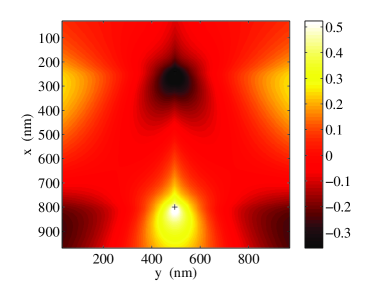 c)
c)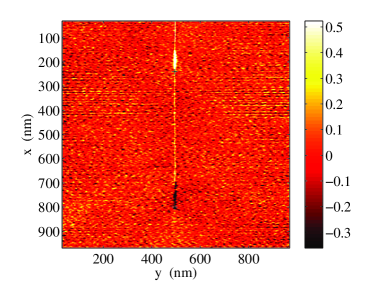 d)
d)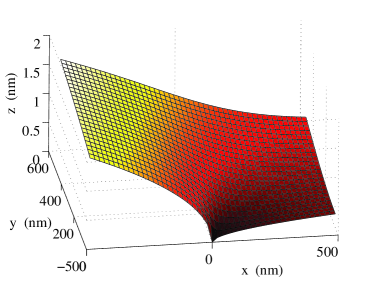
A series of 5 images of the same m2 zone swept by a crack is first analyzed. An example of the residual map without out-of-plane displacement is shown in Fig. 3(a). From the set of the four residual fields, a least squares regression is implemented in order to identify the out-of-plane displacement based on the algebraic expression Eq. 4. is obtained. Figure 3(c) shows that no obvious long range trend is left in the final residual. The out-of-plane displacement due to the opening of a crack at the origin is shown in the same Figure. It is to be emphasized that the present analysis cannot determine the absolute reference plane and thus is determined up to a linear function in . Yet, the order of magnitude of the displacement amplitude is quite comparable to the result of numerical simulations reported by Fett et al. [21].
This expression of the out-of-plane displacement is now used in the sequel. The quality of the IDIC measurement is evaluated by measuring the normalized residual, , i.e. the standard deviation of the remaining residual, normalized by the peak-to-valley roughness of the original topographic image. In the present cases, even though the kinematic field was adjusted with very few parameters, the normalized residual was very stable at about 1.6%, a remarkably low value which gives confidence in the convergence of the procedure. The measured SIF values (assuming a Young’s modulus of 72 GPa, and a Poisson’s ratio of 0.17) were successively 0.38, 0.36, 0.44 and 0.38 MPa.m1/2. The stability of the four independent measurements gives an a posteriori indication on the uncertainty of the toughness measurement, MPa.m1/2, which is in excellent agreement with the macroscopic value of MPa.m1/2 estimated independently. Note the huge difference of length scales used in both estimates (millimeters vs. nanometers respectively for the macroscopic evaluation and present analysis).
a)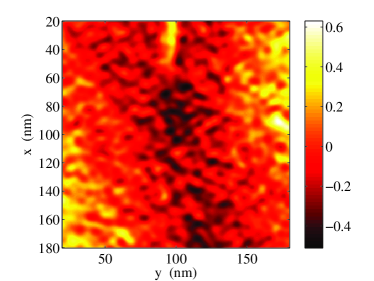 b)
b)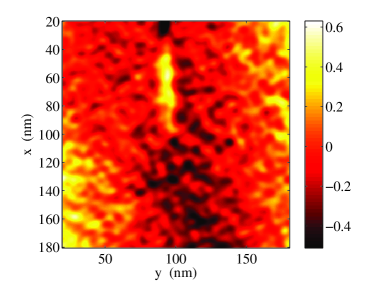 c)
c)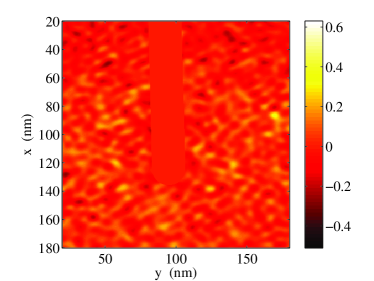 d)
d)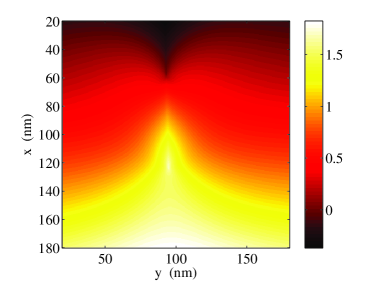 e)
e)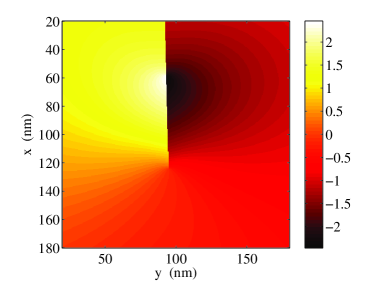 f)
f)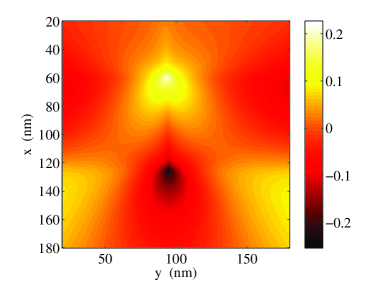
Going to the smaller scan size of 200 nm, a number of additional difficulties arises: First the precise reposition of the same zone is done within a few tens of nanometers, i.e. a large fraction of the scanned image and such a large offset is more difficult to handle for DIC. This difficulty was taken care of by a prior rough determination of the mean translation. Second, the fluctuations in the “slow scan” direction are much more intense than in the fast scan direction (here transverse to the cracks). This high frequency noise of amplitude 0.9 Å is only partly corrected by the “flattening” filter used and it makes the computation of image gradient insecure. To further limit this noise, a low-pass Fourier filtering was applied on the image at the cut-off frequency for which the slow and fast scan power spectra depart from each other. For 200 nm images, although being composed of 512512 pixels, wavelengths below 4 pixels (i.e. about 1.5 nm) were filtered out. Another major difficulty comes from uneven step sizes in the slow scan direction. A simple bare eye inspection does reveal that indeed, images appear to be either dilated or expanded along the slow scan direction by a significant amount. Similarly, due to inaccuracies in the reposition at the beginning of each new line an artificial simple shear can be introduced. Thus, we implemented additional degrees of freedom in the kinematics, (i.e. uniform and linearly varying strain along the slow scan direction, and uniform shear strain) corresponding to these artefact deformation modes. Finally, it is worth mentioning that pointing at the crack tips, even from phase images, is quite delicate and does contribute to the final uncertainty.
With those additional procedures, image series could be analyzed successfully, in the sense that the residual, , could be brought down to 5-6%. A visual check based on the comparison between reference and corrected deformed images indeed confirms the reliability of the image matching, and hence the robustness of the algorithm, in spite of the significant level of noise in the images. Measurements of the mean strain along the slow-scan direction revealed strains which could be as large as 8%. In the example shown in Fig. 4, the SIF is estimated to be 0.44 MPa.m1/2, the axis strain is 1.6%, and the residual amounts to . Ignoring the most strained image pair, the SIF value was estimated in the range MPa.m1/2. Varying the size of analyzed domain, and the cut-off frequency induces only very slight modifications in the estimates of the SIF. The estimate MPa.m1/2 is again consistent with the macroscopic determination and the larger scale AFM IDIC estimate. Most of the uncertainty lies in the precise identification of the crack tip location. As can be seen in the residual map shown in Fig. 4(c), no systematic bias can be distinguished even in the vicinity of the crack tips.
Based on those quantitative observations, no evidence of a breakdown of linear fracture mechanics — eventually due to micro-damage or plasticity — could be observed even in the immediate vicinity (within 10 nm) of the crack tip. The present IDIC technique has thus proven to be suited to measuring stress-intensity factors in brittle materials by comparing pairs of AFM images of the external sample surface taken at different stages of crack propagation. Moreover, this analysis gives an original insight into the out-of-plane displacement fields of the free surface in the neighborhood of a propagating crack tip, which is presently an open subject of research.
Acknowledgements.
It is a pleasure to acknowledge useful discussionss with F. Hild, C. Marlière, F. Célarié, T. Fett and S. M. Wiederhorn. This work was supported by the ANR project CORCOSIL (BLAN07-3_196000).References
- [1] \NameFreiman S. W., Wiederhorn S. M. Mecholsky J. J. \REVIEWJ. Am. Ceram. Soc.9220091371.
- [2] \NameCiccotti M. \REVIEWJ. Phys. D: Appl. Phys.422009214006.
- [3] \NameCélarié F. \BookPh.D. thesis \PublUniversité Montpellier 2, France \Year2004.
- [4] \NameFett T., Rizzi G., Creek D., Wagner S., Guin J.-P, López-Cepero J. M. Wiederhorn S. M. \REVIEWPhys. Rev. B772008174110.
- [5] \NameCélarié F., Ciccotti M., Marlière C. \REVIEWJ. Non-Cryst. Solids353200751.
- [6] \NameGrimaldi A., George M., Pallares G., Marlière C. Ciccotti M. \REVIEWPhys. Rev. Lett.1002008165505.
- [7] \NameDimitrov A., Buchholz F.-G. Schnack E. \REVIEWComp. Mod. Engng. Sci.122006125.
- [8] \NameSutton M. A., Wolters W. J., Peters W. H., Ranson W. F. McNeill S. R. \REVIEWImage Vis. Comput.119831333.
- [9] \NameSutton M. A., Turner J. L., Bruck H. A. Chae T. A. \REVIEWExp. Mech.311991168.
- [10] \NameRoux S. Hild F. \REVIEWInt. J. Fract.1402006141.
- [11] \NameYoneyama S., Ogawa T. Kowabayashi Y. \REVIEWEng. Fract. Mech.7420071399.
- [12] \NameRoux S., Réthoré J. Hild F. \REVIEWJ. Phys. D: Appl. Phys.422009214004.
- [13] \NameRéthoré J., Roux S. Hild F. \REVIEWPreprint2009.
- [14] \NameChasiotis I. Knauss W. G. \REVIEWExp. Mech.42200251.
- [15] \NameCho S. W., Cárdenas-Garía J. F. Chasiotis I. \REVIEWSens. Actuators A Phys.1202005163.
- [16] \NameCho S. W., Chasiotis I., Friedman T. A. Sullivan J. \REVIEWJ. Micromech. Microeng.252005728.
- [17] \NameCho S. W. Chasiotis I. \REVIEWExp. Mech.47200737.
- [18] \NameCho S. W., Jonnalagadda K. Chasiotis I. \REVIEWFatigue & Fract. Eng. Mat. Struct.30200721.
- [19] \NameXu Z.-H. Li X.-D., Sutton M. A. Li N. \REVIEWStrain Analys.432008729.
- [20] \NamePallares G., Ponson L., Grimaldi A., George M., Prevot G. Ciccotti M. \REVIEWInt. J. Fract.156200911.
- [21] \NameFett T., Rizzi G., Guin J.-P., López-Cepero J. M. Wiederhorn S. M. \REVIEWEng. Fract. Mech.762009921934.
- [22] \NameWilliams M. L. \REVIEWASME J. Appl. Mech.241957109.
- [23] \NameHild F., Raka B., Baudequin M., Roux S. Cantelaube F. \REVIEWAppl. Optics4120026815.
- [24] \NameWondraczek L., Ciccotti M., Dittmar A., Oelgardt C., Célarié F. Marlière C. \REVIEWJ. Am. Ceram. Soc.892006746.
- [25] \NameBenthem J. P. \REVIEWInt. J. Solid Structures131977479