UNUSUAL TRENDS IN SOLAR P-MODE FREQUENCIES DURING THE CURRENT EXTENDED MINIMUM
Abstract
We investigate the behavior of the intermediate-degree mode frequencies of the sun during the current extended minimum phase to explore the time-varying conditions in the solar interior. Using contemporaneous helioseismic data from GONG and MDI, we find that the changes in resonant mode frequencies during the activity minimum period are significantly greater than the changes in solar activity as measured by different proxies. We detect a seismic minimum in MDI p-mode frequency shifts during 2008 July–August but no such signature is seen in mean shifts computed from GONG frequencies. We also analyze the frequencies of individual oscillation modes from GONG data as a function of latitude and observe a signature of the onset of the solar cycle 24 in early 2009. Thus the intermediate degree modes do not confirm the onset of the cycle 24 during late 2007 as reported from the analysis of the low-degree GOLF frequencies. Further, both the GONG and MDI frequencies show a surprising anti-correlation between frequencies and activity proxies during the current minimum, in contrast to the behavior during the minimum between cycles 22 and 23.
1 INTRODUCTION
The current solar minimum, between cycles 23 and 24, has been unusually long and has provided us with a unique opportunity to characterize the quiet sun. It is also the first deep minimum to be observed with modern instrumentation and techniques including helioseismology. In order to understand what causes and sustains such a prolonged period with minimal or no solar activity, as commonly measured by the number of sunspots on the visible solar disk, numerous efforts are underway to find clues to such an unusual behavior. In this context, we use the frequencies of the global oscillation modes of the sun to learn about the seismic conditions of the solar interior during the current minimum phase.
The variation of the oscillation frequencies with solar cycle has been the subject of many studies and is now well established (see, for example, Jain, Tripathy, & Hill, 2009, and references therein). However, the physical origin of these changes is still an active field of research. The extended minimum activity epoch has provided an important period to analyze and interpret the frequency variations during quiet periods of solar activity. Broomhall et al. (2009) have analyzed the low-degree, (0 3) mode frequencies over the last three solar cycles using Birmingham Solar Oscillations Network (BiSON) frequencies, and they find that the level of the present minimum is significantly deeper in the mode frequencies than in the surface activity observations. Salabert et al. (2009) have examined the low-degree modes from the Global Oscillations at Low Frequency (GOLF) time series. They report that the frequency shifts of the = 0 and = 2 modes show an increase starting in the second half of 2007 while the = 1 mode follows the general decreasing trend of the solar surface activity and interpret the different behavior as arising from different geometrical responses to the spatial distribution of the magnetic field beneath the solar surface. Based on this, they argue that solar cycle 24 started during the last quarter of 2007. The result is quite intriguing since no such evidence is seen in the BiSON data. Figure 1 of Broomhall et al. (2009) shows that both the frequency shifts and activity as measured by the 10.7 cm radio flux (hereafter, ) continue to decrease through 2009 April. Also, the preliminary investigation of Jain et al. (2009) using 36-d GONG frequencies did not detect the onset of the new cycle until the end of 2008. However, the torsional oscillations inferred from medium-degree p-modes indicated that the minimum was reached during 2008 (Howe et al., 2009).
Figure 1 shows the current level of solar surface activity as measured by four different proxies: , the International sunspot number111both and are obtained from http://www.ngdc.noaa.gov/STP/SOLAR/getdata.html, , the Total Solar Irradiance (TSI; Kopp, Lawrence, & Rottman, 2005) and Magnetic Plage Strength Index (MPSI; Ulrich, 1991). We plot the mean monthly variations for the period 2007 January to 2009 September and observe that there are significant differences in the behavior of different activity proxies. For example, shows an increase in activity beyond 2008 July signaling the onset of a new cycle while no such clear trend can be observed in TSI. In contrast, the sunspot number shows a deep minimum in 2009 August with a monthly mean value of zero as no sunspots were observed that month. The indices, however, display a uniform behavior when we plot the smoothed monthly mean activities (solid lines) obtained from a boxcar average of 13 points. All of the activity proxies show a rising trend since the beginning of 2009 January indicating that the solar minimum has already occurred. A recent analysis also confirms that the minimum in activity, as measured by the absolute solar EUV flux, occurred on 2008 November, 28 (Didkovsky, Judge, & Wieman, 2009).
Given the argument of Salabert et al. (2009) that the even, low-degree modes sense the onset of the new solar cycle during late 2007 and the absence of such a signature in BiSON data has motivated us to critically examine the behavior of medium-degree mode frequencies with a particular emphasis on activity minimum phases. In this letter, we present results obtained from the p-mode acoustic frequencies measured by the Global Oscillation Network Group (GONG) and the Michelson Doppler Imager (MDI) onboard Solar and Heliospheric Observatory (SOHO) spacecraft. We also investigate the latitudinal variations of the shifts obtained from the frequencies of individual modes, where is the radial order and is the azimuthal order.
2 ANALYSIS AND RESULTS
The MDI mode frequencies222http://quake.stanford.edu/$∼$schou/anavw72z/ that we use consist of 66 sets, each of which is calculated from a time series of 72 days (Schou, 1999) and covers the period between 1996 May 1 and 2009 September 26. We also use 72-day long GONG time series to calculate the centroid frequency, , for each () multiplet (Hill et al., 1996) for each of 71 non-overlapping sets that covers the period between 1995 May 7 and 2009 May 4, a few months shorter than the MDI frequencies. The mean frequency shift, , for each data set is obtained as a error-weighted mean where the error corresponds to the formal fitting uncertainties returned by the fitting procedure. The frequencies were also weighted by the mode inertia before the mean was computed (For details see Tripathy et al., 2007). We analyze only those modes that are present in both the data sets. The included modes cover a frequency range of 1500 Hz 3600 Hz and degree range of 22 150 and sample the outer 30% of the solar interior. For calculating the frequency shifts, we construct a reference frequency as an average over the frequencies of a given multiplet present in all MDI data sets. The same set of reference frequencies are used to calculate the mean shifts from the GONG data. This choice introduces a constant offset between MDI and GONG shifts and does not affect the results.
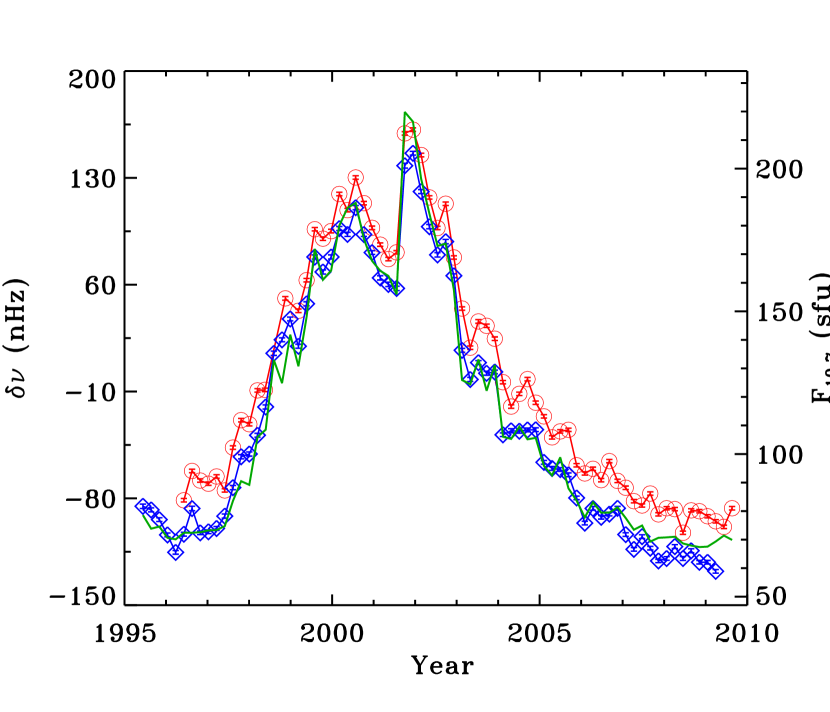
As a proxy for the solar activity, we choose which represents a combination of sunspots, radio plages and quite-sun background emission (Kundu, 1965) and the International sunspot number, . The former is chosen so that our results can be compared with those of Broomhall et al. (2009) and Salabert et al. (2009), while the later is chosen because it acts as a universal activity indicator. Figure 2 shows the temporal variations of the GONG and MDI frequency shifts and the linearly scaled averaged over the same time period as the length of the time series. On the time scale of the solar cycle, frequency shifts and solar activity exhibit the well established linear relationship as measured by the Pearson’s correlation coefficient, = 0.99 for both GONG and MDI.
For a comprehensive and comparative analysis between previous and current activity minima, the GONG frequency shifts and the corresponding during these two periods are shown in Figure 3. The dash-dot and dash-dot-dot-dot lines in Figure 3b indicate the minimum value in activity and frequency shifts corresponding to the previous cycle, respectively and indicate differences between the current and last minima. Both and frequency shifts appear weaker this minimum than the previous; the decrease in mean frequencies and activity are of the order of 11% and 4%, respectively implying a significant change in oscillation frequencies as compared to the solar activity. A similar result seen in BiSON low-degree modes led Broomhall et al. (2009) to conclude that the changes in frequencies are deeper than the surface activity. During the extended minimum we also observe discrepancies in the behavior of and . The oscillation frequencies continue to decrease through 2009 April (end of data) while the solar activity as measured by shows a minimum near the end of 2008 and an increasing trend thereafter. This reflects a deviation from the assumed linear relationship between the two indicating an anti-correlation. No such behavior is seen in the previous minimum period (Figure 3a). Therefore the relationship between and solar activity proxies during the current extended minimum phase appears to be more complex than the previous minimum between cycles 22 and 23.
Since different activity proxies behave differently during the activity cycle (Figure 1) and some proxies are better correlated with frequency shifts than others (Chaplin et al., 2007; Jain, Tripathy, & Hill, 2009), we compare the variation of MDI frequency shifts with two different proxies, (Figure 4a) and (Figure 4b), for the present minimum period. It is seen that the frequency shifts are in better agreement with rather than with a marginally higher correlation coefficient. This does not agree with the argument that the frequency shifts are more sensitive to both the strong and weak components of the magnetic field (Chaplin et al., 2007; Jain, Tripathy, & Hill, 2009). Thus, we see additional evidence of the complex relationship between frequency shifts and activity proxies in different phases of the solar activity and particularly during the extended minimum period.
Furthermore, we note an anti-correlation between the MDI frequency shifts and both of the activity indices starting from the end of 2007 ( 0.1) similar to those seen in GONG frequency shifts. The correlation coefficient decreases to 0.5 if we consider the variation between 2008 July and the end of the data. Although the value of the coefficients are not significant, the signature that the frequency shifts and solar activity proxies are opposite in phase is important since this has not been seen in previous cycles. Therefore, the extended minimum period appears to be rather unusual since all earlier studies involving the frequency shifts report close correlations between the frequency shifts and solar surface activity proxies.
Figure 4 reveals a minimum in frequencies during the 2008 May–July period and a minimum in during 2008 July-August which is earlier by a few months in comparison to the minimum seen in . Both of the activity proxies suggest that the solar minimum has already occurred with a phase lag of nearly two and five months between , and and , respectively. However, we note that is showing a downward trend during 2009 September and if this downward trend continues, the minimum in activity may shift to a later period.
Since the oscillations are sensitive to the conditions beneath the solar surface, it is not surprising that the signature of the onset of solar cycle 24 is first visible in the oscillation data. The absence of such a signature in GONG data could be related to the mode fitting techniques used by the data reduction pipelines as has been demonstrated in earlier studies (Schou et al., 2002; Basu et al., 2003). The GONG technique fits one individual mode (, , ) at a time together with a number of leaks from other but ignores known leaks from modes with the same (, ) but different . The MDI algorithm, on the other hand, fits all modes of all for a given multiplet (, ) simultaneously and uses a combination of leakage matrix and the known parameters from the fitting of other modes to estimate the leaks from these modes.
The GONG mode-fitting algorithm, in addition to the rotation corrected frequencies, also produces frequencies of individual modes as function of , , , where represents the number of nodal lines around the equator (Hill et al., 1996). It is possible to follow the changes in oscillation modes as a function of the latitudes using different values of /. The sectoral ( = 1) and near sectoral modes are sensitive to the region near the equator while zonal ( = 0) and tesseral modes (0 1) sense a wider range of latitudes away from the equator (Komm, Howe, & Hill, 2002). In Figure 5 we show the mean relative frequency shifts, , in the 5-min band (2800 3200; 20 100) for four different values (0.5 0.8) representing mid latitudes during the extended minimum period; the mean shifts are calculated with reference to the model frequencies used by the GONG pipeline. It is evident that the frequency shifts during the current minimum phase are greater as compared to the minimum in 1996 (shown by the dotted lines in each panel) and continue a downward trend for = 0.5 and 0.8. In contrast, for the other two values of that are closer to the latitudinal belt where solar activity first appears during the onset of a solar cycle, the shift indicates an increasing trend starting from early 2009. This may be the first seismic signature of the beginning of the solar cycle 24 since this epoch is closer to the period of minimum solar activity. The evidence, however, is based on one data point and will require additional data for confirmation.
3 SUMMARY
Using contemporaneous helioseismic frequencies from GONG and MDI, we investigated the behavior of the oscillation frequencies of the sun during the extended minimum phase of the current solar cycle. We find that the state of the solar interior as measured by the oscillation frequencies is varying significantly in time even if the traditional measures of solar surface activity, such as sunspot number, magnetic field strength indices, or the 10.7 cm radio flux are nearly constant. The MDI frequency shifts indicate a “seismic” minimum around mid 2008 while no such signature is seen in the GONG data. However, the relative frequency shifts calculated from individual GONG multiplets hints at the start of the solar cycle 24 in early 2009.
Although low degree modes carry information from the deep interior, their dwell time near the surface is higher than in the core because the sound speed inside the sun increases rapidly with depth. Thus, both low and intermediate degree modes are most influenced by the conditions near the solar surface. Therefore it is a puzzle that the low degree mode frequencies measured from the GOLF data support an early onset of solar cycle 24 during the last quarter of 2007 (Salabert et al., 2009) while no such evidence is seen in the BiSON low-degree modes (Broomhall et al., 2009) or the intermediate-degree modes from GONG. MDI frequencies, on the other hand, indicate a seismic minimum but the period is about one and half year later than seen in the GOLF data. It is important to note that the frequency shifts calculated from intermediate degree modes or BiSON low degree modes represent averages over all modes whereas the shifts obtained from GOLF data correspond to individual low degree modes. Moreover, both the GONG and MDI frequencies show a surprising anti-correlation between frequencies and activity proxies during the current minimum, in contrast to the behavior during the previous minimum between cycles 22 and 23 indicating that the current minimum is unusual. This also suggests that in addition to the surface magnetic activity, the variations in oscillation frequencies may be caused by some other effects e.g. changes in the structure of the Sun below the photosphere.
References
- Basu et al. (2003) Basu, S., Christensen-Dalsgaard, J., Howe, R., Schou, J., Thompson, M. J., Hill, F., & Komm, R. 2003, ApJ, 591, 432
- Broomhall et al. (2009) Broomhall, A.-M, Chaplin, W. J., Elsworth, Y., Fletcher, S. T., & New, R. 2009, ApJ, 700, L62
- Chaplin et al. (2007) Chaplin, W. J., Elsworth, Y., Miller, B. A., Verner, G. A. & New, R. 2007, ApJ, 659, 1749
- Didkovsky, Judge, & Wieman (2009) Didkovsky, L. V., Judge, D. L., & Wieman, S. R. 2009, astro-ph/0911.0870v1
- Hill et al. (1996) Hill, F. et al. 1996, Science, 272, 1292
- Howe et al. (2009) Howe, R., Christensen-Dalsgaard, J., Hill, F., Komm, R., Schou, J., & Thompson, M. J. 2009, ApJ, 701, L87
- Jain, Tripathy, & Hill (2009) Jain, K., Tripathy, S. C., & Hill, F. 2009, ApJ, 695, 1567
- Jain et al. (2009) Jain, K., Tripathy, S. C., Burtseva, O., González Hernández, I., Hill, F., Howe, R., Kholikov, S., Komm, R., & Leibacher, J. W. 2009, ASP Conf. Ser., submitted
- Komm, Howe, & Hill (2002) Komm, R., Howe, R., & Hill, F. 2002, ApJ, 572, 663
- Kopp, Lawrence, & Rottman (2005) Kopp, G., Lawrence, G., & Rottman, G. 2005, Solar Phys., 230, 129
- Kundu (1965) Kundu, M. R. 1965, Solar Radio Astronomy (New York: Interscience Publication)
- Salabert et al. (2009) Salabert, D., Garcia, R. A., Palle, P. L., & Jimenez-Reyes, S. J. 2009, A&A, 504, L1
- Schou (1999) Schou, J. 1999, ApJ, 523, 181
- Schou et al. (2002) Schou, J. Howe, R., Basu, S., Christensen-Dalsgaard, J., Corbard, T., Hill. F, Komm, R., Larsen, R. M., Rabello-Soares, C. M., & Thompson, M. J. 2002, ApJ, 567, 1234
- Tripathy et al. (2007) Tripathy, S. C., Hill, F., Jain, K., & Leibacher, J. W. 2007, Solar Phys., 243, 105
- Ulrich (1991) Ulrich, R. K. 1991, Adv. Space Res., 11, 217