Fast infrared variability from a relativistic jet in GX 339–4††thanks: Based on observations made with ESO Telescopes at the Paranal Observatory under programme ID 281.D-5034
Abstract
We present the discovery of fast infrared/X-ray correlated variability in the black-hole transient GX 339-4. The source was observed with sub-second time resolution simultaneously with VLT/ISAAC and RXTE/PCA in August 2008, during its persistent low-flux highly variable hard state. The data show a strong correlated variability, with the infrared emission lagging the X-ray emission by 100 ms. The short time delay and the nearly symmetric cross-correlation function, together with the measured brightness temperature of K, indicate that the bright and highly variable infrared emission most likely comes from a jet near the black hole. Under standard assumptions about jet physics, the measured time delay can provide us a lower limit of for the Lorentz factor of the jet. This suggests that jets from stellar-mass black holes are at least mildly relativistic near their launching region. We discuss implications for future applications of this technique.
keywords:
black hole physics - stars: winds, outflows - X-rays: binaries - X-rays: individual: GX 339–41 Introduction
The wealth of multi-wavelength observations of X-ray binaries (XBs) over the past decade have made clear the ubiquity of jets in these systems (see Fender, 2006, for a review). These jets are thought to be the origin of the observed radio emission. The soft X-ray flux is generally believed to come predominantly from accretion discs around these compact objects, while the hard X-ray flux is thought to arise from a hot Comptonizing corona and/or from the jet itself. Recently it has been shown that also the infrared (IR) emission includes a substantial contribution from the relativistic jet, in the hard states of XBs (e.g. Corbel & Fender, 2002; Malzac, Merloni & Fabian, 2004; Russell, Fender & Jonker, 2007). Despite the rapid increase in our phenomenological understanding of jets from XBs, we still lack a fundamental understanding of how jets are powered and collimated, or what the bulk and internal properties of the jets are.
High-speed simultaneous optical/X-ray photometry of three accreting black holes (BHs) opened a new promising window. A complex correlated variability in the optical and X-ray emission (Spruit & Kanbach, 2002) was seen from XTE J1118+480, while fast optical photometry of SWIFT J1753.5-0127 (Durant et al., 2008) and GX 339–4 (Gandhi et al., 2008) revealed further complexity. Malzac et al. (2004) explained the behaviour observed in XTE J1118+480 through coupling of an optically emitting jet and an X-ray emitting corona in a common energy reservoir. An alternative explanation comes from the magnetically driven disc corona model (Merloni, Di Matteo & Fabian, 2000): magnetic flares happen in an accretion disc corona where thermal cyclo-synchrotron emission contributes significantly to the optical emission, while the X-rays are produced by Comptonization of the soft photons produced by dissipation in the underlying disc and by the synchrotron process itself. The two explanations differ substantially in the predictions at IR wavelengths, where a jet appears as the most probable origin for the emission (e.g. Russell et al., 2006).
The BH candidate GX 339–4 is a recurrent X-ray transient (Markert et al., 1973). It has been detected as a highly variable source from radio through hard X-rays (see e.g. Makishima et al., 1986; Corbel et al., 2000; Coriat et al., 2009, and references therein). Optical spectroscopy indicates a mass function of 5.8 0.5 M and a minimum distance of 6 kpc (Hynes et al., 2003, 2004). Multiwavelength campaigns clearly reveal a non-thermal contribution to the infrared (IR) emission in the hard state, most probably arising from a compact jet (Corbel & Fender, 2002). It is the first BH XB for which fast optical/X-ray correlated variability was observed (Motch, Ilovaisky & Chevalier, 1982).
Past variability studies on timescales of several seconds have been used to suggest a jet origin for IR emission from XBs (e.g. Hynes et al., 2003; Eikenberry et al., 2008). In this Letter, we report on the first simultaneous fast (i.e. sub-second) timing IR/X-ray observations of GX 339–4, during its 2008 low luminosity hard state.
2 Observations
2.1 Infrared data
We observed GX 339-4 from ESO’s Paranal Observatory on 18 August 2008. We obtained fast -band photometry with the Infrared Spectrometer And Array Camera (ISAAC) (Moorwood et al., 1998) mounted on the 8.2-m UT1/Antu telescope. The 2323 window used encompassed the target, a bright ‘reference’ star (KS=9.5) located 13.6 arcsec south of our target and a fainter ‘comparison’ star (KS=12.8) 8.9 arcsec north-east of GX339-4.
We used the “FastJitter mode” with a time resolution of 62.5 ms. This generated cubes of data with 2500 images apiece, and with a 3 s deadtime between cubes. The ULTRACAM pipeline111We thank Tom Marsh for the use of the ULTRACAM pipeline software (http://deneb.astro.warwick.ac.uk/phsaap/software/). was used for the data reduction, after applying a barycenter correction for Earth motion. We performed fixed-aperture photometry of the three sources (target, reference and comparison stars) and used the bright reference star for relative photometry of the target and comparison stars. The positions of the aperture regions around the target and the comparison star were linked to the position of the bright reference star to allow for image motion and were updated at each time step. The atmospheric conditions were good and the resulting light curve for the comparison star was consistent with a constant, as expected. By combining all 250000 images, we estimate a de-reddened (=3.9, =0.445– Cardelli, Clayton & Mathis, 1989) average magnitude of KS=12.00.2 for GX 339-4, which corresponds to an average flux of erg s-1 cm-2. A sample of the highly variable light curve for GX 339-4 is shown in the bottom panel of Fig. 1.

2.2 X-ray data
Simultaneously with the IR observations, GX 339–4 was observed with the Proportional Counter Array (PCA) onboard the Rossi X-ray Timing Explorer (RXTE). Two proportional counter units (PCUs) were active during the whole observation. The X-ray data span three consecutive satellite orbits, for a total exposure of 4.6 ksec. The Binned Mode (8 ms time resolution) was used for this analysis, using the 2-15 keV energy range (channels 0-35). The barycenter correction for Earth and satellite motion was applied. Standard HEADAS 6.5.1 tools were used for data reduction. In the upper panel of Fig. 1 we show a sample of the light curve, corresponding to the second RXTE orbit. Spectral fitting with a power-law with photon index 1.6 results in a 2–10 keV unabsorbed flux of erg s-1 cm-2.
3 Cross-correlation function (CCF)
Both datasets have an absolute time accuracy better than the time resolution used here: ISAAC data have a timing accuracy of about 10 ms (the readout time), while RXTE data have a timing accuracy of 2.5 s (Jahoda et al., 2006).
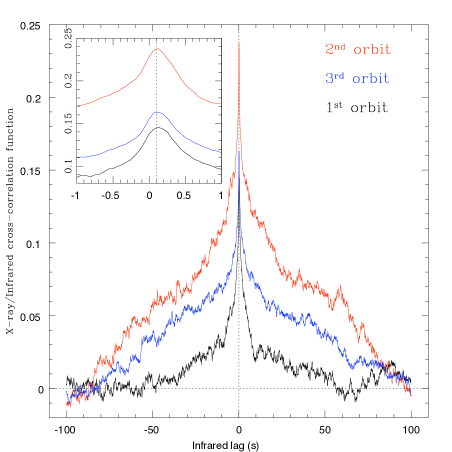
From Fig. 1 a strong correlation between X-ray and IR flux is evident. Both long, smooth variability and short, sharper flares appear with similar relative amplitude in the two energy bands. In order to measure any time delay, we calculated a CCF for each of the three RXTE orbits, without applying any de-trending procedure. The results are shown in Fig. 2. The strong correlation is confirmed. The CCF appears highly symmetric and relatively stable over the three time intervals, with the change in amplitude simply reflecting the different variability amplitude in the light curves themselves. In the inset, we show a zoom on the peak of the CCF, which shows how the IR emission lags the X-rays by 0.1 seconds, to which we associate an uncertainty of 30 (which includes systematics).
4 Discussion
The main result of our work is the discovery of a strong correlation between the IR and the X-ray variability in GX 339–4. The fact that the CCF is nearly symmetric and peaks at 100 ms rules out a reprocessing origin for the IR variability. If the IR radiation arose from reprocessing of X-rays by the outer disk, the short time delay would imply a highly inclined disk. This would produce an highly asymmetric CCF, with a tail at long lags (O’Brien et al., 2002).
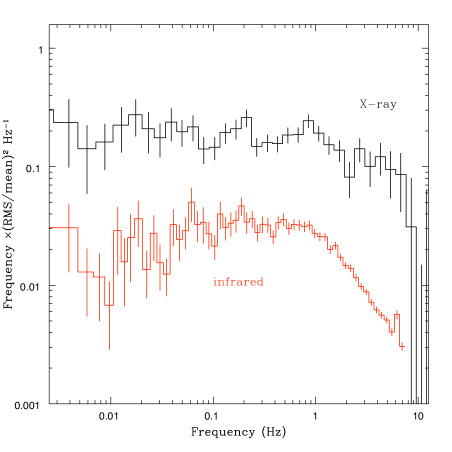
Additionally, power spectral analysis shows significant IR variability (at least 5% fractional rms, see Fig. 3) on timescales of 200 ms or shorter, which sets an upper limit of 109 cm to the radius of the IR-emitting region. From (5% of) the observed IR average flux of erg s-1 cm-2, we derive a minimum brightness temperature of K. Optically thick thermal emission of the derived size and temperature would result in a 2–10 keV flux in excess of erg s-1 cm-2, which is not observed in the data. These values represent very conservative estimates: a smaller region emitting the IR radiation would result in a higher brightness temperature, which would in turn result in a higher expected X-ray luminosity. With similar arguments we exclude thermal Bremsstrahlung emission. The existence of an IR lag is also inconsistent with the magnetic corona model (Merloni et al., 2000), in which the same population of electrons produces the IR synchrotron emission and the X-ray Compton emission. We conclude that the most plausible origin for the observed IR variability is synchrotron emission from the inner jet.222This is confirmed by nearly-simultaneous optical and IR observations, obtained while the source was in the same low-luminosity state. Those data (Lewis et al., in prep.) show a flat or inverted spectrum (inconsistent with thermal emission from a disc or companion star), and a long-timescale (minutes) variability stronger in IR than in optical.
This result is a new, independent strong indication that jet synchrotron emission contributes significantly to the IR radiation in this source. This is the first time that hard-state, compact jet emission has been securely identified to vary on sub-second timescales in an XB, although variability on similar dynamical timescales tDyn (i.e., scaled to mass) had been already observed in Active Galactic Nuclei (e.g. Schödel et al., 2007). These data thus represent a further step forward towards a full unification of the accretion/ejection process over a broad range of black-hole masses.
4.1 Emitting regions and jet speed
Our data strongly suggest that the variable IR emission comes from the jet, although we cannot conclude whether it is optically–thick or –thin synchrotron. The X-ray emission is usually interpreted as Comptonized radiation from energetic plasma in the very inner regions of the accretion flow, although the actual emitting region is still an open issue (either a corona or the base of the jet itself, for a discussion see Markoff, Nowak & Wilms, 2005; Maccarone, 2005, Malzac et al. 2009). Here we discuss the four possible scenarios.
1) IR: optically thick - X-ray: inflow emission: the observed time delay between the IR and the X-ray variability gives an upper limit (given the unknown time for the ejection to take place) to the travel time of the variability – thus presumably the matter – along the jet. Given a measure of the jet elongation we could estimate the jet speed. Such a measure is not available for GX 339-4; however, a jet elongation measurement has been reported from 8.4 GHz observations of another BH XB, Cyg X-1 (Stirling et al., 2001). Within the standard model for compact jets (Blandford & Königl, 1979, – BK79), the distance from the black hole of an emitting region in the jet is a function of the observed wavelength, the viewing angle, and the jet physical properties.
Assuming that the main physical properties of the jet do not change, we can rescale the jet elongation measured at radio wavelengths in the BH Cyg X-1 down to the IR wavelengths, obtaining a measurement of the distance of the IR-emitting region in the jet from the black hole in GX 339-4. Heinz & Merloni (2004) showed that the small observed scatter in the radio/X-ray fluxes relation (Gallo, Fender & Pooley, 2003) implies that all stellar-mass BHs have very similar jet velocities, with a 3-sigma spread of . (We note however that there is an increasing population of radio-quiet sources, whose nature is not yet understood (see e.g. Gallo, 2007; Casella & Pe’er, 2009, Soleri et al. submitted.; and references therein). Their inclusion in the radio/X-ray flux correlation increases the scatter of the correlation itself, so the conclusions drawn by Heinz & Merloni (2004) do not necessarily hold any longer.)
We can use Eq. 28 of BK79 to obtain the GX 339–4 jet elongation in IR, and thus the jet speed. We calculate the jet speed for a total of sets of parameters, with each parameter randomly chosen within its measured permitted range. For Cyg X–1, we use a distance of 2.00.2 kpc (Gierlinski et al., 1999) and a source inclination over the 20∘-70∘ range (Dolan, 1992; Ziolkowski, 2005). We use a projected jet elongation of LDkpc cm (where is the distance of Cyg X-1 in kpc), to which we attribute a 50% uncertainty. For GX 339-4, we used the minimum distance of 6 kpc (Hynes et al., 2003, 2004) and a range of inclination angles 15∘-60∘ (Cowley et al., 2002; Miller et al., 2008).
We use the X-ray luminosity as a tracer of jet kinetic power, under the additional assumption that the jet power follows the relation (Fender, Gallo & Jonker, 2003). We estimate the X-ray (2–10 keV) fluxes of the two sources through spectral fitting of the RXTE data simultaneous to the IR (GX 339–4, erg cm-2 s-1) and radio (Cyg X–1, erg cm-2 s-1) observations, and we attribute a 50% uncertainty to both values, to account for the uncertainties in the scaling.
We obtain a 3.3- lower limit of . It is important to remember that the reliability of this estimate depends on the key assumptions made in BK79 being true – the most important of these, that particle acceleration along the jet is continuous and counterbalances energy losses in order to preserve the flat spectrum – is largely untested (see e.g. Kaiser, 2006; Pe’er & Casella, 2009). However, we have chosen very conservative ranges for all parameters. The lowest Lorentz factors (2–3) are obtained only for small angles of Cyg X–1, for the minimum Cyg X–1 jet elongation within the allowed range and for the minimum GX 339–4 distance. We conclude that, if the IR synchrotron emission is optically-thick, these data suggest that the jets from accreting stellar-mass BHs are at least mildly relativistic, also in their common low/hard state. If, as is widely suggested, the jet speed corresponds to the escape speed at the launch point, this might imply that the jet is launched from a region very close to the black hole itself.
The obtained values of might allow us further considerations. Assuming a random distribution of jet inclination angles for the known population of stellar-mass BHs (i.e., P sin), all with a Lorentz factor of 2, about 57% of them would appear de-boosted. This percentage increases up to 70% for , and up to 77% for . Thus our jet speed estimate suggests that more than half of the jet luminosities measured from BHs in our Galaxy might have been underestimated. If this is true, there might be a population of BH binaries with very high radio to X-ray ratios, which will be revealed in our and other galaxies by future radio all-sky monitors and large radio telescopes. The obtained estimate for has several caveats, or at least large uncertainties. Future monitoring observations with the same technique will allow to refine this measure, studying the relative dependency of this quantity with the varying accretion rate or total luminosity
2) IR: optically thin - X-ray: inflow emission: this scenario is actually twofold: the IR optically thin emission could originate at the first shock in the jet, or further away after cooling. In the first case, the observed time delay would measure the ejection and first acceleration timescale. In the second case, since we expect the spectral break to be around the IR wavelengths, we can approximate the IR radiation as if it was optically thick, and use Eq. 28 of BK79 as above. Thus, the lines of reasoning described in the previous scenarios hold, as well as the lower limit to the jet speed.
3) IR: optically thick - X-ray: jet emission: the reasoning described in the first scenario, as well as the resulting lower limit for , still hold, provided that the X-ray emission is not boosted (for a discussion about the evidence for this be the case, see Heinz & Merloni, 2004).
4) IR: optically thin - X-ray: jet emission: the electron populations emitting at IR and X-ray wavelengths cannot be co-located, since we observe a delay, which here must represent a cooling time. If we assume that the X-ray emission gives us a measure of the characteristic energy of the emitting electrons, we can place an upper limit on the magnetic field intensity in the jet (see e.g. Takahashi et al., 1996, for a use of this method in blazars). We obtain a unique solution for the system, with a magnetic field intensity of B Gauss, an initial Lorentz factor of the electrons of , which becomes after they cool down as to emit in IR. Electron re-acceleration (e.g. Jamil et al., 2009) would act as to counter balance the radiative losses, resulting in higher values for the magnetic field intensity.
4.2 Comparison with optical/X-ray CCFs
The main difference between this IR/X-ray CCF and the published optical/X-ray CCFs (for this as well for other BHs) is the longer IR wavelength itself, which allows us to put strong constraints on the emission processes. In the hard state of BHs, the jet is expected to dominate the IR emission (Russell et al., 2006, see also 2). In fact, as we discussed in the previous section, these data allow us to rule out any thermal origin for the observed variability. To put similar constraints using optical data, a much higher luminosity (or faster variability) is needed (see e.g. Motch et al., 1982).
Our CCF is very different from the one observed between the optical and the X-ray variability (Gandhi et al., 2008). Namely, the sharp positive peak in our dataset is not preceded nor followed by any dip. This might be due to the additional presence of a large long-timescale variability, which buries the short-timescale structure of the IR CCF. In fact we did not apply any detrending procedure to our data, while this has been partially done for obtaining the optical CCF (Gandhi et al., in prep.). That this can be the reason for the observed differences seems to be suggested also by the fact that the IR CCF with the lowest amplitude among the three orbits (black curve in Fig. 2) appears steeper towards the positive time delays, similarly to the optical/X-ray CCF of this source. On the other hand, it might be that the the dips observed in the optical CCFs arise from a spectral component which does not contribute much at IR wavelengths. A detailed study of this will be presented in future work.
The two CCFs differ also in the time delay measured at their peak: the optical/X-ray CCF peaks at ms, a 50-ms longer delay than IR (although we note that, depending on the uncertainty on the measured optical delay, the two delays might be marginally consistent within the errors). Given that the optical emission should come from closer to the black hole than the IR emission, this result is contrary to simple expectations. The two observations occured at similar X-ray luminosities, casting doubt on jet power variation as a reason for the longer optical than IR delay. However, the optical data were acquired after the decay of a bright outburst, while our IR data were acquired at the end of the rise of a weak outburst, suggesting a hysteresis effect might play a role (Vadawale et al., 2003; Fender, Belloni & Gallo, 2004; Russell et al., 2007). In particular, during/after the decay of an outburst the emission at a given wavelength might happen at larger distances from the black hole, because of the smaller amount of previously ejected matter that the jet encounters. Future simultaneous IR, optical and X-ray observations, at high-time resolution, will allow us to unveil some of these important unknowns, thus allowing us to test some of the physical assumptions which are now behind this method.
Acknowledgments
We thank the RXTE and VLT schedule planners for their successful efforts in scheduling these simultaneous observations. PC thanks ESO for the financial support, and the staff in Santiago for the friendly hospitality. PC thanks P. Gandhi, F. Panessa and G. Ponti for useful discussions. This work was partially supported by an NWO Spinoza grant to M. van der Klis. PC acknowledges funding via a EU Marie Curie Intra-European Fellowship under contract no. 2009-237722. DMR acknowledges support from a NWO Veni Fellowship. TB thanks ASI/INAF for support through grant I/088/06/0. TJM and TB thank the EU FP7 for support through grant number ITN 215212 ”Black Hole Universe”.
References
- Blandford & Königl (1979) Blandford R. D. & Königl A., 1979, ApJ, 232, 34
- Cardelli, Clayton & Mathis (1989) Cardelli J., Clayton G., Mathis J., 1989, ApJ, 345, 245
- Casella & Pe’er (2009) Casella P., Pe’er A., 2009, ApJL, 703, L63
- Corbel et al. (2000) Corbel S., Fender R. P., Tzioumis A. K., Nowak M., McIntyre V., Durouchoux P., Sood R., 2000, A&A, 359, 251
- Corbel & Fender (2002) Corbel S., Fender R. P., 2002, ApJ, 573, 35
- Coriat et al. (2009) Coriat M., Corbel S., Buxton M. M., Bailyn C. D., Tomsick J. A., Körding E., Kalemci E., 2009, MNRAS, tmp1311
- Cowley et al. (2002) Cowley A. P., Schmidtke P. C., Hutchings J. B., Crampton D.,2002, AJ, 123, 1741
- Dolan (1992) Dolan J. F., 1992, ApJ, 384, 249
- Durant et al. (2008) Durant M., Gandhi P., Shahbaz T., Fabian A. P., Miller J., Dhillon V. S., Marsh T. R., 2008, ApJ, 682, 45
- Eikenberry et al. (2008) Eikenberry S. S., Patel S. G., Rothstein D. M., Remillard R., Pooley G. G., Morgan E. H., 2008, ApJ, 678, 369
- Fender et al. (2003) Fender R.P., Gallo E., Jonker P.G., 2003, MNRAS, 343, 99
- Fender et al. (2004) Fender R. P., Belloni T., Gallo E., 2004, MNRAS, 355, 1105
- Fender (2006) Fender R. P., 2006, Jets from X-ray binaries, in Compact Stellar X-Ray Sources, ed. W. H. G. Lewin & M. van der Klis (Cambridge: Cambridge University Press), 381-419
- Gallo et al. (2003) Gallo E., Fender R., Pooley G., 2003, MNRAS, 344, 60
- Gallo (2007) Gallo E., 2007, AIP Conference Proceedings, 914, 715
- Gandhi et al. (2008) Gandhi P., Makishima K., Durant M., Fabian A. C., Dhillon V. S., Marsh T. R., Miller J. M., Shahbaz T., Spruit H. C., 2008, MNRAS, 390, L29
- Gierlinski et al. (1999) Gierlinski M., Zdziarski A. A., Poutanen J., Coppi P. S., Ebisawa K., Johnson W. N., 1999, MNRAS, 309, 496
- Heinz & Merloni (2004) Heinz S., Merloni A., 2004, MNRAS, 355, L1
- Hynes et al. (2003) Hynes R. I., Steeghs D., Casares J., Charles P. A., O’Brien K., 2003, ApJL, 583, L95
- Hynes et al. (2004) Hynes R. I., Steeghs D., Casares J., Charles P. A., O’Brien K., 2004, ApJ, 609, 317
- Jahoda et al. (2006) Jahoda K., Markwardt C. B., Radeva Y., Rots A. H., Stark M. J., Swank J. H., Strohmayer T. E., Zhang W., 2006, ApJS, 163, 401
- Jamil et al. (2009) Jamil O., Fender R., Kaiser C., 2009, MNRAS, tmp1543
- Kaiser (2006) Kaiser C. R., 2006, MNRAS, 367, 1083
- Maccarone (2005) Maccarone T. J., 2005, MNRAS, 360, 68
- Malzac et al. (2004) Malzac J., Merloni A., Fabian A., 2004, MNRAS, 351, 253
- Makishima et al. (1986) Makishima K., Maejima Y., Mitsuda K., Bradt H. V., Remillard R. A., Tuohy I. R., Hoshi R., Nakagawa M., 1986, ApJ, 308, 635
- Markert et al. (1973) Markert T. H., Canizares C. R., Clark G. W., Lewin W. H. G., Schnopper H. W., Sprott G. F., 1973, ApJ, 184, L67
- Markoff et al. (2005) Markoff S., Nowak M. A., Wilms J., 2005, ApJ, 635, 1203
- Merloni et al. (2000) Merloni A., Di Matteo T., Fabian A. C., 2000, MNRAS, 318, 15
- Miller et al. (2008) Miller J. M., Reynolds C. S., Fabian A. C., Cackett E. M., Miniutti G., Raymond J., Steeghs D., Reis R., Homan J., 2008, ApJ, 679, 113
- Moorwood et al. (1998) Moorwood A., et al., 1998, Messenger, 94, 7
- Motch et al. (1982) Motch C., Ilovaisky S. A., Chevalier C., 1982, A&A, 109, 1
- O’Brien et al. (2002) O’ Brien K., Horne K., Hynes R. I., Chen W., Haswell C. A., Still M. D., 2002, MNRAS, 334, 426
- Pe’er & Casella (2009) Pe’er A., Casella P., 2009, ApJ, 699, 1919
- Russell et al. (2006) Russell D., Fender R., Hynes R., Brocksopp C., Homan J., Jonker P., Buxton M., 2006, MNRAS, 371, 1334
- Russell et al. (2007) Russell D., Fender R., Jonker P., 2007, MNRAS, 379, 1108
- Russell et al. (2007) Russell D., Maccarone T., Körding E., Homan J., 2007, MNRAS, 379, 1401
- Schödel et al. (2007) Schödel R., Krips M., Markoff S., Neri R., Eckart A., 2007, A&A, 463, 551
- Spruit & Kanbach (2002) Spruit H. C., Kanbach G., 2002, A&A, 391, 225
- Stirling et al. (2001) Stirling A. M., Spencer R. E., de la Force C. J., Garrett M. A., Fender R. P., Ogley R. N., 2001, MNRAS, 327, 1273
- Takahashi et al. (1996) Takahashi T., Tashiro M., Madejski G., Kubo H., Kamae T., Kataoka J., Kii T., Makino F., Makishima K., Yamasaki N., 1996, ApJL, 470, L89
- Vadawale et al. (2003) Vadawale S., Rao A., Naik S., Yadav J., Ishwara-Chandra C., Pramesh Rao A., Pooley G., 2003, ApJ, 597, 1023
- Ziolkowski (2005) Ziolkowski J., 2005, MNRAS, 358, 851