11email: curdt@mps.mpg.de 22institutetext: School of Earth and Space Sciences, Peking University, China
The SUMER Ly line profile in quiescent prominences
Abstract
Aims. Out of a novel observing technique, we publish for the first time, SoHO-SUMER observations of the true spectral line profile of hydrogen Lyman- in quiescent prominences. With SoHO not being in Earth orbit, our high-quality data set is free from geocoronal absorption. We study the line profile and compare it with earlier observations of the higher Lyman lines and recent model predictions.
Methods. We applied the reduced-aperture observing mode to two prominence targets and started a statistical analysis of the line profiles in both data sets. In particular, we investigated the shape of the profile, the radiance distribution and the line shape–to–radiance interrelation. We also compare Ly data to co-temporal 1206 Si iii data.
Results. We find that the average profile of Ly has a blue-peak dominance and is more reversed, if the line-of-sight is perpendicular to the field lines. The contrast of Ly prominence emission rasters is very low and the radiance distribution differs from the log-normal distribution of the disk. Features seen in the Si iii line are not always co-spatial with Ly emission.
Conclusions. Our empirical results support recent multi-thread models, which predict that asymmetries and depths of the self-reversal depend on the orientation of the prominence axis relative to the line-of-sight.
Key Words.:
Sun: UV radiation – Sun: filaments, prominences – Line: formation – Line: profile – Opacity1 Introduction
Prominences protruding out of the perfect sphere of the visible solar disk are even visible with the naked eye, when the bright disk is occulted. These enigmatic features, which apparently withstand gravity, have attracted scientists since centuries, but despite of substantial progress, which has been made during the last decades in understanding the physics of prominences, important aspects are still not understood. The enormous efforts to understand the nature of prominences is reflected in a wealth of literature. We refer to review articles and reference material, which may be relevant to our work (e.g., Tandberg-Hanssen, 1995; Patsourakos & Vial, 2002; Parenti et al., 2005; Wilhelm et al., 2007), and focus on prominence observations of the hydrogen Ly line profile, which reveal information on the physical conditions for the line formation.
Anywhere on the disk, this line is self-reversed (Curdt et al., 2001). The reversal in the profile is, among others, related to the amount of neutral hydrogen in its ground level, which by itself is a complex function of the temperature and density structure of the emitting plasma. In addition, flows of the emitting or the absorbing plasma and magnetic field may modulate the sizes of the red or the blue peak and the symmetry of the profile (Curdt et al., 2008; Tian et al., 2009 a).
Early observations of the Ly line profile in prominences were completed with the LPSP instrument on OSO 8 (Vial, 1982) and the UVSP instrument on SMM (Fontenla et al., 1988). These photoelectric measurements had to be corrected for the geocoronal absorption. They already have shown signatures of asymmetry and a wide parameter range for the depth of the reversal of the profile, features which at that time could not be reproduced by radiative transfer calculations. Later on, the modeling work made it clear that the overall emergent profile highly depends on the physical conditions in the prominence (e.g., Gouttebroze et al., 1993). In particular, the imprint of the incident profile and the role of the Prominence Corona Transition Region (PCTR) were now employed to reproduce observations (e.g., Vial et al., 2007).
Recently, 2D-multithread models were established, which are based on theoretical work of Heinzel & Anzer (2001) and predict – depending on the orientation of the prominence axis relative to the line of sight (LOS) – opposite asymmetries of the Ly and Ly lines (Gunár et al., 2007, 2008) and deeply or less deeply self-reversed profiles (Schmieder et al., 2007). This is the dedicated context and the rationale of our work.
2 Observations
Because of its wavelength range from 660 Å to 1600 Å, its high spectral resolution, and its vantage point outside of the irritating geocorona, which absorbs Ly emission, the SUMER instrument on SOHO (Wilhelm et al., 1995) is ideally suited to provide information about the line profile. Its enormous brightness exceeds however the capabilities of the SUMER detectors and Ly can only be observed in small sections of 50 px on both sides of the detectors beneath a 1:10 attenuating grid. Unfortunately, the attenuation also exerts a modulation onto the line profile, which makes it difficult to interpret such data. Attempts made to observe Ly in quiet Sun locations on the unattenuated bare section of the photocathode had difficulties to calibrate the local gain depression. First results from prominence data acquired in spring 2005 have been reported by Gunár et al. (2006), Vial et al. (2007), and Gunár et al. (2008).
In July 2008, the SUMER team found a new, unconventional method to observe the extremely bright Ly line of neutral hydrogen with partially closed telescope aperture to reduce the incoming photon flux. The obtained genuine Ly profiles in the quiet Sun and coronal hole regions were analysed by Curdt et al. (2008), Tian et al. (2009 a), and Tian et al. (2009 b). Here we present, for the first time, unprecedented Ly observations of two quiescent prominences seen in June 2009 and discuss the results obtained from a detailed analysis of the line profiles.
(1) disk,
(2) limb and near disk,
(3) sub-prominence void,
(4) inner prominence boundary,
(5) prominence core,
(6) outer prominence boundary.
(1) inner prominence core
(2) prominence interconnection
(3) sub-prominence void
(4) prominence interconnection
(5) outer prominence core
(6) outer prominence boundary.
The new method to reduce the incoming photon flux to a moderate level, appropriate for Ly, was described in earlier work (Curdt et al., 2008; Tian et al., 2009 a, 2009 b). A standard procedure to partially close the door led to a reproducible reduction to a 20 % level. In June 2009, this method was applied for the first time to prominence observations.
On June 9 and 15, 2009, we completed raster scans of approximately 22′′ 120′′ at positions near the solar limb with mid-size prominences. Two spectral windows were transmitted, 100 pixels (px) around Ly recorded on the bare photocathode of the detector, and 50 px around 1206 Si iii recorded on the KBr-coated section of the photocathode, respectively. All observations were completed with the 0.3′′ 120′′ slit. With an exposure time of 14.5 s, both lines were observed with sufficient counts for a good line profile analysis. For both data sets three exposures at each position were completed before the raster was continued with a very small increment of 0.375′′. From a first inspection, we found no indication for temporal variations of the object during the observing time of 45 minutes. In our statistical analysis we keep the temporal information and assume that the sub-resolution increment of 0.375′′ (= 3/8′′) is equivalent to three hypothetical increments of 1/8′′.
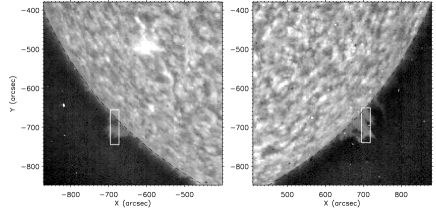
The exact knowledge of the limb position and the limb distance for each pixel is very important for prominence observations. Therefore we used additional information, for an independent assessment of the instrument pointing uncertainty, provided by the hardware encoders in the instrument’s housekeeping channel. Thus, we confirmed that the azimuth movement was as expected and that the actual east-west pointing was very close to its nominal value. Similarly, we confirmed that in elevation the absolute positions for both rasters differ by the nominal value of 5′′. Since in the June 9 data set the position of the limb can be determined, we can estimate that the overall pointing uncertainty is in the order of 2′′ to 3′′. The prominences as seen in the EIT 304 channel are shown in Fig. 1, white rectangles marking the area covered by the SUMER rasters.
Both data sets were processed with standard procedures of the SUMER-soft library. We used the dedicated flatfield exposure of April 19, 2009 to complete the flatfield correction.
3 Prominences in Ly and in Si iii
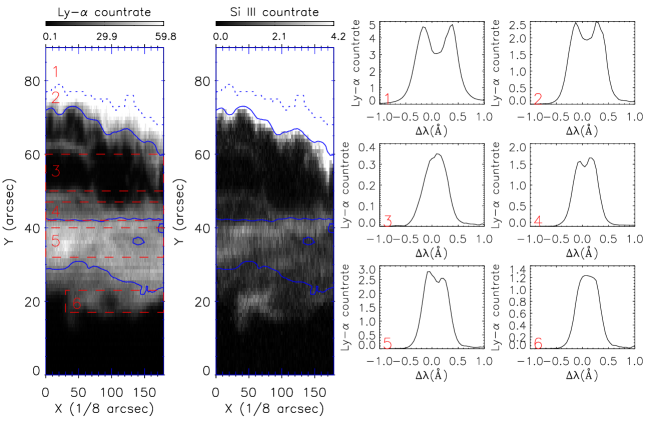
The rasters for both days are shown in Fig. 2 and Fig. 3. Note, that the x-axis also contains time information (cf., prev. section) and that both axes are at a different scale, and that the x-dimension is stretched. The contours delineate the top 15 % (dashed) and the top 40 % (solid) of the pixels in the Ly brightness histogram. These contours have been transferred to the Si iii raster,
In Fig. 2 (observation on June 15) we distinguish six different segments of the raster,
separated by the blue contours or red boxes:
(1) disk,
(2) limb and near disk,
(3) sub-prominence void,
(4) inner prominence boundary,
(5) prominence core,
(6) outer prominence boundary.
We also display the averaged profiles of the designated areas. It is obvious that the disk profiles are much wider and more reversed than the prominence profiles. The disk profiles are almost symmetric, which is consistent with the downflow argument in Curdt et al. (2008) for this special geometry. Interestingly, a clear blue-peak dominance is observed in the profile of the prominence core.
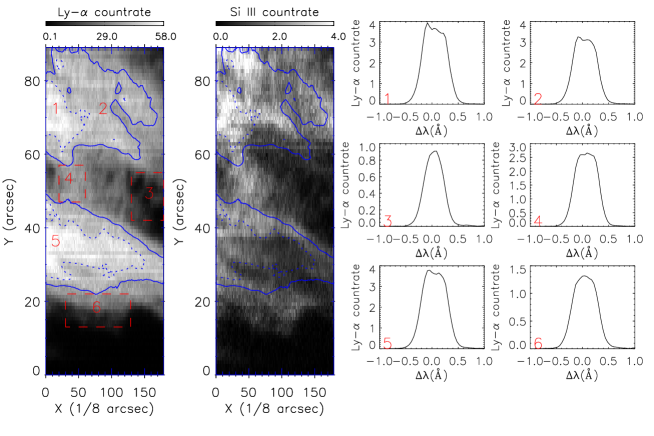
In Fig. 3 (observation on June 9) we distinguish:
(1) inner prominence core
(2) prominence interconnection
(3) sub-prominence void
(4) prominence interconnection
(5) outer prominence core
(6) outer prominence boundary.
Here, we observe just outside the limb. The contrast is even lower in this prominence, which is shown with the same dynamic range. The profiles are almost flat-topped, significant reversals are not seen anywhere. The blue-peak dominance is also present in both parts of this prominence, but less evident.
The prominence is also seen in Si iii. Again, the Ly radiance contours have been transferred. These contours show, that there are considerable differences in the Si iii spectroheliogram; structures are not co-spatial; the prominence appears more granulated and not as diffuse as in Ly. The formation temperature of Si iii is 70 000 K, much higher than typical prominence temperatures of 6 000 K to 8 000 K. Si iii is a typical transition region line. Since its wavelength is well above 912 Å, the Lyman limit, opacity effects by hydrogen can be ruled out. The prominence is basically transparent (Anzer et al., 2007). These authors also show that the C i recombination continuum below 1239 Å is negligible and, consequently, the PCTR of each unresolved thread would contribute to the Si iii emission and one would expect an appearance similar to the cold body. The differences in appearance may be an indication for the coexistence of hot and cold plasma with different opacities. Recent observations by Hinode-SOT (Berger et al., 2008) assume buoyant bubbles of hotter plasma in quiescent prominences, although on smaller scales. Such a scenario would also be compatible with our observation. Without Hinode-SOT co-observations, however, our results remain inconclusive.
We sorted the pixels of all disk locations and of all prominence locations by the total line radiance and defined six equally spaced radiance bins. The profiles for these bins are displayed in Figs. 4 and 5. There are striking differences of prominence profiles compared to disk profiles. In the prominence, the contrast is much lower, reduced by a factor of 4 to 5. The blue-peak dominance is observed in all radiance bins from the brightest areas of the prominence core.


The central reversals of the Ly profiles in both prominences differ, the profiles obtained on Jun 15 were more reversed than those from Jun 9. This may be related to the different orientation of the prominence axes as derived from EIT 304 (cf., Figs. 2 and 3) and Kanzelhöhe H- images. On Jun 15, the threads were rather perpendicular to the line-of-sight, while more edge-on (LOS parallel to the field lines) on Jun 9. Such an explanation would be consistent with the model calculations and predictions of Heinzel et al. (2005). Observational evidence for such a scenario based on spectra of the higher Lyman lines, Ly2 to Ly7, has been reported by Schmieder et al. (2007).
4 Radiance histograms
We already noted the low contrast of the prominences in Ly. In Fig. 6 we show radiance histograms of the prominence core and of the on-disk locations in Fig. 2. For comparison we add as dotted line the log-normal radiance distribution of Ly in the quiet Sun as presented in earlier work (Curdt et al., 2008). Note that the disk histogram, having a different bin size, was scaled for better comparison. Although the small number of prominence pixels only allows a noisy distribution, the differences are, as expected, very obvious. The histogram is per definition clipped at the dim side because of the area selection criterion. The main difference is certainly found in the high-radiance part; the prominence histogram completely lacks brighter pixels, which makes it a very narrow distribution. The uniform emergent emission translates, according to the Barbier-Eddington relation, to a uniform source function at an optical depth, , of unity and is indicative of homogeneous populations of the 1s and 2p levels, and thus rather homogeneous thermodynamic conditions.
In Fig. 7 we show the radiance distribution of the prominence in Fig. 3 in Ly and in Si iii emission. This data set has more prominence pixels and allows to also include fainter pixels here. We defined an empirically determined discrimination level to separate prominence emission from coronal background and defined the lower-15 % radiance category as coronal background, which does not belong to the prominence. The Ly histogram has a sharp upper limit and, in contrast to the disk histogram, a low-radiance wing. The Si iii histogram of this prominence differs significantly, as one could expect, from both the quiet Sun state (dotted line) and from its Ly counter part.
We conclude, that the radiance distributions of both prominences are, as a consequence of dissimilar physical conditions, remarkably different from the log-normal distribution of the average quiet Sun (Fontenla et al., 1988; Curdt et al., 2008).


5 Summary and conclusion
We have presented the first SUMER observations of prominences in the light of the hydrogen Ly line at 1216 Å with reduced incoming photon flux to avoid saturation effects of the SUMER detection system. We have completed a statistical analysis and report salient empirical results derived thereof. As such, we found clear evidence in support of models, which predict an effect of the orientation of the magnetic field relative to the line of sight on the asymmetry of the Ly profile. The Lyman lines are more reversed if the line of sight is across the prominence axis as compared to the case when it is aligned along its axis. Given the great variability in the appearance of prominences and the wide range of physical parameters, the observation of two prominences is by far not enough to cover all the issues. We felt, however, that our results constitute a piece of information important enough to be presented here. More joint observations of prominences and modeling of their Ly line profile are highly desirable.
Acknowledgements.
The SUMER project is financially supported by DLR, CNES, NASA, and the ESA PRODEX Programme (Swiss contribution). SUMER is part of SOHO of ESA and NASA. HT is supported by the International Max Planck Research School for his stay at MPS. This non-routine observation was performed with the help of D. Germerott. This paper greatly benefited from very constructive comments of the referee.References
- Anzer et al. (2007) Anzer, U., Heinzel, P., Fárník, F. 2007, Sol.Phys. 242, 42.
- Delaboudinière et al. (1995) Delaboudinière, J.-P., Artzner, G.E., Brunaud, J., et al., 1995, Sol.Phys. 162, 291.
- Curdt et al. (2001) Curdt, W., Brekke, P., Feldman, U., Wilhelm, K., Dwivedi, B.N., Schühle, U., & Lemaire, P. 2001, A&A 375, 591.
- Curdt et al. (2008) Curdt, W., Tian, H., Teriaca, L., Schühle, U. & Lemaire, P. 2008 A&A 492, L9.
- Berger et al. (2008) Berger, T.E., Shine, R.A., Slater, G.L. et al. 2008, ApJ 676, L89.
- Fontenla et al. (1988) Fontenla, J. M, Reichmann, E. J, & Tandberg-Hanssen, E. 1988, ApJ 329, 464.
- Gunár et al. (2008) Gunár S., Heinzel, P., Anzer, U., & Schmieder, B. 2008, A&A 490, 307.
- Gunár et al. (2007) Gunár S., Heinzel, P., Schmieder B., Schwartz, P., & Anzer, U., 2007, A&A 472, 929.
- Gunár et al. (2006) Gunár S., Teriaca, L., Heinzel, P., & Schühle, U. 2006, in Proc.’SOHO-17. 10 Years of SOHO and Beyond’, eds. H. Lacoste and L. Ouwehand, Giardini Naxos, Italy, ESA SP-617,63.
- Gouttebroze et al. (1993) Gouttebroze, Heinzel, P., & Vial, J.-C. 1993, A&AS, 99, 513.
- Heinzel et al. (1987) Heinzel et al. 1987, A&A 183, 351.
- Heinzel & Anzer (2001) Heinzel, P. & Anzer, U. 2001, A&A 375, 1082.
- Heinzel et al. (2005) Heinzel, P., Anzer, U., & Gunár S. 2005, A&A 442, 331.
- Schmieder et al. (2007) Schmieder, B., Gunár, S., Heinzel, P., & Anzer, U., Sol.Phys. 241,53.
- Parenti et al. (2005) Parenti, S., Vial, J.-C.,& Lemaire, P. 2005, A&A 443, 679.
- Patsourakos & Vial (2002) Patsourakos, S. & Vial. J.-C. 2002, Sol.Phys. 208, 253.
- Tandberg-Hanssen (1995) Tandberg-Hanssen, E. 1995, The Nature of Solar Prominences Astrophys. Space Sci. Lib. 199, (Kluwer, Dordrecht).
- Tian et al. (2009 a) Tian, H., Curdt, W., Marsch, E., & Schühle, U. 2009 a, A&A 504, 239.
- Tian et al. (2009 b) Tian, H., Teriaca, L., Curdt, W., & Vial, J.-C. 2009 b, ApJ 703, L152.
- Vial (1982) Vial, J.-C., 1982, ApJ, 253,330.
- Vial et al. (2007) Vial, J.-C., Ebadi, H., & Ajabshirizadeh, A. 2007, Sol.Phys. 246, 327.
- Wilhelm et al. (1995) Wilhelm, K., Curdt, W., Marsch, E., et al., 1995, Sol. Phys. 162, 189.
- Wilhelm et al. (2007) Wilhelm, K., Marsch, E., Dwivedi, B.N., & Feldman, U. 2007, SSRv 133, 103.