The electron-phonon theory of superconductors: vertex correction
Abstract
The strong coupling Eliashberg theory plus vertex correction is used to calculate the maps of transition temperature (Tc) in parameter-space characterizing superconductivity. Based on these Tc maps, complex crossovers are found when electron-phonon interaction increases from weak-coupling region to strong coupling region. Especially, the interplay interaction between vertex correction and Coulomb interaction reduces the higher Tc predicted in standard Eliashberg theory to the lower Tc observed in experiments. The doping-dependent Tc of cuprate superconductors can be explained as the effect of vertex correction in standard Eliashberg theory and, most importantly, the pseudo-gap can be explained as the effect of vertex correction. Our results are also indicated that the non-adiabatic effect is the barrier for the realizations of high Tc in compounds with compositions of light atoms and with high phonon frequencies.
pacs:
74.20.Fg, 74.25.Dw, 74.62.-c, 71.38.-kI Introduction
In the situation of very strong electron-phonon coupling, non-adiabatic effects of electron-ion system will be so important that the electrons are dressed heavily by lattice vibrations and the conventional strong-coupling theoryEliashberg1 ; Nambu1 ; Scalapino1 ; Allen1 ; McMillan1 need be generalized to include the non-adiabatic effects or the vertex corrects beyond Migdal’s theorem. The strong-coupling theory including vertex correction has been widely studied by using perturbation theory Kostur1 ; Grimaldi1 ; Mierzejewski1 ; Cappelluti1 ; Fan1 and shown the existences of crossovers when electron-phonon interaction evolving from weak-coupling region to strong coupling region Paci1 ; Capone1 . The problem of electron-phonon interaction had been solved numerically using Quantum Monte Carlo method (QMC) Freericks1 and dynamic mean-field theory (DMFT) Freericks2 ; Hague1 . The crossover behavior was exhibited in the calculation of Holstein-Hubbard model using QMC method Freericks1 . The crossover from electron behavior to polaron behavior with increasing electron-phonon coupling had also emerged from the path-integral calculations in theory of polaron Nasu1 , which had been used to explain the superconductivity of copper-oxides high-temperature superconductors by forming pairs of polarons Alexandrov1 ; Alexandrov2 ; Nasu1 .
The standard strong-coupling theory has no bound on Tc. Recently, the Eliashberg functions extracted from the measurements of optical spectroscopy for the iron based superconductor Ba0.55K0.45Fe2As2 Yang1 and the measurements of infrared optical conductivity for copper-oxides superconductors Heumen1 predicted very strong electron-phonon interaction and very high Tc over the experimental values Heumen1 . Additionally, the new found rich-hydrogen superconductor silane (SiH4) Eremets1 is the realization of the predicted high-temperature superconductor of metal hydrogen by pre-compressed mechanism Ashcroft1 . However, the Tc of silane is far lower than the predictions of standard string-coupling theory Chen_Wang . What is the underlying reason of so high Tc in the predictions of the standard strong-coupling theory?.
In this paper, the Tc maps including the influences of vertex corrections are studied. Complex crossover are found on these Tc maps when the parameter of electron-phonon coupling increases from weak-coupling region to strong-coupling region. These crossovers are very close to the well known =2 at which the value of Tc reaches its maximum McMillan1 . We also find that Tc does not monotonously increase with phonon frequency . Tc decreases with when higher than a threshold value. This means that high phonon-frequency is unfavorable to superconductivity if vertex correction is strong. In section V, we will show that the vertex correction will significantly suppress the predicted Tc for Ba0.55K0.45Fe2As2 Yang1 , the copper-oxides superconductors Heumen1 and superconducting silane Eremets1 . In section IV main numerical results will be presented. The basic theory used in this paper will be introduced in section II.
II Theoretical formulas
The equation of energy gap in reference Kostur1 had been generalized by including the Coulomb interaction Fan1 . The electron-phonon interaction in Nambu’s scheme is expressed as
| (1) |
where the index of phonon mode will be omitted if we only consider a single phonon mode. We employ the isotropic approximation and the coupling constant of electron-phonon interaction is written as . The calculations of vertex corrections are greatly simplified under isotropic approximation because the electron-phonon interactions are included in the vertex corrections only by the functions of electron-phonon interaction defined as . The energy-gap equation is expressed as
| (2) | |||||
with the renormalized function , the energy-gap function and the parameters , , and . The three parameters of vertex correction , and can be found in Ref.Fan1 . The Coulomb pseudo-potential is defined as , where , U the Coulomb interaction between electrons and characteristic energy of typical phonon correlated to superconductivity.
If considering that when temperature is very close to Tc, the terms proportional to are ignored. The energy-gap equation is simplified to . The kernel matrix is expressed as
| (3) | |||||
If the vertex corrections are ignored, three parameters , and are all equal to zero and the kernel Eq.(3) of energy-gap equation reduces to the general form without vertex correction Allen1 after some symmetrizations and simplifications. In the calculation of , 1 is the value of normal state. It’s convenient that the matrix is symmetrized as in Ref.Allen1 . The Tc is defined as the temperature when the maximum of eigenvalues Emax of kernel matrix crosses zero and changes its sign. About =200 Matsubara’s energies are used to solve above equation. Only 20-30 iterations are enough to search Tc from -600 K to 600 K with accuracy 0.0001 K by using the bisection method.
In calculations of , the function is approximately a constant around the peak of phonon mode and the density of state of phonon is expressed as
| (6) |
where is the energy of phonon mode, the half-width of peak of phonon mode and . The parameter of electron-phonon interaction is defined as
| (7) |
The well known value given by McMillan measures the instability of superconductivity induced by lattice instability and plays very important role in this paper.
Experimental phonon spectrum and the phonon spectrum from linear-response calculation Savrasov1 are multi-peak structures with broad energy distributions. To make the approximation of single peak model to be more reliable approximation, the effective phonon frequency or energy should be used. A good choice is the defined in Ref. Allen1 . The is calculated from Eliashberg function that can be obtained from linear-response theory or extracted from the experimental measurements of phonon properties.
III Small parameter for perturbing calculation
It’s important to known the small parameter for perturbing calculations in the theory of electron-phonon interaction. The matrix element of electron-phonon interaction is given by (). The forms of are dependent on the kinds of electron-phonon: deformation potential or polar coupling Mahan1 . Under isotropic approximation, the expression of electron-phonon coupling constant is given by
| (8) |
if the well-known relation and the Einstein spectrum of phonon are used, where is phonon energy, is density of state at Fermi energy, is the averages of Fermi surface and is the average weighted by . The Eliashberg function with Einstein spectrum is expressed as . The small parameter for perturbing calculation is
| (9) |
where dimensionless parameter . The standard strong-coupling theory is correct only ( Migdal’s theorem ). We can see that is equivalent to . The small parameters 0.3 and for the fullerides such as Rb3C60 are estimated by using Eq.(9) with the parameters 8 (states/eV), 0.5 eV, 0.5-1.0 and 65-100 meV. Thus strong-coupling theory plus vertex correct is suitable for fullerides.
As a comparison, the effective interaction of electrons in BCS theory Bardeen1 can be written as
| (10) |
Under isotropic approximation, by using , , and Eq.(8), the above equation can be simplified as
| (11) |
where . The small parameter for BCS theory is
| (12) |
The perturbation theory is correct only or , however to keep superconducting state stable. If , the strongly coupling electron-pairs will significantly modify the electronic structure of superconductors and lead to structural instability.
IV The general results of vertex corrections
The three-dimensional Tc maps had been calculated in the previous paper Fan1 . In this section, three-dimensional Tc maps in -- phase space including vertex corrections are calculated by using the simple phonon spectrum with the form of Eq.(6). From electron point of view, the vertex correction or non-adiabatic effect can be controlled by the effective width EB, on the other hand, from ion point of view, it can be controlled by the cutoff of phonon energy . In this work, the vertex corrections are controlled by the effective band-width EB with the range from 0.5 eV to 5 eV. The situation E is equivalent to no vertex correction.
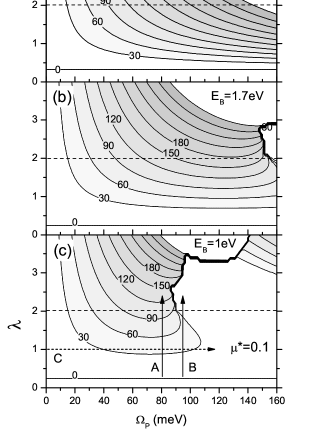
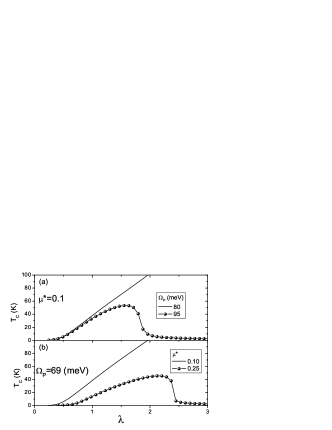
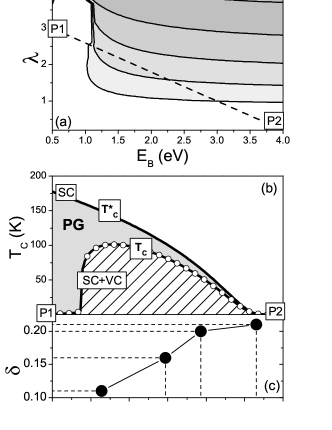
The Fig.1(a,b,c) illustrate the evolution of Tc map with decreasing EB. The Fig.1(a) is the Tc map having been obtained in the previous work without considering vertex corrections Fan1 . The large deformation with strong vertex correction starts at EB=1.7 eV in Fig.1(b) near the well known =2.0 and high phonon energy. With EB decreasing to 1 eV further, the region with strong vertex correction rapidly expands and occupies large part of parameter space with 80 meV in Fig.1(c). In the region with 80 meV, the Tc is strongly suppressed however there are no discontinuous changes of Tc or breaking of contour lines. An important result from the Fig.1 is that Tc does not change with monotonously if phonon energy is high enough. The Fig.2(a) shows the changes of Tc with along two arrows (A,B) shown in Fig.1(c). If =80 meV, the Tc monotonously increases with . However for =90 meV, the Tc first increases with , reaches the maximum at and then quickly decreases with increasing . Further increasing 2, Tc will be very low due to strong vertex corrections. The non-monotonous -dependent Tc in Fig.2(a) had been found in the non-adiabatic theory of superconductivity Paci1 . Some crossover behaviors from weak coupling to strong coupling region had been predicted in Holstein-Hubbard model solved numerically by quantum Monte Carlo method Freericks1 and in polaron theory Nasu1 . It’s very reasonable that the non-monotonous -dependent Tc is equivalent to the crossovers found in QMC calculation Freericks1 and polaron theory Nasu1 . So only the leading vertex correction can describe qualitatively very well the electron-phonon interaction in strong coupling region.
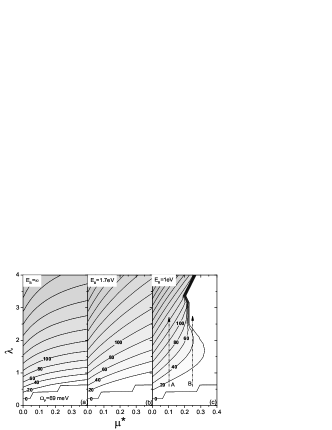
In the previous paper, the Coulomb pseudo-potential had small effects when 0.2 in the calculations without vertex corrections Fan1 . The Fig.3(a) is the normal Tc map on - plane without vertex correction Fan1 . The figure shows that when 0.2, Tc is insensitive to the change of . The breaking contour line with Tc=0 K are because of the inaccurate calculations when Tc0.1 K if only =200 Matsubara energies are used. The contour lines with Tc0.1 K is accurate enough. If the Coulomb pseudo-potential and vertex correction work together, the situation will change drastically and some new interesting results will appear. The large deformations are found in Fig.3(c) if EB decreases to 1.0 eV. In the region with 2.0, the contour lines with higher Tc are moved out but the contour lines with lower Tc fill in this region. As expected, the large deformations and discontinuous changes of contour lines appear on the Tc map when 0.20. The contour lines with iso-values from Tc=20 K to 200 K are packed together within the region 0.200.25 and 2. The figure clearly shows that if the Coulomb pseudo-potential is larger enough, the Tc will change with non-monotonously. The changes of Tc along two arrows with =0.1 and 0.25 are plotted in Fig.2(b). For =0.25, Tc first increases with until reaches the maximum at =2.2 and then sharply decreases to smaller value at =2.5. The crossover behavior is enhanced by strong Coulomb interaction.
There are three methods that can control vertex correction: (1) only changes and EB keeps unchanged, (2) changes and keeps unchanged , (3) both and change. It’s possible that three methods provide qualitatively different results. In this paper, we use narrow peak approximation so that . The Tc map on - plane is plotted in Fig.4(b). The Fig.4(a) shows how Tc changes with along the direction of arrow in Fig.4(b) with EB=1 eV. It’s found that at first Tc increases with and then decreases with it. The arrow in Fig.4(b) is corresponding to the horizontal arrow in Fig.1(c). The behavior of Tc with had been found in a series of references Grimaldi1 ; Cappelluti1 ; Paci1 in that coupling constant of electron-phonon interaction ( or in this paper) is dependent on a cutoff for wave-vector . From Fig.1(c) and Fig.4(b), the increasing Tc at small isn’t the effect of vertex correction and is the standard result of strong-coupling theory. The real effects of vertex corrections are that Tc decreases with at large . Certainly, the vertex correction is enhanced if increases by decreasing EB with fixed , illustrated by the horizontal arrow in Fig.4(b).
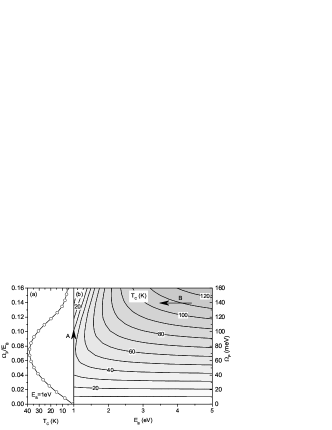
Finally, Tc map on EB- plane is presented in Fig.5 with =72 meV. If EB increases but keeps unchanged, the Tc monotonously increases with EB until to the limit of non-vertex correction. More interestingly, on this map, the Tc is non-monotonous dependent on EB along strait line from to companying by the decrease of from 3.0 to 0.2. The non-monotonous dependence of Tc on effective band-width EB is similar to the band-filling effects of Tc in the non-adiabatic theory of superconductivity Cappelluti1 . Our results show that, if 80 meV, the suppression of TC will be more prominently.
V Discussion
As mentioned in the introduction, the values of Tc obtained from standard strong-coupling theory are generally higher than those measured in experiments. The copper-oxides superconductors Bi2Sr2CaCu2O8+δ and Bi2Sr2Cu2O6+δ studied in Ref Heumen1 have very strong electron-phonon interactions 2.36-2.85 and overestimated Tc in underdoped samples. With increasing doping , the values of decrease to about 0.35-1.42. The effective band-widths EB of conducting electrons for these cuprates are distributed from 1 eV to 3 eV. The effective phonon energies are distributed from 50 meV to 80 meV. The Coulomb interactions are strong in cuprate superconductors =0.25. We can clearly see from Fig.2(b) and Fig.3(c) that in underdoped samples, Tc can be reduced to very small values in strong electron-phonon interaction region (2.5) due to the interplay interaction between vertex correction and strong Coulomb interaction. As shown in Fig.5(b), the values of Tc for all samples are reduced from around 200 K to lower than 150 K and close to experimental values Heumen1 . Our results are provided an explanation to pseudo-gap in underdoped region shown in Fig.5(b). The cooper-pairs pre-form at the mean field value T of transition temperature in standard strong-coupling theory. However strong non-adiabatic effects induce the instability of cooper-pairs and suppress real Tc to lower values. The T degenerates with Tc in overdoped region is similar to the example (1) of Fig.9 in Ref.Norman1 .
For the iron-based superconductors Ba0.55K0.45Fe2As2 studied in Ref.Yang1 , the parameters of boson-phonon interaction decrease from 3.42 to 0.78 with increasing temperature. The contributions of electron-phonon interactions have energies lower than 40 meV in Eliashberg functions . At 28 K close to Tc, the roughly estimated value of contributed by energies lower than 40 meV is about 2.0 close to the values at temperature 86 K. This is too strong to account to experimental Tc=28 K. Because the effective phonon energy is about 20-40 meV, the reduced Tc from the vertex corrections are also small (Fig.1) although the effective band-widths of conducting electrons are small from 1 eV to 2 eV. The key problem is that how we can extract the more accurate value of of electron-phonon interaction from total . If we use the =1.44 obtained at temperature 151 K and the effective phonon energy =20 meV, the obtained Tc=29 K is close to experimental Tc=28 K. The reasonable value for iron-based superconductor is about =1.0. This is indicative that the contribution of electron-phonon interaction to Eliashberg function dominates over other interactions at high temperature.
From Fig.4, we can see that if effective band-width EB is small, the Tc will decrease with increasing phonon frequency if is higher enough. This means that we can not increase Tc infinitely by decreasing mass of atom or increasing phonon frequency. The strong vertex corrections in high phonon-energy region suppress Tc to smaller values than those of predicted by standard strong-coupling theory. This is a reasonable explanation for the lower Tc in the experiment of silane superconductor Eremets1 than that in the strong-coupling theory Chen_Wang .
The superconductivity of fullerides can be described using Cooper-pairs glued by virtual phonon excitation. However there are some very important problems are unsolved Gunnarsson1 . The fullerides have very large number of phonon modes from low frequency to high frequency. What phonon modes are most important to their superconductivity?. There are two groups of phonon modes of fullerides: (a) inter-molecular molecular modes with energies lower than 150cm-1 (or 18 meV) and (b) intra-molecular phonon modes with energies higher than 250 cm-1 (or 31 meV). The inter-molecular modes have small contributions to Tc due to their lower energies and not too strong electron-phonon interaction. Most importantly, our results shown in Fig.1(c) and Fig.4 prove that the ‘tangential’ intra-molecular modes with energy higher than 1000 cm-1 (or 124 meV) have small contributions to Tc because of strong vertex corrections. So the intra-molecular ‘radial’ modes from 250cm-1 to 1000cm-1 of group (b) should contribute main parts of superconductivity. In fact effective phonon frequency is located in this energy range. The empty t1u orbits will form narrow energy bands with width about 500 meV in C60 solid and strongly couple with intra-molecular Hg phonons. In Rb3C60 solid, the width of t1u bands increase to about 1 eV and is half filled with electrons. Based on our calculations using density functional theory with plane-wave pseudo-potential methods, the effective band-width EB is higher than 500 meV and lower than 1 eV. If we choose the intra-molecular radial mode =525 cm-1 (or 65 meV) and the half-width EB=500 meV, Tc will be lower than experimental value due to vertex-correction effects shown in Fig.5(a). If we slightly increase EB and use the averaged value EB=750 meV, both Tc=29.5 K and isotope coefficient Chen1 are close to the values in experiments if =1.04 and =0.1. The required parameter is different from our previous work value 0.66 Fan2 in the calculation without vertex correction, however still close to the reasonable range from 0.5 to 1.0 Gunnarsson1 . The accurate calculations of and are important to understand the role of vertex correction.
VI Conclusion
In summary, the strong-coupling Eliashberg theory including vertex correction is systemically studied in this paper. The Tc maps in parameter-space -- for different EB contain the completed information on strong-coupling theory and the vertex corrections. Especially, the combined interaction of vertex correction and Coulomb interaction can significantly depress Tc to small value. The non-monotonous changes of Tc with increasing show the crossover behaviors near =2 when evolving from weak-coupling region to strong-coupling region. The crossovers can explain the doping-dependent Tc of cuprate superconductors if the Coulomb interactions are strong. The crossover behavior in -dependent Tc indicates that high-frequency phonon is unfavorable to high Tc. Thus the strong non-adiabatic effect makes it hard to find high Tc superconductors in compounds containing light elements. Finally the Tc maps in the previous paper Fan1 and the maps with vertex corrections in this paper provide very comprehensive understanding of superconductivity of superconductors.
VII Acknowledgement
The author thanks Prof. E. Cappelluti for very helpful discussions. This work is supported by Director Grants of Hefei Institutes of Physical Sciences, Knowledge Innovation Program of Chinese Academy of Sciences and National Science Foundation of China.
References
- (1) G. M. Éliashberg, Soviet. Phys. JETP. 11, 696 (1960).
- (2) Y. Nambu, Phys. Rev. 117, 648 (1960).
- (3) D. J. Scalapino, J. R. Schrieffer, and J. W. Wilkins, Phys. Rev. 148, 263 (1966).
- (4) P. B. Allen, and R. C. Dynes, Phys. Rev. B 12, 905 (1975).
- (5) W. L. McMillan, Phys. Rev. 167, 331 (1968).
- (6) V. N. Kostur, and B. Mitrović, Phys. Rev. B 50, 12774 (1994).
- (7) C. Grimaldi, L. Pietronero and S. Strässler, Phys. Rev. B 52, 10530 (1995).
- (8) M. Mierzejewski, J. Zieliński, and P. Entel, Phys. Rev. B 57, 590 (1998).
- (9) E. Cappelluti, S. Ciuchi, C. Grimaldi, and L. Pietronero, Phys. Rev. 68, 174509 (2003).
- (10) W. Fan, Physica C 469, 177 (2009).
- (11) P. Paci, E. Cappelluti, C. Grimaldi, and L. Pietronero, Phys. Rev. B 65, 012512 (2001).
- (12) M. Capone, S. Ciuchi, and C. Grimaldi, Europhys. Lett. 42, 523 (1998).
- (13) J. K. Freericks, M. Jarrell, and D. J. Scalapino, Phys. Rev. B 48, 6302 (1993).
- (14) J. K. Freericks, V. Zlatić, W. Chung, and M. Jarrell, Phys. Rev. B 58, 11613 (1998).
- (15) J. P. Hague, and N. d’Ambrumenil, J. Low. Temp. Phys. 151, 1149 (2008).
- (16) K. Nasu, Phys. Rev. B 42, 6076 (1990).
- (17) A. Alexandrov, and J. Ranninger, Phys. Rev. B 24, 1164 (1981).
- (18) A. Alexandrov, and N. T. Mott, Rep. Prog. Phys. 57, 1197 (1994).
- (19) J. Yang, D. Hüvonen, U. Nagel, T. Rõõm, N. Ni, P. C. Canfield, S. L. Bud’ko, J. P. Carbotte, and T. Timusk, Phys. Rev. Lett. 102, 187003 (2009).
- (20) E. van Heumen, E. Muhlethaler, A. B. Kuzmenko, H. Eisaki, W. Meevasana, M. Greven, and D. van der Marel, Phys. Rev. B 79, 184512 (2009).
- (21) M. I. Eremets, I. A. Trojan, S. A. Medvedev, J. S. Tse, and Y. Yao, Science 319, 1506 (2008).
- (22) N. W. Ashcroft, Phys. Rev. Lett. 92, 187002 (2004).
- (23) X. J. Chen, J. L. Wang, V. V. Struzhkin, H. K. Mao, R. J. Hemley, and H. Q. Lin, Phys. Rev. Lett. 101, 077002 (2008).
- (24) S. Y. Savrasov, and D. Y. Savrasov, Phys. Rev. B 54, 16487 (1996).
- (25) G. D. Mahan, Many-Particle Physics, (Plenum Press, New York 1981). The introduction of electron-phonon interactions is in the Chapter 1.
- (26) J. Bardeen, L. N. Cooper, and J. R. Schrieffer, Phys. Rev. 108, 1175 (1957).
- (27) M. R. Norman, D. Pines, and C. Kallin, Advances in Physics 54 715 (2005).
- (28) O. Gunnarsson, Rev. Mod. Phys. 69, 575 (1997).
- (29) C. C. Chen and C. M. Lieber, Science 259, 655 (1993).
- (30) W. Fan, to appear in International Journal of Modern Physics B; preprint arXiv:0811.3813 (2008).