Structure and Correlation Effects in Semiconducting SrTiO3
Abstract
We have investigated the effects of structure change and electron correlation on SrTiO3 single crystals using angle-resolved photoemission spectroscopy. We show that the cubic to tetragonal phase transition at 105∘K is manifested by a charge transfer from in-plane ( and ) bands to out-of-plane () band, which is opposite to the theoretical predictions. Along this second-order phase transition, we find a smooth evolution of the quasiparticle strength and effective masses. The in-plane band exhibits a peak-dip-hump lineshape, indicating a high degree of correlation on a relatively large (170 meV) energy scale, which is attributed to the polaron formation.
pacs:
71.20.-b, 79.60.-i, 77.80.B-Among complex oxides, SrTiO3 (STO) is one of the most widely studied examples. Complex oxides present a wide spectrum of interesting phenomena such as high temperature superconductivity, colossal magnetoresistance, ferroelectricity, and multiferroicity. Since many of the interesting oxides have perovskite structure, STO (a typical cubic perovskite) has been widely used for integration with other oxides into novel heterostructures. Those heterostructures show intriguing phenomena such as superconductivity caviglia2008 ; reyren2007 ; kozuka2009 , high-mobility electron gas ohtomo2004 , thermoelectricity ohta2007 ; wunderlich2008 , and interface magnetism brinkman2007 . Furthermore, STO itself has shown interesting properties such as superconductivity ueno2008 , blue-light emission kan2005 , photovoltaic effect zhou2009 , and water photolysis konta2004 . Such functionalities would be improved through the better understanding of the electronic structure of STO.
STO is a band insulator, which experiences a second-order phase transition from cubic to tetragonal structure at the critical temperature of about 105∘K wang1973 . Below , neighboring octahedral TiO6 units start to rotate oppositely about the axis eventually reaching an angle of 2∘ as . The increasing tetragonality smoothly changes some physical properties, such as dielectric constant muller1979 and birefringence courtens1972 . Mattheiss predicted the presence of three doubly-degenerate Ti 3 bands, i.e. three orthogonal ellipsoids centered at the zone center (0,0) mattheiss1972a . During the structural change below , it is predicted that the degenerate conduction band minimum splits into two; the in-plane ( and ) bands at lower energy and the out-of-plane () band at higher energy mattheiss1972b . Both in-plane and out-of-plane bands are to be occupied for carrier density 1019 cm-3.
While earlier transport gregory1979 ; uwe1985 and angle-resolved photoemission spectroscopy (ARPES) aiura2002 ; takizawa2009 ; haruyama1996 ; ishida2008 measurements provided some information, important details such as the Fermi surface size and band offsets are in disagreement with theory mattheiss1972a ; mattheiss1972b and furthermore the effects of the structural change and electron correlation on the band structure have not been determined. In this Letter, we report on the temperature-dependent change of the electronic structure of STO single crystals. We observed that the Fermi surface of STO consists of three degenerate ellipsoids (i.e. , , and ) above . As the temperature decreases below , we found that the band has lower minimum energy by 25 meV than the doubly degenerate and bands, which is in the opposite direction to the theoretical predictions. The conduction band minimum gradually shifts in energy as the STO experiences the second-order structural phase transition. In addition, the energy dispersion curves near point display a peak-dip-hump lineshape, where the hump states can be attributed to a polaron formation.
STO single crystals with an atomically flat (001) surface of TiO2 termination were prepared by chemical etching followed by thermal annealing chang2009 . To introduce negative carriers into the samples, we annealed them in ultrahigh vacuum (UHV) ( 1 10-9 Torr) at 1000∘C for 30 min, upon which oxygen vacancies are are introduced with electron donation takizawa2009 . We are then able to examine the conduction band minimum structure over an energy range of 50 meV. The carrier concentration was estimated to be cm-3 from the size of Fermi surface area (see below). ARPES was conducted at the Electronic Structure Factory end station at beam line 7 of the Advanced Light Source. The temperature was varied between 150∘K and 20∘K to span the phase transition at . The photon energy and the total energy resolution (photons+electrons) were set to 95 eV and 30 meV, respectively, for all data in the present report.
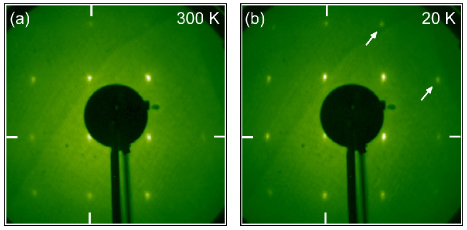
We checked the structural phase transition of the STO sample using low energy electron diffraction (LEED) measurements. Fig. 1 shows two LEED pictures of the STO crystal taken at 300∘K to 20∘K. Over this wide temperature range, the evident diffraction spots imply both sufficient surface quality and a high enough electrical conductivity of the STO crystal for electron diffraction and spectroscopies. At certain electron beam energies, e.g. 235 eV, the two (1,2) or (2,1) spots become evident at 20∘K, as indicated by arrows in Fig. 1(b). This fully reversible rearrangement of the diffraction spot intensity is attributed to the regular in-plane rotations of octahedral TiO6 units in the long range order at low temperature, i.e. cubic-to-tetragonal phase transition wang1973 ; krainyukova2000 .
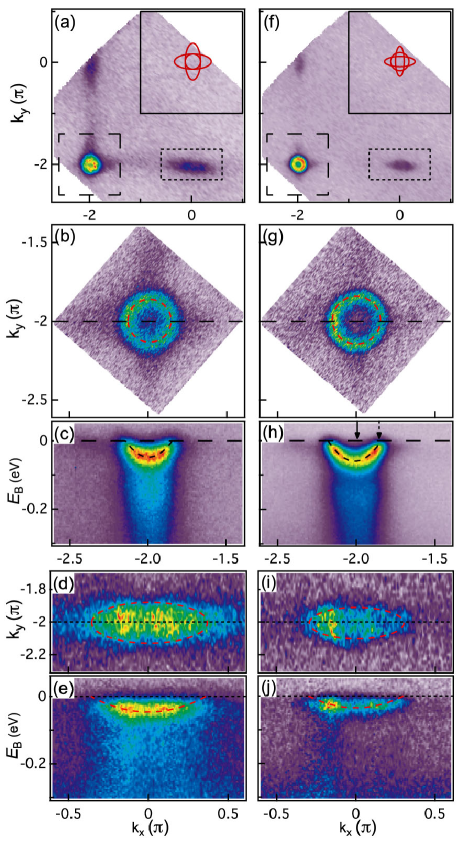
Fig. 2 shows the Fermi surface and band structure maps of the STO collected at 150∘K and 20∘K. In the cubic phase at 150∘K, we find that the Fermi surface has three degenerate bands centered at points and elongated along each principal axis as shown in Fig. 2 (a). The magnified Fermi surfaces in Fig. 2(b,d) present clear shapes of a circle and ellipse concentrated at points aiura2002 . The photoemission matrix element causes the intensity of each band to vary strongly from zone to zone. While no bands are visible at , the elliptic bands are strongest at and while the circular band is strongest at . The complete Fermi surface is constructed from the sum of signals in , , as shown in the inset in Fig. 2(a). The central circular band presents the cross-section of the out-of-plane-oriented ellipsoidal pocket, which oscillates as the photon energy changes (not shown here). The elliptic bands, with an aspect ratio of about 2.4, represent cuts through the in-plane-oriented and ellipsoidal pockets. The elongation of the ellipsoids is much stronger than the findings of the Shubnikov de Haas oscillations gregory1979 ; uwe1985 , but is in agreement with the theoretical band model mattheiss1972b . A similar elongation of the ellipsoidal bands may also be expected for other cubic perobskite compounds, such as KNiF3, KMoO3, KTaO3 mattheiss1972a .
Fig. 2(c,e) show the energy dispersion curves along the horizontal line in the middle of Fig. 2(b,d), respectively. Fig. 2(c) shows the intense circular band with the dim elliptic bands aside, while Fig. 2(e) only shows the intense elliptic band with the same minimum energy, i.e. 46 meV below the Fermi level. By comparing the area of the threefold degenerate ellipsoids compared to the area of a Brillouin Zone the carrier density is estimated to be 0.0085 per Ti atoms, i.e. 1.4 1020 cm-3. The effective mass can be estimated to be / = 1.2 (light electrons) and / = 7.0 (heavy electrons), where is the free electron mass, from the energy distribution curves (red dashed lines) of the circular and elliptic bands in Fig. 2(c,e), respectively.
As temperature decreases across the cubic-to-tetragonal phase transition, Mattheiss predicted the lifting of the degeneracy between , , ellipsoids by a transfer of the charge from to , pockets, corresponding to a shrinking of the former and an expansion of the latter. However, we observed the temperature dependence of the conduction bands in the opposite direction. As shown in Fig. 2(f,i), the elliptic bands shrink significantly at 20∘K. On the other hand, the circular band expands a little, noticeable from the guidelines (red dashed) and a slight increase in binding energy of the band minimum. The energy-dispersion curves clearly show the temperature induced changes, as shown in Fig. 2(h,j). The elliptic bands rise by 14 meV, but the circular band lowers by 11 meV. The total change in energy, 25 meV, is the same magnitude as predicted (20.7 meV), but of opposite sign mattheiss1972b .
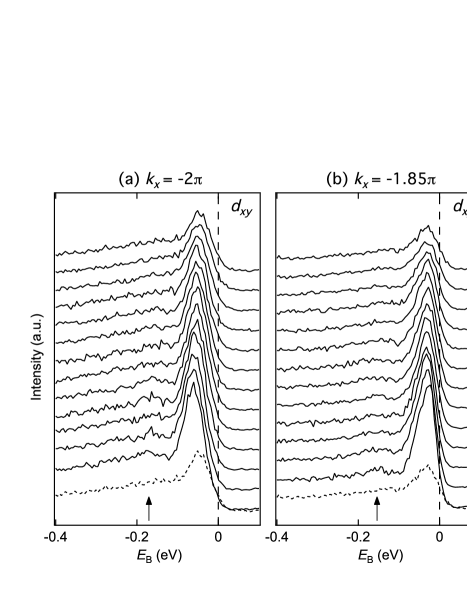
A more detailed understanding of the many-body interactions is obtained by analyzing the energy dispersion curves at = and marked by solid and dashed arrows in Fig. 2(h). As shown in Fig. 3, the energy distribution curves show clear peak-dip-hump structures, which are associated with many-body correlations damascelli2003 . As temperature decreases, the peak-dip-hump structure becomes sharper indicating a substantial change in quasiparticle lifetime. Comparing the spectra at 20∘K and 150∘K in Fig. 3(a), the peak clearly displaces to lower energy at lower temperature. The evolution of the bands demonstrates a continuous change of occupation with temperature. The gradual shift of the peak with temperature confirms as expected, since the angle of tetragonal distortion increases continuously with temperature wang1973 .
As seen in Fig. 2(c,h), we found additional significant electronic (”hump”) states in the energy range near 170 meV. The hump below the three degenerate bands becomes discernible and lowers its energy during cooling. The similar energy lowering of both the band and the hump during cooling implies the interaction between those two states. Since the hump is not visible at the (0, ) or (, 0) points, it is clearly not associated with the or bands. Comparing the energy range and the temperature dependence with a recent optical study vanmechelen2008 , we can attribute the hump states to polaron formation due to the electron-phonon interaction. Similar polaronic bands have been observed in one-dimensional materials perfetti2001 and manganites mannella2005
While the temperature dependence clearly implicates the polaronic origin for the hump states, we cannot rule out an additional contribution from plasmon satellites. The energy values of plasmon, i.e. 60 meV for cm-3 gervais1993 , is similar to the energy separation from the hump to the peak. Further experiments on the doping dependence could rule out the plasmon because it would increase the separation between the peak and hump vonallmen1992 .
The renormalized band structure and these many-body interactions have not been available until the present work. They are important because they are the basis of STO’s interesting properties such as superconductivity and thermoelectricity. In particular, the superconductivity has been treated only in the three-fold degenerate band model, which is clearly not applicable. Furthermore, the nature of the satellite bands, either polaronic or plasmonic, should be understood better by future calculations, as it is critical to establish an electron-phonon or electron-electron pairing mechanisms.
The precise measure of electronic structure is critical to understand the promising thermoelectricity observed in doped STO heterostructures. The thermoelectricity is directly related to the effective mass, which has been measured by different experimental methods frederikse1966 ; gregory1979 ; uwe1985 ; ohta2007 and rarely compared with calculations marques2003 ; wunderlich2008 . Differences between our observed value of effective mass and the calculated values suggests the need for improved electronic structure calculations and further investigation of STO with different doping. In addition, the thermoelectric properties have been previously associated with strong correlation ando1999 . The proposed polaron effects (Fig. 3) suggests that the electron-phonon coupling might play an important role for the thermoelectricity in doped STO.
While the conduction band structure of the -doped STO were previously extracted using the photoemission spectroscopy aiura2002 ; takizawa2009 ; haruyama1996 ; ishida2008 as well as the magneto-transport gregory1979 ; uwe1985 , the precise evaluation of the Fermi surface shape, effective mass, and electron-phonon interaction from ARPES band structure measurements is unique to the present study. The present work is only possible because of the very high energy and momentum resolutions of the experiments that also cover several Brillouin Zones of STO. Future application of ARPES should be valuable to understand other interesting phenomena in STO kan2005 ; kim2009 and STO-based heterostructures kozuka2009 ; ohtomo2004 .
In summary, we identified the band structure of STO, its modification due to polaronic effects and the evolution of these interactions with temperature during the structural phase transitions of electron-doped STO crystals.
The Advanced Light Source is supported by the Director, Office of Science, Office of Basic Energy Sciences, of the US Department of Energy under Contract No. DE-AC03-76SF00098. Y. J. C. and K. H. acknowledge the support by the Max Planck Society.
References
- (1) A. D. Caviglia, S. Gariglio, N. Reyren, D. Jaccard, T. Schneider, M. Gabay, S. Thiel, G. Hammerl, J. Mannhart, and J. M. Triscone, Nature 456, 624 (2008)
- (2) N. Reyren, S. Thiel, A. D. Caviglia, L. F. Kourkoutis, G. Hammerl, C. Richter, C. W. Schneider, T. Kopp, A. S. Ruetschi, D. Jaccard, M. Gabay, D. A. Muller, J. M. Triscone, and J. Mannhart, Science 317, 1196 (2007)
- (3) Y. Kozuka, M. Kim, C. Bell, B. G. Kim, Y. Hikita, and H. Y. Hwang, Nature 462, 487 (2009)
- (4) A. Ohtomo and H. Y. Hwang, Nature 427, 423 (2004)
- (5) H. Ohta, S. Kim, Y. Mune, T. Mizoguchi, K. Nomura, S. Ohta, T. Nomura, Y. Nakanishi, Y. Ikuhara, M. Hirano, H. Hosono, and K. Koumoto, Nature Mater. 6, 129 (2007)
- (6) W. Wunderlich, H. Ohta, and K. Koumoto, arXiv:0808.1772v1.
- (7) A. Brinkman, M. Huijben, M. van Zalk, J. Huijben, U. Zeitler, J. C. Maan, W. G. van der Wiel, G. Rijnders, D. H. A. Blank, and H. Hilgenkamp, Nature Mater. 6, 493 (2007)
- (8) K. Ueno, S. Nakamura, H. Shimotani, A. Ohtomo, N. Kimura, T. Nojima, H. Aoki, Y. Iwasa, and M. Kawasaki, Nature Mater. 7, 855 (2008)
- (9) D. Kan, T. Terashima, R. Kanda, A. Masuno, K. Tanaka, S. Chu, H. Kan, A. Ishizumi, Y. Kanemitsu, Y. Shimakawa, and M. Takano, Nature Mater. 4, 816 (2005)
- (10) N. Zhou, K. Zhao, H. Liu, Z. Lu, H. Zhao, L. Tian, W. Liu, and S. Zhao, J. Appl. Phys. 105, 083110 (2009)
- (11) R. Konta, T. Ishii, H. Kato, and A. Kudo, J. Phys. Chem. B 108, 8992 (2004)
- (12) F. Wang and K. Gupta, Metall. Trans. 4, 2767 (1973)
- (13) K. A. Muller and H. Burkard, Phys. Rev. B 19, 3593 (1979)
- (14) E. Courtens, Phys. Rev. Lett. 29, 1380 (1972)
- (15) L. F. Mattheiss, Phys. Rev. B 6, 4718 (1972)
- (16) L. F. Mattheiss, Phys. Rev. B 6, 4740 (1972)
- (17) B. Gregory, J. Arthur, and G. Seidel, Phys. Rev. B 19, 1039 (1979)
- (18) H. Uwe, R. Yoshizaki, T. Sakudo, A. Izumi, and T. Uzumaki, Jpn. J. Appl. Phys. 24 (suppl. 24-2), 335 (1985)
- (19) Y. Aiura, I. Hase, H. Bando, T. Yasue, T. Saitoh, and D. S. Dessau, Surf. Sci. 515, 61 (2002)
- (20) M. Takizawa, K. Maekawa, H. Wadati, T. Yoshida, A. Fujimori, H. Kumigashira, and M. Oshima, Phys. Rev. B 79, 113103 (2009)
- (21) Y. Haruyama, S. Kodaira, Y. Aiura, H. Bando, Y. Nishihara, T. Maruyama, Y. Sakisaka, and H. Kato, Phys. Rev. B 53, 8032 (1996)
- (22) Y. Ishida, R. Eguchi, M. Matsunami, K. Horiba, M. Taguchi, A. Chainani, Y. Senba, H. Ohashi, H. Ohta, and S. Shin, Phys. Rev. Lett. 100, 056401 (2008)
- (23) Y. J. Chang, C. H. Kim, S. H. Phark, Y. S. Kim, J. Yu, and T. W. Noh, Phys. Rev. Lett. 103, 057201 (2009)
- (24) N. V. Krainyukova and V. V. Butskii, Surf. Sci. 454, 628 (2000)
- (25) A. Damascelli, Z. Hussain, and Z.-X. Shen, Rev. Mod. Phys. 75, 473 (2003)
- (26) J. L. M. van Mechelen, D. van der Marel, C. Grimaldi, A. B. Kuzmenko, N. P. Armitage, N. Reyren, H. Hagemann, and I. I. Mazin, Phys. Rev. Lett. 100, 226403 (2008)
- (27) L. Perfetti, H. Berger, A. Reginelli, L. Degiorgi, H. Hochst, J. Voit, G. Margaritondo, and M. Grioni, Phys. Rev. Lett. 87, 216404 (2001)
- (28) N. Mannella, W. L. Yang, X. J. Zhou, H. Zheng, J. F. Mitchell, J. Zaanen, T. P. Devereaux, N. Nagaosa, Z. Hussain, and Z. X. Shen, Nature 438, 474 (2005)
- (29) F. Gervais, J. L. Servoin, A. Baratoff, J. Bednorz, and G. Binnig, Phys. Rev. B 47, 8187 (1993)
- (30) P. von Allmen, Phys. Rev. B 46, 13345 (1992)
- (31) H. P. R. Frederikse, W. R. Hosler, and W. R. Thurber, Phys. Rev. 143, 648 (1966)
- (32) M. Marques, L. K. Teles, V. Anjos, L. M. R. Scolfaro, J. R. Leite, V. N. Freire, G. A. Farias, and J. E. F. da Silva, Appl. Phys. Lett. 82, 3074 (2003)
- (33) Y. Ando, N. Miyamoto, K. Segawa, T. Kawata, and I. Terasaki, Phys. Rev. B 60, 10580 (1999)
- (34) Y. S. Kim, J. Kim, S. J. Moon, W. S. Choi, Y. J. Chang, J. G. Yoon, J. Yu, J. S. Chung, and T. W. Noh, Appl. Phys. Lett. 94, 202906 (2009)