Calcium and light-elements abundance variations from high resolution spectroscopy in globular clusters 11affiliation: Based on data collected at the European Southern Observatory, Chile, programmes 072.D-507,073.D-0211,072.D-0742,077.D-0182
Abstract
We use abundances of Ca, O, Na, Al from high resolution UVES spectra of 200 red giants in 17 globular clusters (GCs) to investigate the correlation found by Lee et al. (2009) between chemical enrichment from SN II and star-to-star variations in light elements in GC stars. We find that (i) the [Ca/H] variations between first and second generation stars are tiny in most GCs ( dex, comparable with typical observational errors). In addition, (ii) using a large sample of red giants in M 4 with abundances from UVES spectra from Marino et al. (2008), we find that Ca and Fe abundances in the two populations of Na-poor and Na-rich stars are identical. These facts suggest that the separation seen in color-magnitude diagrams using the band or index (as observed in NGC 1851 by Han et al. 2009) are not due to Ca variations. Small differences in [Ca/H] as associated to variations might be due to a small systematic effect in abundance analysis, because most O-poor/Na-rich (He-rich) stars have slightly larger [Fe/H] (by 0.027 dex on average, due to decreased H in the ratio) than first generation stars and are then located at redder positions in the plane. While a few GCs (M 54, Cen, M 22, maybe even NGC 1851) do actually show various degree of metallicity spread, our findings eliminate the need of a close link between the enrichment by core-collapse SNe with the mechanism responsible for the Na-O anticorrelation.
Subject headings:
stars: abundances — stars: evolution — globular clusters: general1. Introduction
Stars of different stellar generations111We will use the words stellar “generation” and “population” interchangeably, for the reasons explained later. are currently routinely found in all Galactic globular clusters (GCs). A common misunderstanding is to identify multiple sequences in the color-magnitude diagrams (CMDs) as the only evidence of multiple stellar populations in GCs, while they are only the tip of the iceberg, observable when differences in chemical composition and/or age are very large. However, all GCs display large spreads in abundances of light elements. These are due to the presence of two generations of stars, separated by a small difference in age, not enough to appear as a smearing of the cluster turn-off, but clearly visible as a different chemical signature. This difference can be uncovered by spectroscopy (see Gratton et al. 2004 for a recent review). Since its discovery by the Lick-Texas group (see the early review by Kraft 1994), the Na-O anticorrelation in GCs offers a powerful instrument to resolve age differences as small as a few 107 yrs (should very massive stars be involved) by means of a signal as large as 1 full dex in abundance. Whenever the Na-O anticorrelation is observed in a GC, multiple stellar generations are present in the cluster.
The primordial P component of first generation stars, present in almost all Galactic GCs surveyed so far, has the high [O/Fe] and low [Na/Fe] ratios typical of core-collapse supernovae (SNe II) nucleosynthesis, characteristic of halo field stars with similar metallicity. On the other hand, Carretta et al. (2009a) showed that two other components of second generation stars may be found: one dominant component has intermediate composition (I; observed in GC), and another has extremely (E) modified composition, showing large O-depletion and Na (and Al) enhancements, present only in the most massive clusters222The operational distinction between I and E components (Carretta et al., 2009a) is not relevant here and we only consider the total fraction (I+E) of second generation stars.. This general pattern can be qualitatively produced by proton-capture reactions in H-burning at high temperature (Denisenkov & Denisenkova 1989; Langer et al. 1993). The fact that the same Na-O and Mg-Al anticorrelations are found in unevolved stars in several GCs (Gratton et al. 2001; Ramirez & Cohen 2002; Carretta et al. 2004) tells us that this composition is inherited from the ashes of a previous generation of stars.
While the involved processes have been largely identified, it is still not clear where these reactions occurred, the favorite sites being either main-sequence core H-burning of fast rotating massive stars (FRMS, Decressin et al. 2007) or the hot bottom of the convective envelope in intermediate-mass asymptotic giant branch (AGB) stars (Ventura et al., 2001). Whichever the sites are, they can not synthesize iron or other elements heavier than Al. Indeed, apart from a few notable exceptions ( Cen, see reference in Gratton et al. 2004; M 22, Marino et al. 2009; Da Costa et al. 2009; M 54, Carretta et al. 2010a; Terzan 5, Ferraro et al. 2009; and possibly NGC 1851, Yong & Grundahl 2008) the level in [Fe/H] or and Fe-group elements is very constant in GCs (Carretta et al., 2009b).
However, a recent work by Lee et al. (2009, from now L09) seems to challenge this consolidated scenario, because in their Ca- survey they found a spread in the photometric index (including Ca ii H and K lines) for several GCs. They interpret this spread as due to Ca abundance variations and claim that this element was produced by SN II in a past phase of the lifetime of GCs. In turn, these should be assumed to be initially much more massive than at present, else the highly energetic SNe winds would have been lost from the potential well. Moreover, they find that the Ca-strong group in GCs with evidence of multiple stellar populations from spectroscopy is associated to the population of stars with lower O and higher Na values, and vice versa concerning the Ca-weak stars.
The need of massive proto-clusters is common to most scenarios of chemical evolution of GCs, including one proposed by us (Carretta et al., 2010b). However a correlation between Ca and light elements would imply that the second generation stars were formed from material enriched not only by FRMS or AGB stars, but also by SN II events, which is a substantial modification of the current scenario.
In the present Letter we exploit the large wealth of data from our ongoing project “Na-O anticorrelation and HB” (Carretta et al., 2006) and from other extensive spectroscopic surveys to compare [Ca/H] ratios obtained from high resolution spectroscopy with the abundance distribution of O, Na, Al in a sample of several hundred red giant branch (RGB) stars in 17 GCs. This allows to shed light on the rôle of Ca in the chemical evolution of GCs; from our extensive spectroscopic database, we seek to confirm whether the spread in the photometric index is driven by a real spread in Ca abundance.
2. Atmospheric parameters and abundance analysis
The full description of the analysis is given in Carretta et al. (2009b); here we present only the abundances of Ca, which are based on a large number of lines (typically 10-12 in the most metal-poor clusters like M 15 and almost 20 in metal-rich GCs like 47 Tuc). The [Ca/Fe] ratios with the number of lines and the line-to-line r.m.s. scatter for each star are listed in Table 1 (completely available on line only). In Table 2 we report the number of stars in each cluster, the average [Ca/Fe] and [Ca/H] values and the 1 scatter of the mean. The rms scatters in [Ca/Fe] are smaller than in [Ca/H] because the sensitivity of Ca and Fe lines to atmospheric parameters is quite similar. Five of the clusters listed in Table 1 are included in the sample by L09, who claim significant spread in Ca for four of them.
The values listed in Table 2 indicate that the mean level of Ca is highly homogeneous in each GCs. The average r.m.s. star-to-star scatter for [Ca/Fe] is 0.03 dex from 17 GCs, to be compared with average scatter of 0.18 dex, 0.22 dex, 0.07 dex and 0.25 dex for O, Na, Mg, and Al respectively. Note that the mean scatter in Mg, produced by core collapse SNe but also involved in proton-capture reactions, is more than twice that of Ca, which does not participate in any H-burning.
3. Results
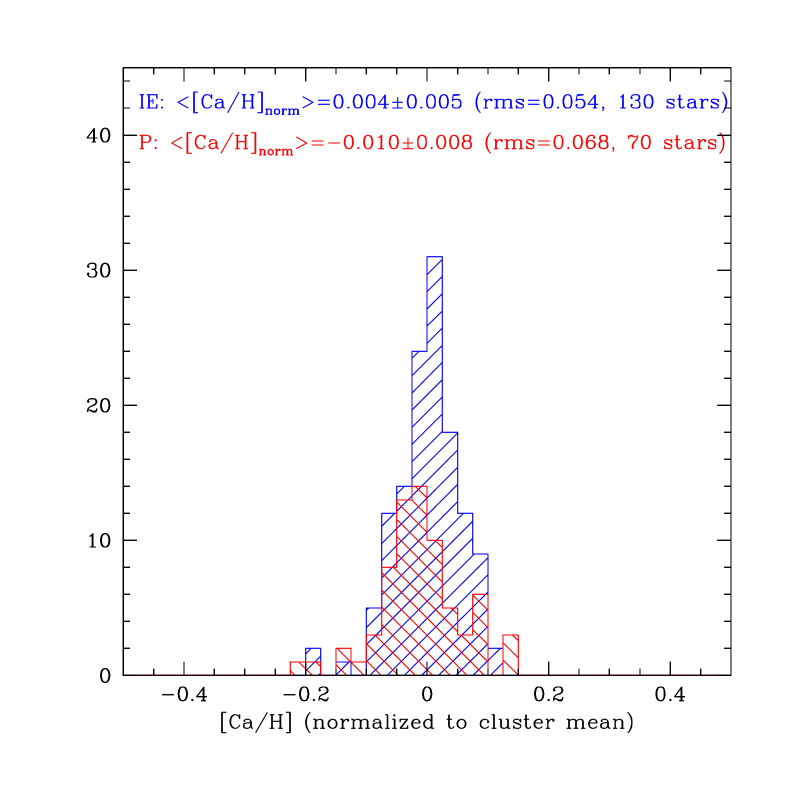
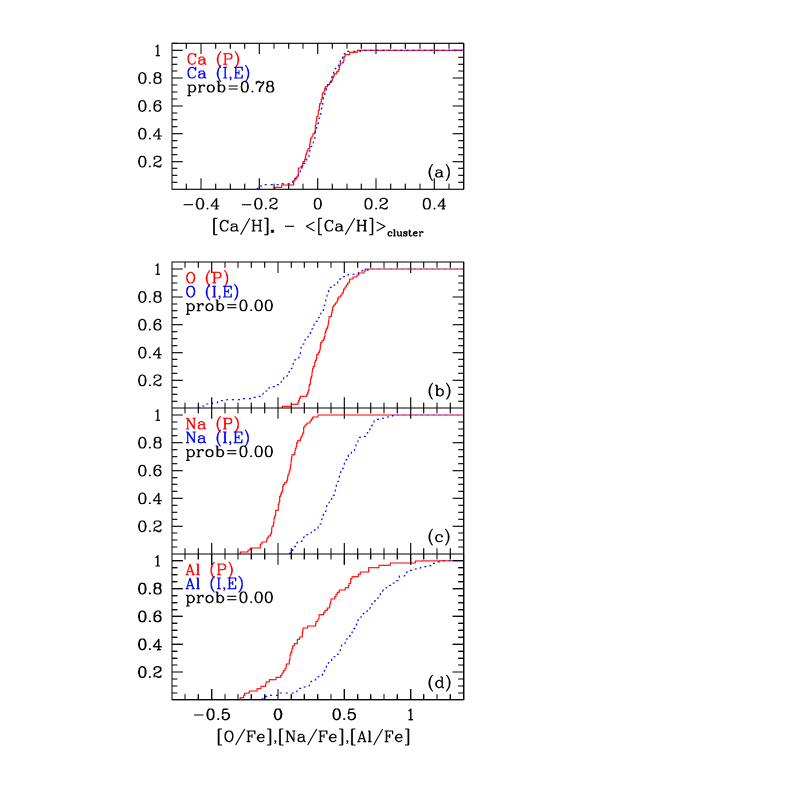
Since we have only about 10 stars per cluster observed with UVES, we combined the 17 GCs, separating first generation (P) stars from second generation (I+E) stars. For direct comparison with L09, we used [Ca/H] instead of [Ca/Fe], after normalizing the individual values to the mean of each cluster. In Figure 1 we show the histogram in [Ca/H] for P and I+E stars, with average values, errors, and rms. About two thirds of stars belong to the second generation, and the average normalized [Ca/H] values do not differ from those of first generation (at about 1). A further check comes from the cumulative distributions, shown in Figure 2 (upper panel), from which we excluded the 12 stars of NGC 2808, the GC in our sample showing the most extreme variations in He (Piotto et al. 2007; Bragaglia et al. 2010, and below in this Letter). The two distributions cannot be distinguished. Note that if we include also NGC 2808, the probability of the Kolmogorov-Smirnov drops to 0.07, still compatible with no significant difference, but possibly indicating some actual variations in this particular cluster. However, when we show in the three lower panels of Figure 2 the cumulative distributions for [O/Fe], [Na/Fe], and [Al/Fe], all elements involved in the (anti)correlations in GCs, we clearly see a striking difference (compare e.g. to supplementary Fig.14 of L09).
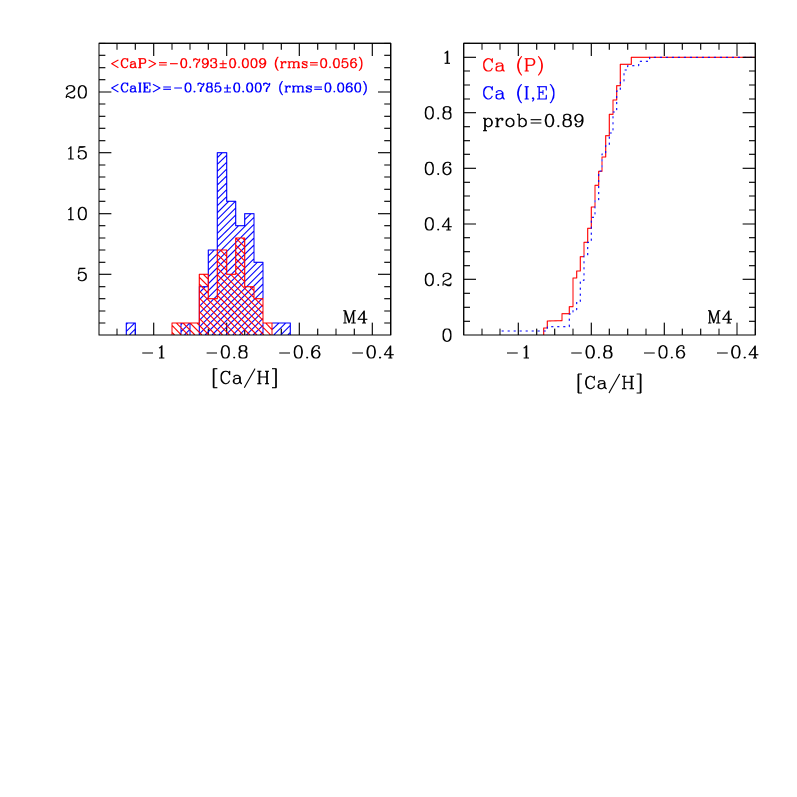
Our sample of 200 stars comes from 17 different GCs, but there is already available in literature a sample of similar size for a single GC, M 4, for which Marino et al. (2008) analyzed high resolution UVES spectra of 105 RGB stars. This cluster is also in the L09 sample; from their supplementary Fig.14 (panel i) we see that almost all stars defined Ca-strong are Na-rich (in our interpretation, second generation I, E) and vice versa for the Ca-weak. However, when we divide the stars in the Marino et al. sample in P and I+E (using their same separation at [Na/Fe]=0.2) and compare the histograms and the means of the two populations (see Figure 3, left panel), they look very similar333As noticed by the referee, the same result holds using the 38 stars in NGC 6752 analyzed by Yong et al. (2005). . This is supported by the cumulative distributions (Figure 3, right panel): they are indistinguishable, according to the KS test. A further check was done considering only stars in the two extreme quartiles in Na abundance: the average Ca values in the more Na-poor and in the more Na-rich stars perfectly agree with the ones in Figure 3 for the I+E and P stars, respectively.
The stars called Ca-weak (Ca-strong) on the basis of their index do not seem to have lower (higher) [Ca/H] values from direct analysis of high resolution spectra; this demonstrates that the differences in the index must be produced by something other than Ca variations.
It is important to stress that the observational effect at the basis of the L09 claim corresponds to 1 spreads in [Ca/H] of about 0.03 dex in the most extreme cases (NGC 1851, NGC 2808, excluding the special cases of Cen and M 22 where the presence of a significant spread in iron has already been established with high resolution spectroscopy) and of about 0.02 dex for typical cases (like M 4, M 5, and NGC 6752, see Table 2)444We used their supplementary Table 3 for the FWHM of the RGB of the GC we have in common, converted them back to scatter in assuming a Gaussian distribution, and further converted to scatter in [Ca/H] and [Fe/H] using the sensitivity of Ca on the variation in (suppl. Sect. 4) and the relations in Sect. 3.. In our view, these numbers call for two basic considerations:
-
1.
Such tiny spreads are similar in amplitude to several uncertainties that are known to affect the abundance analysis (like e,g, variations in the He content); they are usually neglected since the overall uncertainty on single measures is typically larger than this. We do not exclude that there might be dispersions at these very low levels, but presently they can not be separated from the intrinsic errors.
-
2.
even if we regard these very small variations as real, some basic algebra indicates that, assuming a mass of and a metallicity of for the gas cloud that gave origin to the cluster, a single SN II event would be sufficient to produce the required amount of Ca (and Fe).
4. The case for NGC 1851
If the tiny variations detected in most GCs are not measuring intrinsic scatter in Ca, what might be the cause for the variations in the index? L09 discussed several issues to show that the only way to affect the index is a change in Ca. Specifically, they made a strong case for NGC 1851, where the few “Ca-strong” stars (with abundances from high resolution spectroscopy by Yong & Grundahl (2008) are segregated to the reddest positions in the CMD. In a recent paper, Han et al. (2009) presented a split of the RGB in this cluster in the plane, where the redder sequence is populated by Ca-strong stars.
We simply note the striking similarity between the CMD by Han et al. with the CMD for M 4 by Marino et al. (2008). In both cases, the RGB is clearly split into two distinct sequences. However, the same dichotomy of RGB sequences in M 4 is explained by Marino et al. (2008) as the N enhancement affecting the colors (through the CN and NH molecular bands within the filter), so that Na-rich (and likely N rich) stars are separated from Na-Poor (and N-poor) stars in the CMDs. Since we demonstrated in Figure 3 that in M 4 the [Ca/H] ratio is identical for the Na-poor and Na-rich stars, the same conclusion might be valid for NGC 1851.
A further piece of the puzzle comes from Carretta et al. (2009a), who confirmed results by Yong et al. (2008) in NGC 6752: Na-poor stars define a narrow N-poor sequence all confined to the bluest part of the RGB in NGC 6752, whereas the Na-rich (N-enhanced) stars are spread out to the red part of the RGB, reaching large N abundances. Now, regardless of the nature of the polluters, the ejected matter is always enriched in the main outcome of H-burning, He. Bragaglia et al. (2010, in preparation) used a large sample (about 1400 RGB stars in 19 GCs) to show that stars with higher He content should have on average slightly larger [Fe/H] values the difference between the E and P stars being 0.027 dex in [Fe/H], even if there is no difference in the overall metal content Z.
These findings suggest that the correlation observed by L09 between the (small) dispersion in [Ca/H] and the (large) spread in may be related to variations in He and light elements only, with no fresh production of Fe and Ca. The sizable effect on the Kolmogorov-Smirnov test of the inclusion of NGC 2808 in the sample (Sect. 3) lends further support to this scenario, as this cluster seems to display especially large variations in He abundance (Piotto et al., 2007; Bragaglia et al., 2010).
Hence, while it is quite possible that in NGC 1851 some small intrinsic scatter in iron does actually exist (Yong & Grundahl, 2008), our results do not support the idea that core collapse SNe contributed to the enrichment of second generation stars in most GCs, and indicate that the production of the proton-capture elements occurred in sites not able to synthesize Ca and Fe-peak elements.
5. Discussion and conclusions
Lee and coworkers devised a scenario for chemical enrichment in clusters with multiple populations. It includes two-phases. First, core collapse SNe from first generation stars inject in the intra-cluster medium material enriched with Fe and elements; at least part of this material is not lost by the GCs owing to their larger mass at early epochs. Second generation stars form from this enriched material, incorporating the ejecta of intermediate-mass AGB stars with longer evolutionary times. The second generation stars are then produced from matter enriched both in heavy and light elements.
However, in our opinion, this scenario has to face several problems:
-
•
Since there is clear evidence of multiple populations from spectroscopy in all GCs, except perhaps a few small ones with only a handful of stars analyzed (e.g. Pal 12, Cohen 2004; Ter 7, Sbordone et al. 2007; both belonging to the Sagittarius dwarf galaxy), any proposed scenario must account for the formation of the generality of GCs.
-
•
While a single core collapse SN might be enough to produce the claimed scatter in [Ca/H], thousands (or even more) FRMS or massive AGB stars are required to produce the observed pattern for elements involved in proton-capture processes. The impact of these two mechanisms can not be the same.
- •
-
•
In GCs like M 4, a split in of 45 (measurement errors for the populations, L09, supplementary Fig. 10) between two populations translates in virtually no difference in the [Ca/H] ratios obtained from a homogeneous large sample of stars with high resolution spectra.
-
•
If FRMS are the polluters, the whole model would fail, since these stars release the polluted matter in very short time, while still in MS. Hence, the timescale is even shorter than that for production of core collapse SNe.
-
•
The model by L09, adapted to explain the double RGB seen in NGC 1851, results in a number ratio of first-to second generation stars equal to 3 (75%/25%). From spectroscopy, on the other hand, it was found that the bulk of stars in GCs belong to the second generation (Cohen et al., 2002; Carretta et al., 2009b), with a number ratio typically of about 0.5 (0.33/0.66). We stress that this feature is a prerogative of mono-metallic GCs, the same value for the primordial fraction is also found in Cen and M 54 (Carretta et al., 2010a), the two most massive clusters in the Galaxy, both showing actual (large) dispersion in [Fe/H]: this finding demonstrates that the relative fractions of first and second generation stars are not related to the enrichment of heavy elements.
-
•
The process element europium, whose main production site is expected to be core-collapse SNe, is fairly constant within all the studied globular clusters (Gratton et al., 2004).
-
•
Finally, one of the strongest objection to the L09 model comes from the run of Al. With its yield extremely dependent on the neutron excess (metallicity), any variations in the content of Fe (or heavy element produced in SN II, like Ca) should be accompanied by clear changes in the primordial Al abundance. As shown by Carretta et al. (2009b) this is not always seen, in particular in clusters like M 4 where a bimodal distribution is claimed in the distribution. The Al distribution is far from being bimodal in M 4, on the contrary [Al/Fe] is quite constant and does not vary between first and second generation stars. This is clearly seen also in other GCs like NGC 6171, NGC 288, and NGC 6838 from our own data (Carretta et al., 2009b) as well in the larger sample by Marino et al. (2008). This constancy, due to the secondary (metallicity-dependent) production of Al in SNe strongly precludes that any significant difference in heavy metal-content is provided by SNe to stars in different stellar generations in GCs.
We conclude that (i) the spreads in [Ca/H] are very small; (ii) different distributions in O, Na, Al are clearly seen between first and second generation stars in GCs analyzed so far, on the contrary no statistically significant difference is found regarding Ca abundances from high resolution spectroscopy; (iii) the small difference in Ca observed in some cases might be well explained with systematic second-order effects due to the fact that second generation stars are He-enhanced, and appear more metal-rich and hotter when analyzed with high resolution spectroscopy.
At the moment, we cannot offer a viable alternative explanation for the dispersion in the index observed by Lee and collaborators, although this issue certainly requires further studies.
References
- Bragaglia et al. (2010) Bragaglia, A., et al. 2010, in preparation
- Carretta et al. (2004) Carretta, E., Gratton R.G., Bragaglia, A., Bonifacio, P. & Pasquini, L. 2004, A&A, 416, 925
- Carretta et al. (2006) Carretta, E., Bragaglia, A., Gratton R.G., Leone, F., Recio-Blanco, A., Lucatello, S. 2006, A&A, 450, 523
- Carretta et al. (2009a) Carretta et al. 2009a, A&A, 505, 117
- Carretta et al. (2009b) Carretta, E., Bragaglia, A., Gratton, R.G., Lucatello, S. 2009b, A&A, 505, 139
- Carretta et al. (2010a) Carretta et al. 2010a, ApJ Letters, submitted
- Carretta et al. (2010b) Carretta, E., Bragaglia, A., Gratton, R.G., Recio-Blanco, A., Lucatello, S., D’Orazi, V., Cassisi, S. 2010b, A&A, submitted
- Cohen (2004) Cohen, J.G. 2004, AJ, 127, 1545
- Cohen et al. (2002) Cohen, J.G., Briley, M.M., Stetson, P.B. 2002, AJ, 123, 2525
- Da Costa et al. (2009) Da Costa, G.S., Held, E.V., Saviane, I., Gullieuszik, M. 2009, ApJ, 705, 1481
- Decressin et al. (2007) Decressin, T., Meynet, G., Charbonnel C. Prantzos, N., Ekstrom, S. 2007, A&A, 464, 1029
- Denisenkov & Denisenkova (1989) Denisenkov, P. A., & Denisenkova, S. N. 1989, A.Tsir., 1538, 11
- Ferraro et al. (2009) Ferraro, F.R. et al. 2009, Nature, 462, 483
- Gratton et al. (2001) Gratton, R. G. et al. 2001, A&A, 369, 87
- Gratton et al. (2004) Gratton, R.G., Sneden, C., Carretta, E. 2004, ARA&A, 42, 385
- Han et al. (2009) Han, S.-I., Lee, Y.-W., Joo, S.-J., Sohn, S.-T., Yoon, S.-J., Kim, H.-S., Lee, J.-W. 2009, ApJ, 707, L190
- Kraft (1994) Kraft, R. P. 1994, PASP, 106, 553
- Langer et al. (1993) Langer, G. E., Hoffman, R., & Sneden, C. 1993, PASP, 105, 301
- Lee et al. (2009) Lee, J.W., Kim, S.-L., Lee, C.-U., Youn, J.-H. 2009, Nature, 462, 480
- Marino et al. (2008) Marino, A.F., Villanova, S., Piotto, G., Milone, A.P., Momany, Y., Bedin, L.R., Medling, A.M. 2008, A&A, 490, 625
- Marino et al. (2009) Marino, A.F., Milone, A., Piotto, G., Villanova, S., Bedin, L., Bellini, A., Renzini, A. 2009, A&A, 505, 1099
- Piotto et al. (2007) Piotto, G., et al. 2007, ApJ, 661, L53
- Ramirez & Cohen (2002) Ramirez, S., Cohen, J.G. 2002, AJ, 123, 3277
- Sbordone et al. (2007) Sbordone, L., Bonifacio, P., Buonanno, R., Marconi, G., Monaco, L., Zaggia, S. 2007, A&A, 465, 815
- Ventura et al. (2001) Ventura, P. D’Antona, F., Mazzitelli, I., & Gratton, R. 2001, ApJ, 550, L65
- Yong & Grundahl (2008) Yong, D., Grundahl, F. 2008, ApJ, 672, L29
- Yong et al. (2008) Yong, D., Grundahl, F., Johnson, J.A., Asplund, M. 2008, ApJ, 684, 1159
- Yong et al. (2005) Yong, D., Grundahl, F., Nissen, P.E., Jensen, H.R., Lambert, D.L. 2005, A&A, 438, 875
| GC ID | star | nr. | [Ca/Fe] | [Ca/H] | flag PIE | |
|---|---|---|---|---|---|---|
| NGG0104 | 5270 | 15 | 0.299 | 0.150 | 0.473 | 2 |
| NGG0104 | 12272 | 14 | 0.310 | 0.107 | 0.437 | 2 |
| NGG0104 | 13795 | 11 | 0.345 | 0.105 | 0.487 | 1 |
| NGG0104 | 14583 | 14 | 0.309 | 0.110 | 0.375 | 2 |
| NGG0104 | 17657 | 11 | 0.298 | 0.127 | 0.546 | 3 |
| NGG0104 | 18623 | 19 | 0.322 | 0.213 | 0.451 | 2 |
| GC ID | nr | [Ca/Fe] | err1 | err2 | [Ca/H] | ||
|---|---|---|---|---|---|---|---|
| NGC 0104 | 11 | +0.31 | 0.01 | 0.03 | 0.03 | 0.45 | 0.06 |
| NGC 0288 | 10 | +0.41 | 0.02 | 0.02 | 0.03 | 0.90 | 0.05 |
| NGC 1904 | 10 | +0.28 | 0.01 | 0.02 | 0.02 | 1.30 | 0.04 |
| NGC 2808 | 12 | +0.34 | 0.02 | 0.03 | 0.03 | 0.81 | 0.07 |
| NGC 3201 | 13 | +0.30 | 0.03 | 0.02 | 0.02 | 1.21 | 0.07 |
| NGC 4590 | 13 | +0.26 | 0.03 | 0.03 | 0.03 | 2.00 | 0.04 |
| NGC 5904 | 14 | +0.38 | 0.02 | 0.02 | 0.03 | 0.96 | 0.05 |
| NGC 6121 | 14 | +0.42 | 0.03 | 0.02 | 0.03 | 0.75 | 0.07 |
| NGC 6171 | 5 | +0.41 | 0.02 | 0.03 | 0.03 | 0.63 | 0.08 |
| NGC 6218 | 11 | +0.42 | 0.03 | 0.03 | 0.03 | 0.91 | 0.04 |
| NGC 6254 | 14 | +0.34 | 0.04 | 0.02 | 0.02 | 1.23 | 0.07 |
| NGC 6397 | 13 | +0.28 | 0.03 | 0.03 | 0.03 | 1.71 | 0.05 |
| NGC 6752 | 14 | +0.40 | 0.03 | 0.03 | 0.03 | 1.16 | 0.04 |
| NGC 6809 | 14 | +0.36 | 0.04 | 0.02 | 0.02 | 1.58 | 0.07 |
| NGC 6838 | 12 | +0.31 | 0.06 | 0.03 | 0.03 | 0.53 | 0.07 |
| NGC 7078 | 13 | +0.25 | 0.05 | 0.03 | 0.03 | 2.07 | 0.10 |
| NGC 7099 | 10 | +0.31 | 0.04 | 0.03 | 0.03 | 2.03 | 0.05 |