The Building Up of the Black Hole Mass - Stellar Mass Relation
Abstract
We derive the growth of SMBHs relative to the stellar content of their host galaxy predicted under the assumption of BH accretion triggered by galaxy encounters occurring during their merging histories. The latter are described through Monte Carlo realizations, and are connected to gas processes, star formation and BH accretion using a semi-analytic model of galaxy formation in a cosmological framework. This allows us to connect the star formation process in the host galaxies to the growth of Supermassive Black Holes. We show that, within this framework, the ratio between the Black Hole mass and the galactic stellar mass (normalized to the local value) depends on both BH mass and redshift. While the average value and the spread of increase with , such an effect is larger for massive BHs, reaching values for massive Black Holes ( ) at , in agreement with recent observations of high-redshift QSOs; this is due to the the effectiveness of interactions in triggering BH accretion in high-density environments (where massive haloes form) at high redshifts.
To investigate how different observations of fit within our framework, we worked out specific predictions for sub-samples of the simulated galaxies corresponding to the different observational samples for which measurements of have been obtained. We found that for Broad Line AGNs at intermediate redshifts values of are expected, with a mild trend toward larger value for increasing BH mass. Instead, when we select from our Monte Carlo simulations only extremely gas rich, rapidly star forming galaxies at the epoch of peak in the cosmic star formation (), we find low values , consistent with recent observational findings on samples of sub-mm galaxies; in the framework of our model, these objects end up at in low-to-intermediate mass BHs ( ), and they do not represent typical paths leading to local massive galaxies. The latter have formed preferentially through paths (in the plane) passing above the local relation. We discuss how the global picture emerging from the model is consistent with a downsizing scenario, where massive BHs accrete a larger fraction of their final mass at high redshifts
keywords:
galaxies: active — galaxies: formation — galaxies: evolution1 Introduction
The discovery of tight local correlations between the mass of Supermassive Black Holes (SMBHs) and global properties of their host galaxies, like the stellar mass or the velocity dispersion , (Kormendy & Richstone 1995; Magorrian et al. 1998; Ho 1999; Gebhardt et al. 2000; Ferrarese & Merritt 2000; Marconi & Hunt 2003; Häring & Rix 2004; Kormendy & Bender 2009) constitutes an important breakthrough in the understanding of galaxy evolution. If the growth of SMBHs is considerably contributed by accretion over cosmological times (Soltan 1982; Yu & Tremaine 2002; Marconi et al. 2004; Merloni & Heinz 2008) this implies that most, if not all, galaxies have hosted an Active Galactic Nucleus (AGN) in the past, and that a strong physical connection exists between galaxy formation and the growth of SMBHs.
Understanding the mechanisms responsible for such a connection, and establishing the relative time scales for star formation/assembly and for SMBHs growth, requires the measurement of the above correlations at higher redshifts. For such a scope, the most straightforward correlation to study is the relation, since the other fundamental relation would require the measurement of stellar velocity dispersions which are very difficult to achieve at in normal galaxies.
The relation in the local Universe has been widely investigated in
the literature. Magorrian et al. (1998) were the first to find a correlation
between the black hole mass and the stellar mass,
however they found a very large scatter (0.51 dex). This relation was
then re-examined using more reliable and measurements (Merritt
& Ferrarese 2001, Marconi & Hunt 2003, Häring & Rix 2004); these studies
showed that the scatter in the relation is comparable to the
scatter in the relation (0.3 dex, see Häring & Rix
2004). It is also worth noting that the relation is BH mass dependent (Häring & Rix
2004), although the mean value of the ratio obtained from the Häring
& Rix (2004) sample: -2.8,
is consistent with those derived by Merritt & Ferrarese (2001) and Marconi &
Hunt (2003) when the latter is lowered by a factor
of 5/3 to account for more recent estimates of the bulge virial masses (see Maiolino et al. 2007).
The SMBH masses at are generally estimated in luminous type 1 AGNs like quasars (QSOs) and radio galaxies; for example, virial BH mass estimators are based on the assumption that the broad-line region of the AGNs are dominated by the gravity of the SMBH (see, e.g., Peterson & Wandel 2000), and provide mass estimates of SMBHs at higher redshifts (see Wandel, Peterson & Malkan 1999; Kaspi et al. 2000; McLure & Dunlop 2002, Merloni et al. 2009), extending out to (e.g., Willott, McLure & Jarvis 2003; McLure & Dunlop 2004; Vestergaard et al. 2004; Walter et al. 2004; Riechers et al. 2008). The evolution of the ratio from the local value is generally quantified in terms of the parameter:
| (1) |
Although the AGN activity makes it difficult to derive stellar masses for the
host galaxies at , several observational works suggest that at
such redshifts the mean ratio is significantly higher than the
present value, corresponding to .
Peng et al. (2006), applying the virial method on a sample of 31 gravitationally lensed AGNs and 20 non-lensed AGN and deriving the host galaxy stellar mass from the R-band luminosity, found the ratio to be higher than the present value by a factor for AGNs at and by a factor of at ; analysing the hosts of 89 broad-line AGNs in the COSMOS survey Merloni et al. (2009) derive a positive evolution fitted with in the redshift range ; exploiting radio-loud unification McLure et al. (2006) obtained virial (linewidth) BH mass estimates from the 3C RR quasars, and the stellar mass estimates from the 3C RR radio galaxies, thereby providing black hole and stellar mass estimates for a single population of early-type galaxies, finding for ; at even higher redshifts , measurements of the dynamical mass from the CO emission of molecular gas in the hosts of high-redshift QSOs (Walter et al. 2004; Riechers et al. 2008) yield large values of .
While the above studies indicate that the growth of SMBHs is faster than the stellar mass assembly, they all focus on luminous AGNs, and are thus biased towards selecting the most massive SMBHs (see Lauer et al. 2007). In contrast to the above results, from the analysis of a sample of sub-mm selected galaxies (SMGs) Borys et al. (2005) find to decrease with redshift for ; more recently, Alexander et al. (2008) found for SMGs at , indicating that for such objects the growth of SMBHs actually lags that of the host stellar mass. These latter studies are affected by a different bias, in that they select ultra-luminous (), gas-rich galaxies (with gas fraction relative to baryonic mass , see Greve et al. 2005; Tacconi et al. 2008), characterized by the conversion of a significant fraction of their initial gas reservoir of into stars in a short times scale of a few yrs (see Tacconi 2008 and references therein); given the correlation between star formation rate and stellar mass, such observations tend to be biased towards massive stellar hosts.
Attempts to derive the evolution of the global averaged over for whole AGN population requires a different approach, based on integrated observables. By comparing the redshift evolution of the integrated BH and of the stellar mass densities Merloni, Rudnick & Di Matteo (2004) found that with 0.5. Such a results is consistent with the upper limits on the evolution of derived by Hopkins et al. (2006) for 2.
Thus, a major challenge for next studies of AGN and galaxy formation is understanding which of the above classes of paths is the dominant one in the cosmological evolution of galaxies and SMBHs, and what are the physical mechanisms determining the particular path followed by a galaxy as a function of its properties in different cosmic epochs. While on the observational side such a task would require a large, unbiased sample of AGNs, a complementary approach is to consider cosmological models of galaxy and SMBH evolution which assume a given physical mechanism for the AGN feeding and for its connections with the evolution of the host galaxy; then, comparing the predictions of such models for specific classes of objects with different existing observations would constitute a powerful probe for the proposed physical link between galaxies and SMBHs.
Indeed, in the recent years, significants steps forward had been taken toward the modelling of the cosmological co-evolution of galaxies and AGNs, starting from the seminal papers by Silk & Rees (1998); Fabian (1999); Cavaliere & Vittorini (2000); Wyithe & Loeb (2003). On the one hand, recent high-resolution hydrodynamic N-body simulations (see, e.g., Di Matteo, Springel & Hernquist 2005, Springel 2005; Hopkins 2005, 2006) have shown the importance of galaxy mergers as triggers for AGN accretion, and the role of the AGN energy feedback in the subsequent evolution of the host galaxy. However, such simulations are affected by a limited exploration of the sub-grid prescriptions for the physics of SMBHs; most important, they necessarely focus on specific galaxy systems, making it difficult to assess the statistical relevance of a particular path in the building up of the local relation. On the other hand, semi-analytic models (SAMs, Monaco, Salucci & Danese 2000, Kauffmann & Haenhelt 2000; Volonteri, Haardt & Madau 2003; Granato et al. 2004; Menci et al. 2006; Croton et al. 2006; Bower et al. 2006; Marulli et al. 2008) can probe the whole set of possible paths followed by galaxies in the plane during their evolution. Since their results depend on the mechanisms assumed for the trigger of the AGN accretion and for the AGN energy feedback, SAMs are suitable to probe the statistical outcomes provided by the implemented physical processes linking SMBHs with their host galaxy.
Here we adopt a state-of-the-art SAM (Menci et al. 2006, 2008) which implements a specific, physical model for the BH accretion based on interactions as triggers for both the fueling of SMBHs and the star bursts. In turn, the interaction rate, the amount of gas available for BH accretion, and the stellar content of galaxies are computed from Monte Carlo realizations of galaxy merging trees, enabling us to follow the evolutionary paths of galaxies and of their SMBHs over cosmological times, from the collapse of their progenitors from the primordial density field to the present. Based on such a model we derive the evolutionary paths for the growth of SMBHs relative to that of the stellar mass of their host galaxies, to investigate which are the dominant paths followed by different galaxy populations in building up the local relation in a scenario characterized by AGN fueling driven by galaxy interactions. We then compare different model predictions for the ratio of luminous intermediate- and high-redshift galaxies, and for intermediate redshift SMGs with existing observations, and discuss the physical origin of the different paths followed by galaxies and SMBHs during their evolution. Finally, we shall provide specific predictions typical of the scenario characterized by interaction-driven AGN fueling, to be tested with next experiments.
2 The Model
We use the semi-analytic model as is described in details in Menci et al. (2005, 2006, 2008); this connects, within a cosmological framework, the accretion onto SMBHs and the ensuing AGN activities with the evolution of galaxies. Here we recall the basic points.
2.1 Hierarchical Galaxy Evolution
Galaxy formation and evolution is driven by the collapse and growth of dark matter (DM) haloes, which originate by gravitational instability of overdense regions in the primordial DM density field. This is taken to be a random, Gaussian density field with Cold Dark Matter (CDM) power spectrum within the ”concordance cosmology” (Spergel et al. 2007) for which we adopt round parameters , , baryonic density and Hubble constant (in units of 100 km/s/Mpc) . The normalization of the spectrum is taken to be in terms of the variance of the field smoothed over regions of 8 Mpc.
The merging rates of the DM haloes are provided by the Extended Press & Schechter formalism (see Bond et al. 1991; Lacey & Cole 1993). The clumps included into larger DM haloes may survive as satellites, or merge to form larger galaxies due to binary aggregations, or coalesce into the central dominant galaxy due to dynamical friction; these processes take place over time scales that grow longer over cosmic time, so the number of satellite galaxies increases as the DM host haloes grow from groups to clusters (see Menci et al. 2005, 2006).
The processes connecting the baryonic components to the growing DM haloes (with mass ) are described in our previous papers (e.g., Menci et al. 2005). The gas at virial equilibrium with the DM potential wells undergoes radiative cooling. The cooled gas mass settles into a rotationally supported disc with radius (typically ranging from to kpc), rotation velocity and dynamical time . Two channels of star formation may convert part of such a gas into stars: i) quiescent star formation, corresponding to the gradual conversion into stars at a rate ii) starbursts triggered by interactions, which destabilize part of the cold gas available by inducing loss of angular momentum. Note that galaxy interactions (among galaxies with relative velocity ) include not only merging but also fly-by events. Part of energy released by SNae following star formation is fed back onto the galactic gas, thus returning part of the cooled gas to the hot gas phase
2.2 Accretion onto SMBHs and AGN emission
The model also includes a treatment of SMBHs growing at the centre of galaxies by interaction-triggered inflow of cold gas, following the physical model proposed by Cavaliere & Vittorini (2000) and implemented in Menci et al. (2006, 2008). The accretion of cold gas is triggered by galaxy encounters (both of fly-by and of merging kind), which destabilize part of the cold gas available by inducing loss af angular momentum. The rate of such interactions is
| (2) |
Here is the number density of galaxies in the same halo, is their relative velocity, and is the cross section for such encounters which is given by Saslaw (1985) in terms of the tidal radius associated to a galaxy with given circular velocity (see Menci et al. 2003, 2004).
The fraction of cold gas accreted by the BH in an interaction event is computed in terms the variation of the specific angular momentum of the gas to read (Menci et al. 2003)
| (3) |
Here is the impact parameter, evaluated as the average distance of the galaxies in the halo. Also, is the mass of the partner galaxy in the interaction, and the average runs over the probability of finding such a galaxy in the same halo where the galaxy with mass is located. The values of the quantities involved in the average yield values of . For minor merging events and for the encounters among galaxies with very unequal mass ratios , dominating the statistics in all hierarchical models of galaxy formation, the accreted fraction takes values .
The average amount of cold gas accreted during an accretion episode is thus , and the duration of an accretion episode, i.e., the timescale for the QSO or AGN to shine, is assumed to be the crossing time for the destabilized cold gas component.
The time-averaged bolometric luminosity so produced by a QSO hosted in a given galaxy is then provided by
| (4) |
We adopt an energy-conversion efficiency (see Yu & Tremaine 2002), and derive the X-ray luminosities in the 2-10 keV band from the bolometric corrections given in Marconi et al. (2004). The SMBH mass grows mainly through accretion episodes as described above, besides coalescence with other SMBHs during galaxy merging. As initial condition, we assume small seed BHs of mass (Madau & Rees 2001) to be initially present in all galaxy progenitors; our results are insensitive to the specific value as long as it is smaller than some .
2.3 AGN feedback
Finally, our SAM model includes a detailed treatment of AGN feedback. This is assumed to stem from the fast winds with velocity up to observed in the central regions of AGNs (Weymann, Carswell & Smith 1981; Turnshek et al. 1988; Crenshaw et al. 2003; Chartas et al. 2002; Pounds et al. 2003, 2006; Risaliti et al. 2005); these are usually though to originate from the acceleration of disc outflows due to the AGN radiation field (Proga 2007 and references therein, Begelman 2004). These supersonic outflows compress the gas into a blast wave terminated by a leading shock front, which moves outwards with a lower but still supersonic speed and sweeps out the surrounding medium. Eventually, this medium is expelled from the galaxy.
Quantitatively, the energy injected into the galactic gas in such inner regions is taken to be proportional to the energy radiated by the AGN, . The value of the energy feedback efficiency for coupling with the surrounding gas is taken as (see Menci et al. 2008).
3 Results: Overview of SMBH growth
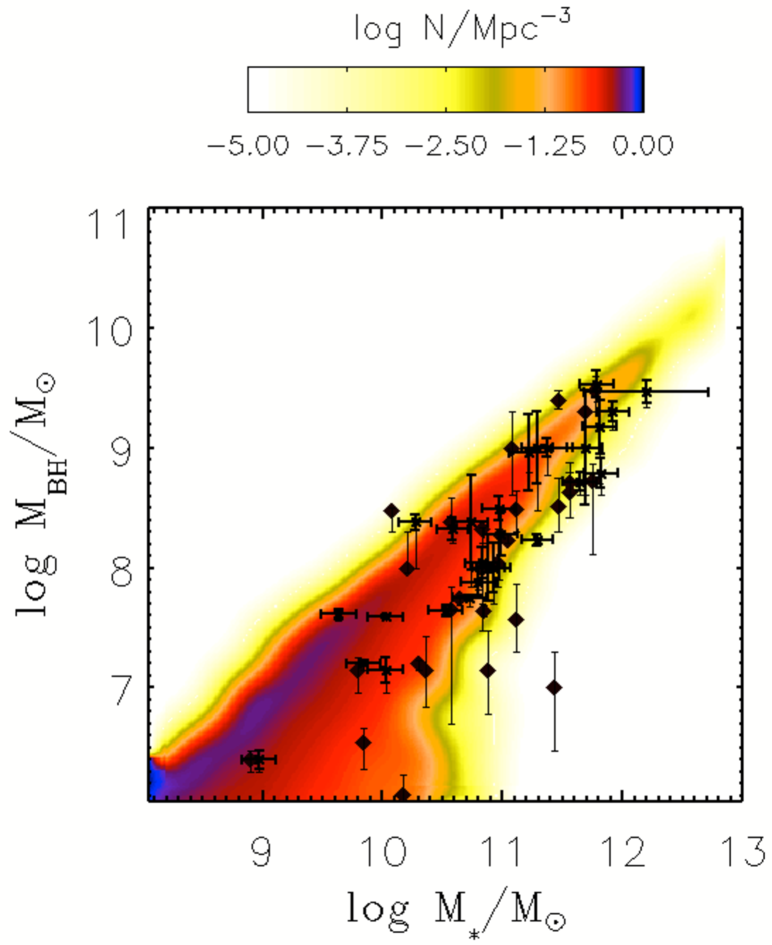
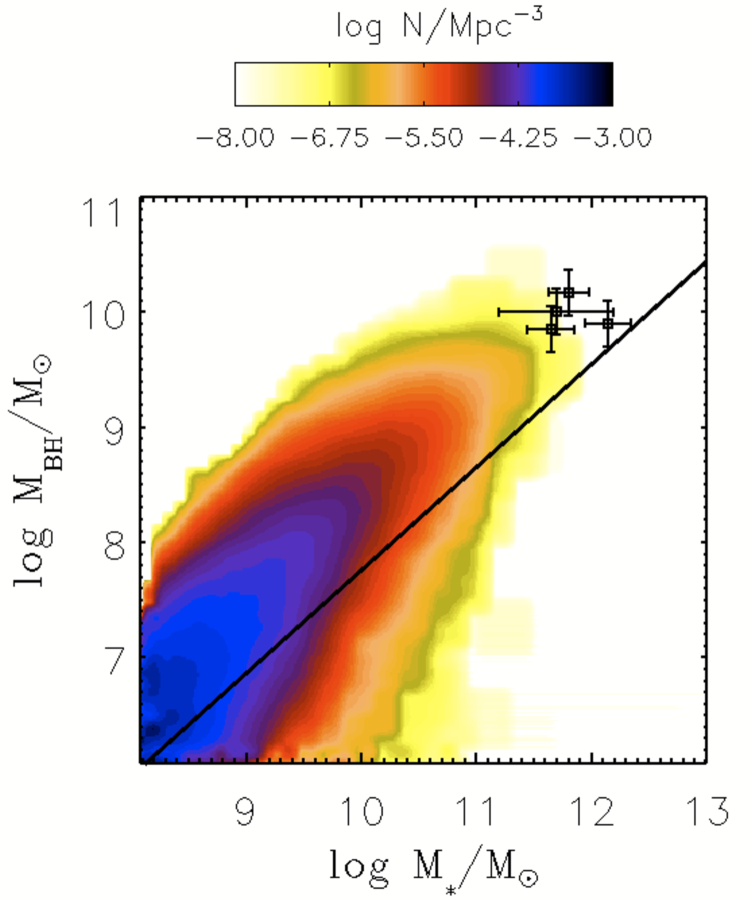
As a first step in the study of the relative growth of BHs and host galaxies, we show in fig. 1 the local (left panel) and the high-redshift (, central panel) relation that we obtain from our model.
The predicted local relation is consistent with observations, and the data lie on the predicted confidence region represented by the contour plot, although the predicted distribution shows a small offset from the observed best-fitting relations derived by Marconi & Hunt (2003) and Häring & Rix (2004). Although, in principle, the model parameters (like the AGN feedback efficiency or the normalization of the star formation efficiency) could be tuned to optimize the fitting to the observed local relation, this would also affect the predicted properties of the galaxy population (e.g., the evolution of the luminosity function, the colour distributions, the local Tully-Fisher relation) at both low and high redshifts. Since the model is intended to provide a unified description of AGNs and galaxy evolution, we chose to adopt the same fiducial model adopted in our previous works since it provides a good match to a wide set of galactic properties (see Menci et al. 2006, 2008). Instead, a robust feature of the is constituted by the behaviour of the scatter, which is almost independent of the model parameters and even on the specific mechanism assumed to trigger the AGN feeding. In fact, its decrease with increasing is typical of hierarchical scenarios, and it is due to the early assembly of progenitors into a unique main progenitor which characterizes the merging histories of massive objects formed in biased, high density environments (see Menci et al. 2008).
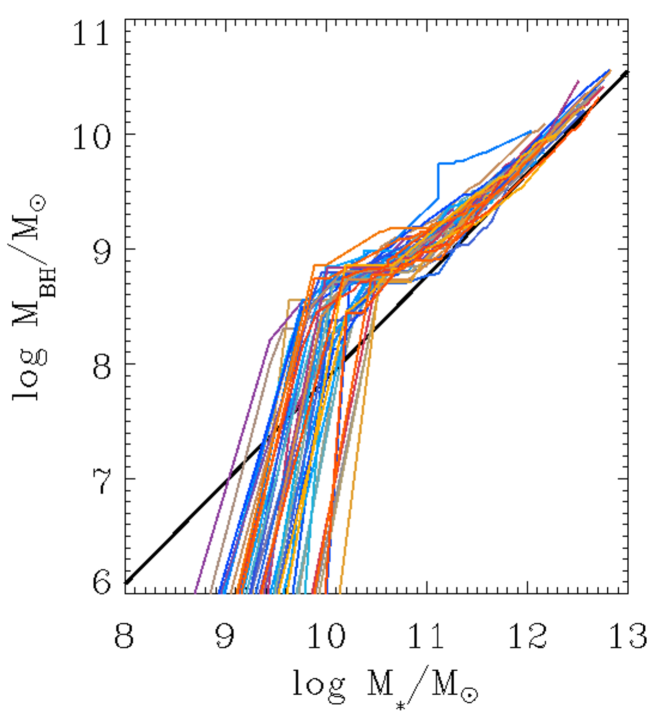
Note that the relation is predicted to evolve with as shown by the central panel of fig. 1, with the massive end of the distribution reaching the region corresponding to the observations of luminous, broad-line AGNs at (see Appendix A for details on the data). A typical prediction of our interaction-driven model is that the evolution of the relation increases for increasing stellar or BH mass; indeed, while low-mass BHs in model galaxies at high redshifts are characterized by ratios close to their local values (at least for the majority of them), for the most massive simulated BHs the is substantially larger than the model local values. We can quantify the evolution of the in our model through the quantity defined in Sect. 1 (eq. 1); since our model predicts a whole distribution of local for each stellar mass (not just a simple power-law, as is generally adopted to fit the local data), we compute as the deviation of the ratio of each model black hole from its own local value. Then for galactic hosts with stellar mass the BH masses at are typically (see central panel of fig. 1), more massive than the predicted local value by a factor 5. These objects constitute the progenitors of the local extremely massive BHs, and their growth with time is represented by the paths shown in the right panel of fig. 1. Note how such paths are characterized by an assembly of BH masses extremely rapid in the early phases, which is faster than the stellar mass growth since they approach their final position in the plane passing above the local relation.
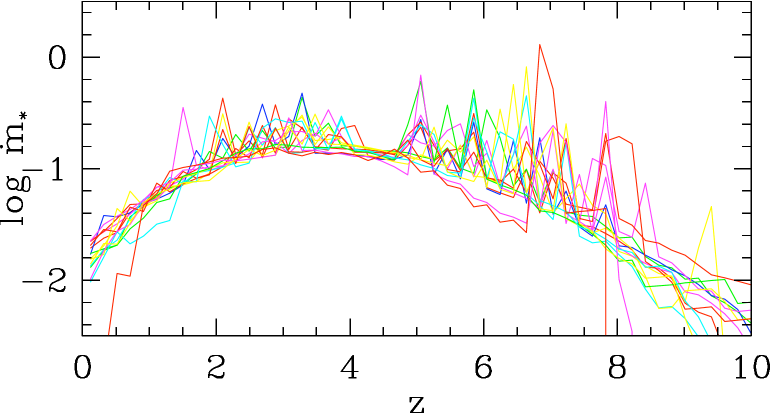
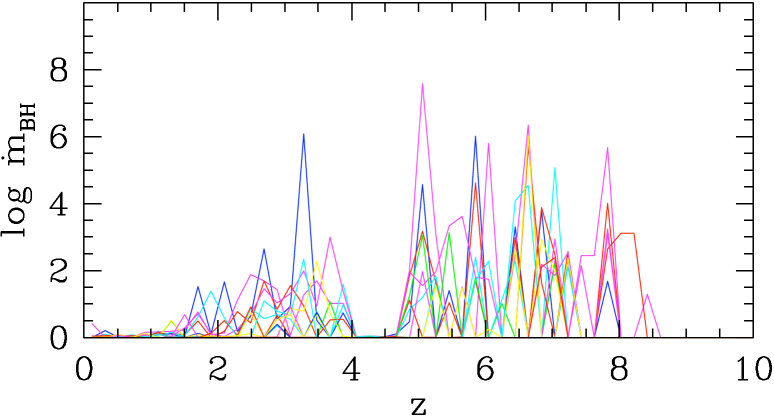
The physical origin of the above behaviour can be understood as follows: such high-redshift massive BHs (the counterpart of those observed by Walter et al. 2004; Maiolino et al. 2007; Riechers et al. 2008) are formed from galaxies collapsed in biased, high-density regions of the primordial density field where the collapse and growth of galactic hosts is accelerated. The star formation and BH accretion histories of such objects are shown in fig. 2, and can be schematically divided in two phases.
At high redshifts , the rapid interactions characterizing the dense environment of such galaxies are effective in rapidly destabilizing the galactic gas and in feeding the central BHs. In fact, in such environments and cosmic times, both the interaction rate in eq. (2) and the fraction of destabilized gas (eq. 3) are large; the first, due to the large densities, and the second due to the large ratio (i.e., a mass of the merging partner close to the mass of the main progenitor) characteristic of this early phase () when galaxy interactions mainly involve partners with comparable mass. The frequent starbursts in star formation and the corresponding episodes of BH mass accretion at this early cosmic times are shown in fig. 2.
At lower , the decline of the interaction rate and of the destabilized fraction suppresses the growth of BHs which in our model is only due to galaxy interactions (see the drop in the BH accretion episodes in the bottom panel of fig. 2), while quiescent star formation still proceeds, as is shown by the smooth component in the star formation histories in the top panel of fig. 2. The latter, quiescent component of star formation continues to build up stellar mass at (though at a milder rate), thus lowering the ratio. The overall result is that, when the ratio is normalized to the final local value, the excess increases with redshift.
Note that the above result is the outcome of two physical processes: 1) the approximatively two-phase growth of cosmic structures (with major merging at high redshifts and accretion of small clumps at low ) characteristic of hierarchical scenarios, as noted by several authors (e.g., Zhao, Jing & Börner 2003; Diemand, Kuhlen & Madau 2007; Hoffman et al. 2007; Ascasibar & Gottloeber 2008); 2) the interaction-driven scenario for the triggering of AGN activity.
In the above picture, we expect the paths with to dominate the growth histories of massive objects, formed in biased regions of the density field where high-redshift interactions are extremely effective, while we expect the high-redshift values of to progressively lower when galaxies formed in less dense environment (and hence with a lower mass on average at any given ) are considered, due to the progressively lower efficiency of interactions in triggering BH accretion at high-. Indeed, the dependence of the above effect on BH mass and on redshift constitutes a typical signature of the above interaction-driven model for the growth of BHs in galaxies.
4 Results: The Evolution of for Different AGN Populations
4.1 The Early BH Growth and High-redshift QSO
An efficient way to test the above scenario is to investigate how the paths followed by BHs and by their host galaxies to reach the local relation depend on their properties (mass, gas fraction, star formation rate), and to compare such specific predictions with the corresponding available observations for which we will use the mean local value of the ratio obtained from the Häring & Rix (2004) sample to calculate . We shall devote to this the next subsections.
To explore in detail the growth of BHs in galaxies with different properties, we start with the most extreme objects, namely, the massive BH already in place at high redshifts.
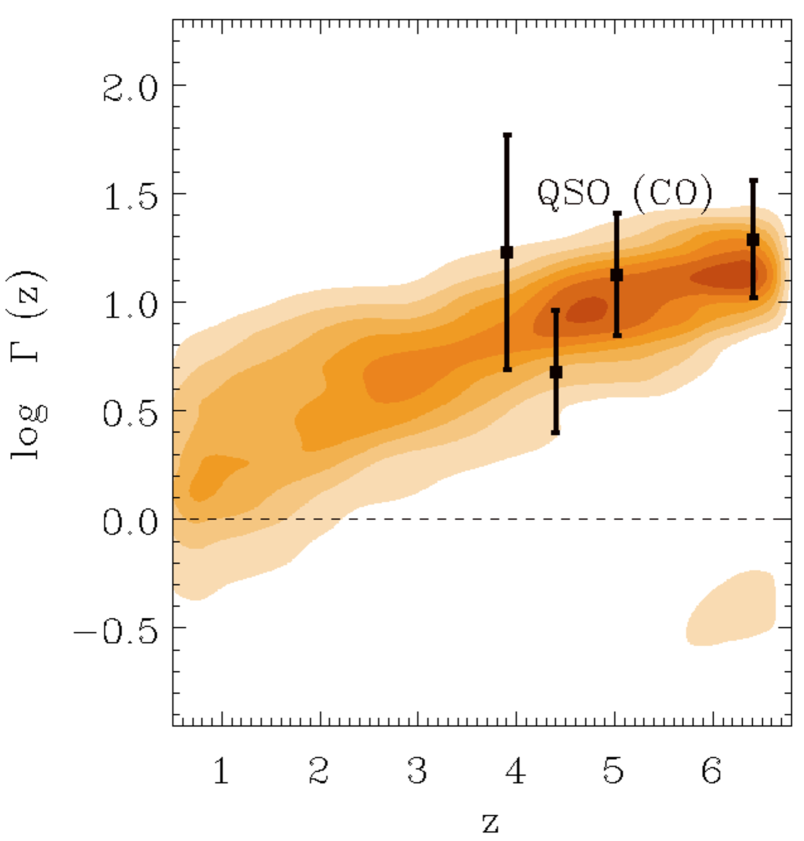
The time evolution of the ratio of such extreme objects is shown in fig. 3 in terms of the excess over their local value for model BHs with masses at . For such objects holds at any time between and the present, with holding at at . These values are consistent with the observations of luminous QSO at 3.66.4 (see Appendix A).
4.2 The BH growth at Intermediate-redshift and BL AGNs
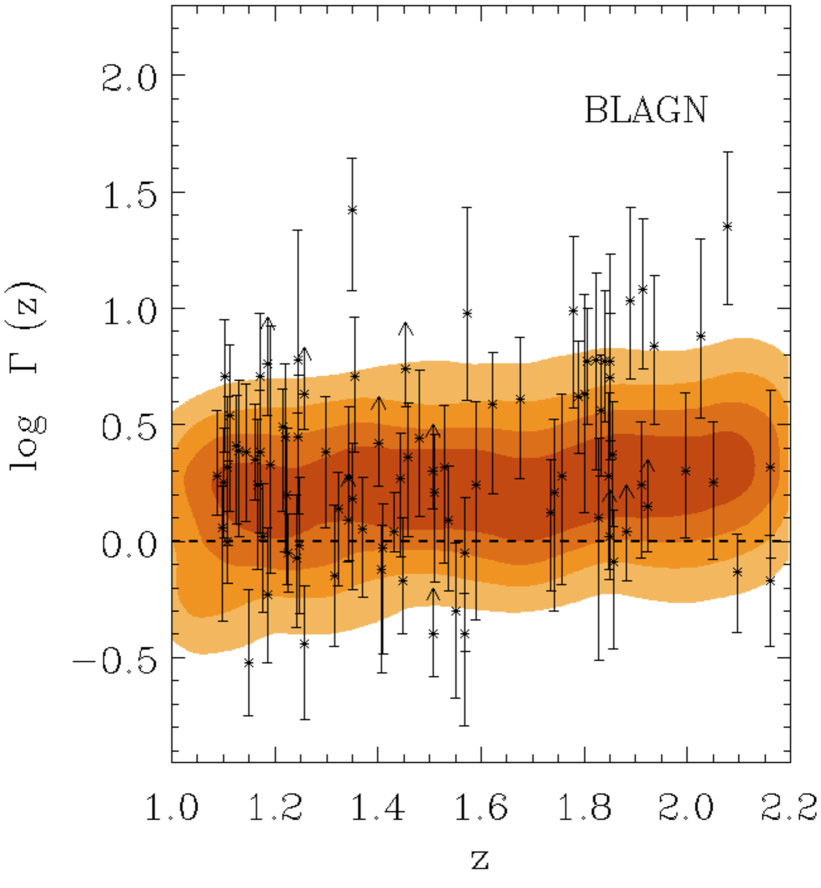
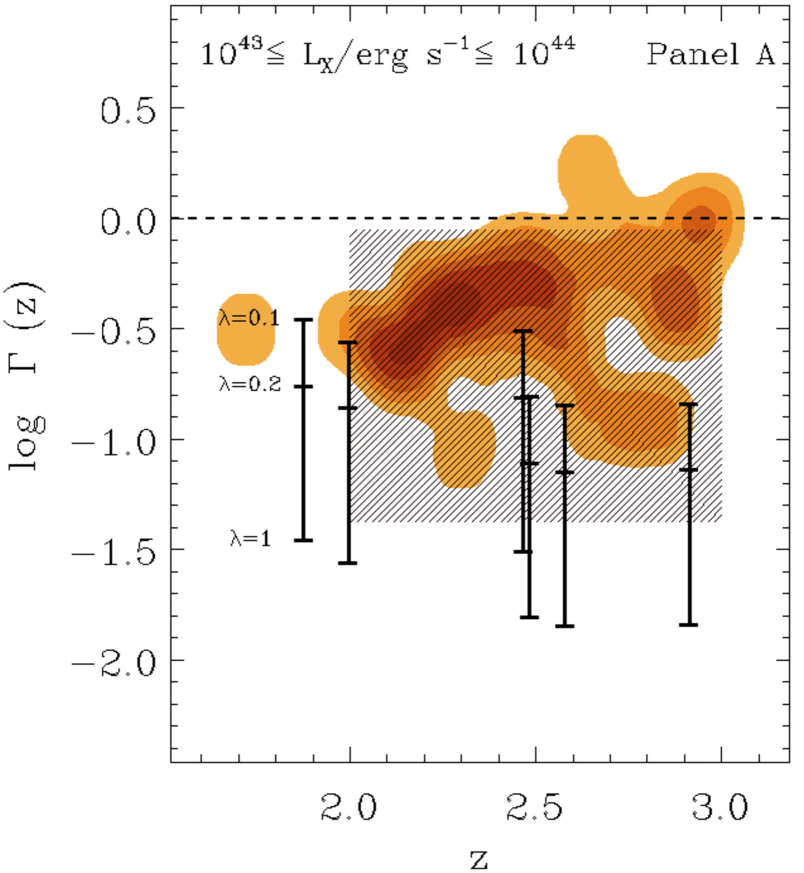
Now, we focus on BL AGNs at intermediate redshift and AGN bolometric luminosity erg/s, for which the model results can be compared with detailed existing observations. Such objects are expected to form in less biased regions of the primordial density field compared to the class of high-redshift QSO discussed in the previous section; in fact, they have a comparable AGN luminosity but are found at a lower redshifts, and thus are expected to originate from merging histories characterized by a lower rate of high-redshift encounters. Therefore, according to our picture discussed at the end of Sect. 3, we expect such objects to show a lower excess . This is indeed the case, as illustrated in fig. 4, where we compare the model predictions with observations by Merloni et al. (2009).
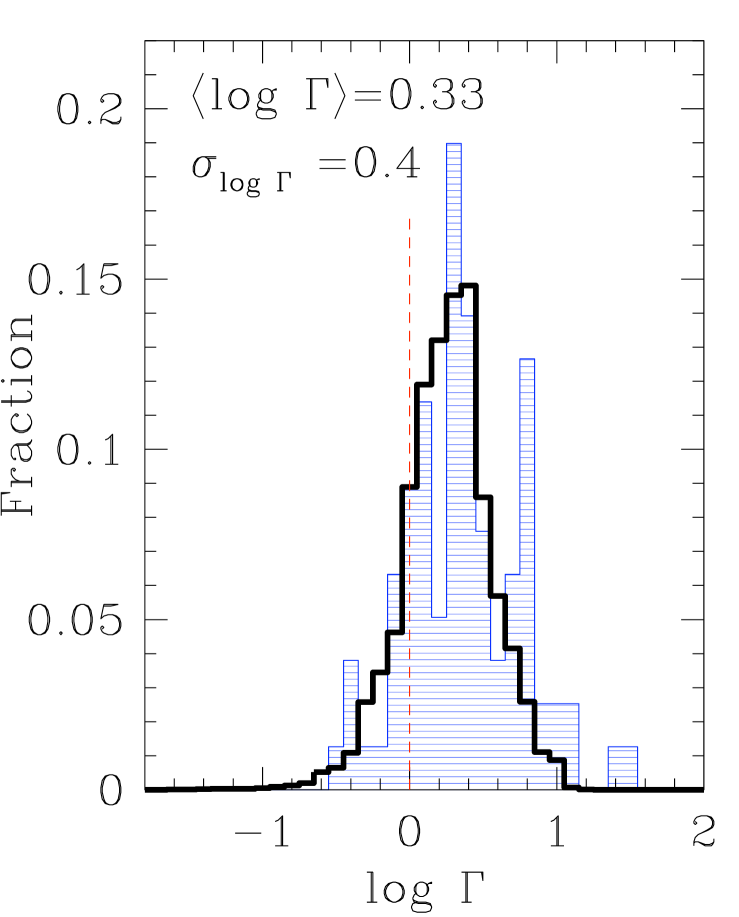
The distribution of for such intermediate objects is still dominated by at any refdshift; the model predicts typical values , smaller than those attained by the high-redshift QSO shown in fig. 3, and consistent with the observational range. Besides providing an average close to the observational value, it is interesting to note how the model predicts a scatter in remarkable agreement with the observed distribution (see right panel in fig. 4). This indeed constitute an extremely important test for models based on the hierarchical scenarios, since the scatter is directly related by the spread in the merging histories of the host galaxies, a specific prediction of these models which cannot be tuned though adjustable free parameters.
Note that the model predictions shown in fig. 4 refer to all AGNs in the redshift and luminosity ranges specified above, while the data we compare with include only unobscured objects. However, in our model the obscuration properties of AGNs depend only on the amount of gas swept by the blast wave originated by the AGN at the time of observation (see Sect. 2.3), i.e., on the detailed hydrodynamic of the interstellar medium during the last, short ( yrs) AGN active phase. Since the ratios of model BHs basically depend on the integrated, past history of the simulated BHs and host galaxies, we expect distribution of for obscured and unobscured AGNs to be similar. While we cannot perform an exact investigation of this issue (we do not model the nuclear obscuration of AGNs), a first-order estimate of the effect of selecting only obscured objects can be performed by considering in our model only AGNs hosted in galaxies with high gas surface densities pc-2: even in this case the mean value of in the distribution in fig. 4 is only decreased by a factor , leaving the scatter unchanged.
4.3 The Growth of Black Holes in Gas-Rich Galaxies: Comparison with Submillimiter Emitting Galaxies
In our model, a completely different set of BH accretion histories is that corresponding to AGNs in sub-mm galaxies (SMGs). Their large gas fractions ( relative to the total baryonic mass) and star formation rate ( /yr, see Introduction) indicate that these galaxies originate from merging histories characterized by less prominent high-redshft () starbursts and BH accretion episodes, so that a large fraction of gas is left available at lower redshifts . To compute quantitatively the predicted and for such galaxies and to compare with existing observations, we selected from our Monte Carlo simulations galaxies with i) gas fractions , ii) star formation rates /yr; iii) AGNs with X-ray luminosities , where and have been chosen as to match the selection criteria adopted for the observations we compare with (Borys et al. 2005; Alexander et al. 2008); the X-ray luminosities (in the band keV) have been computed from the bolometric luminosities in eq. (4) adopting the bolometric correction by Marconi et al. (2004).
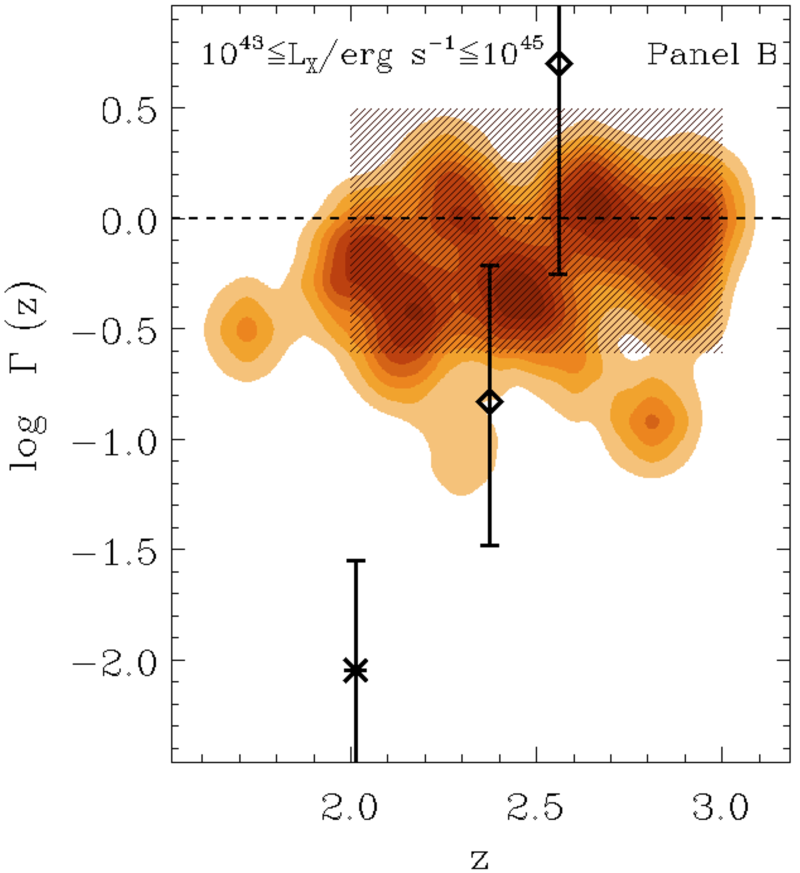
The resulting predicted distribution of the ratio are shown in figs. 5a and 5b for SMG with AGN luminosity in two different ranges (see caption) as to compare with the estimates of six X-ray obscured and three broad line (BL) SMGs for which individual estimates of MBH and M∗ were available in the literature (see the Appendix B for details on the adopted data). Although the comparison with observations results are still indicative (due to the large uncertainties associated with the Eddington ratios and with the measurements of both the BH and the stellar mass, see Appendix B), the model predicts for bulk of the SMG population values of , due to the slower growth of BHs at high redshifts. This is due to the particular merging histories corresponding to our selection criteria; large residual gas fractions at imply less frequent high-redshift encounters at and less effective bursts and BH accretion episodes at these early epochs. Since in our model the high-redshift interactions are the only trigger for early BH growth, this results in lower values of at later times (). Such results do not depend on the details of the selection criteria i)-ii) that we adopted to extract SMG-like galaxies from our Monte Carlo simulations. Indeed, we have verified that adopting different thresholds for the gas fractions () and star formation rates (up to 400 /yr) the fraction of galaxies with 1 is always dominant.
It must be noted that the observed SMG at =2 in the right panel of fig. 5 has a value much lower than that predicted by the model at the same redshift. In view of the unavoidable uncertainties affecting the present observational data (discussed in Appendix B), it will be important to confirm the reliability and the statistical significance of such a data point as a marker of the unobscured AGNs in SMGs, since it would constitute a severe test for our model which predicts a basically similar behaviour of for obscured and unobscured AGNs. On the other hand, the predicted distribution of for SMG-like galaxies shows a mild dependence with the AGN luminosity, being larger for luminous AGN. Although the uncertainties in present data do not allow yet to make precise comparisons, this trend constitutes a model prediction which is at least consistent with estimates of based on average values for and in SMG galaxies (see the shaded area).
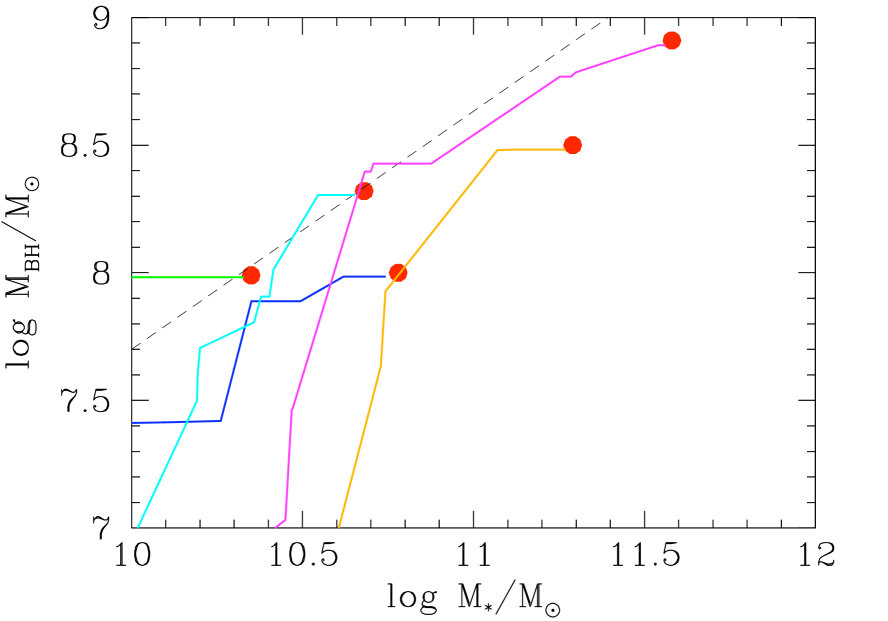
An interesting feature of our interaction-driven model for BH accretion is that the SMGs produced by the model end up in low-redshift descendants which lie below the local relation as shown in fig. 6. In other words, the low-redshift ( ) descendants of SMGs are predicted to have BHs with low-intermediate masses (see fig. 6), and the BHs in SMG-like galaxies at are in an active growing phase, as it is shown in fig. 6 by their steeply rising paths in the plane. Conversely, we computed that a fraction of local galaxies with BH masses in the range had a progenitor which passed through an SMG-phase at some redshift in the range .
Such a picture is in agreement with the independent findings of Alexander et al. (2008), based on the larger number density of SMGs compared to that of local galaxies hosting BHs with masses exceeding . To check for the full consistency of our results and of our interpretation with the observations of SMGs, we have compared the number densities of the model SMG galaxies with the number densities 2.510-5Mpc-3 measured by Swinbank et al. (2006) based on the redshift distribution obtained by Chapman et al. (2005) for =1-3.5 SMGs with S 5mJy. To perform such a comparison we first converted the above flux limit in terms of star formation rate (using the relations in Swinbank et al. 2008), since our semi-analytic model does not include the sub-mm emission from dust; for the model SMG galaxies above the resulting threshold in star formation rate the predicted number density in the same redshift interval is 10-5Mpc-3 when SMGs with are considered, and 10-5Mpc-3 for SMGs with , fully consistent with the observational estimates.
5 Discussion
5.1 The growth of BHs for different AGN populations
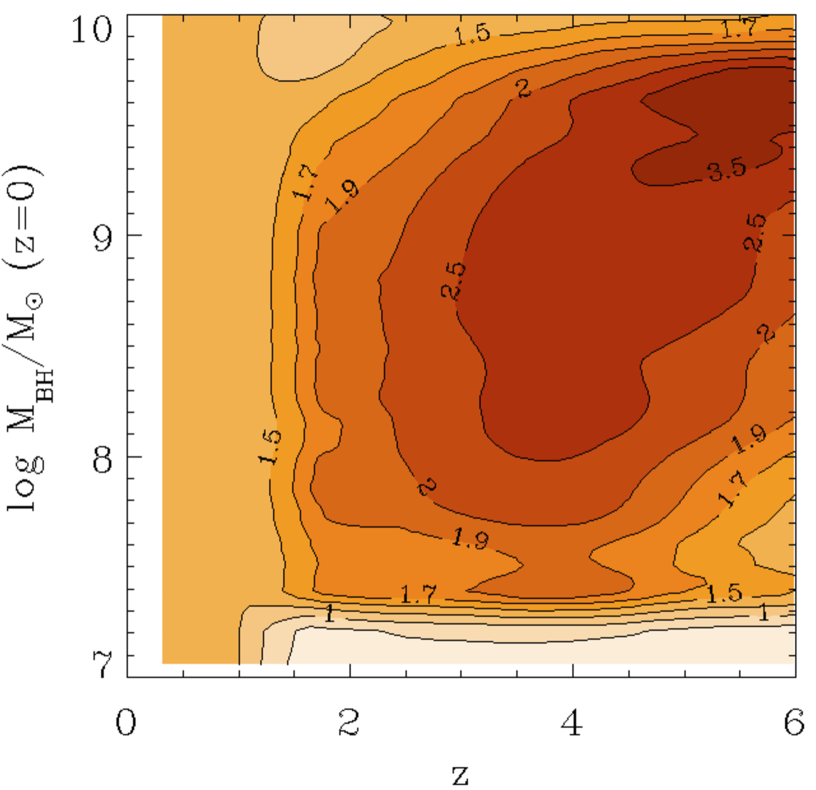
The results presented in the previous sections lead to the following global picture of our cosmological, interaction-driven model for the BH accretion. The relative growth speed of SMBHs compared to the stellar mass is characterized by a large spread in the galaxy population, with an overall trend for a faster BH growth compared to galaxies at high redshifts ; this is basically due to the fact that BH grow only when interactions are effective, i.e., at high redshifts , while star formation proceeds not only through impulsive bursts (at high redshifts) but also through quiescent star formation which continues to build up stellar mass at , though at a lower rate (see fig. 2a). In terms of the ratio such a global behaviour is represented by fig. 7, where the distribution of is shown by the coloured contours as a function of redshift for the entire (i.e., for all galaxies containing BH with masses ). A striking feature of such a distribution is the modest increase of for as opposed to its rapid upturn at higher redshifts ; such a mild increase of the global at low-intermediate redshifts is in agreement with that derived by Merloni et al. (2004) and Hopkins et al. (2006) by comparing the observed integrated BH and stellar mass densities at such redshifts.
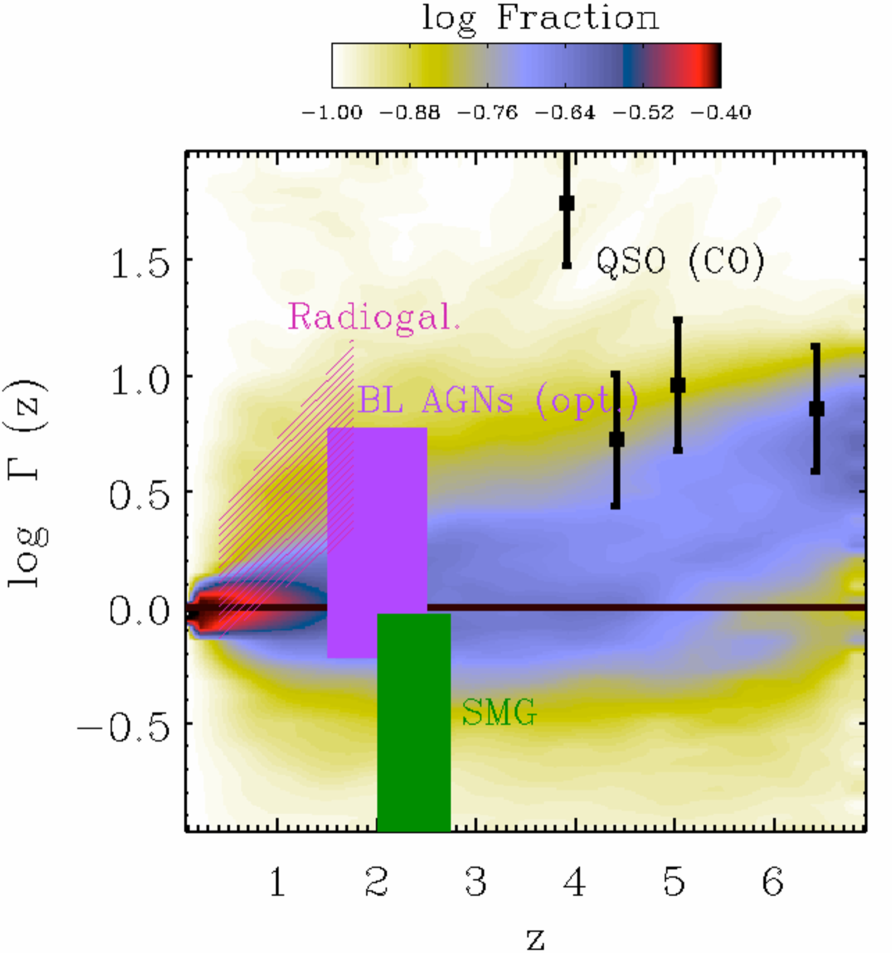
Note that the overall predicted trend for larger values of with increasing redshift is associated to an increasing the spread in the distribution. This constitutes a quantitative prediction for the -dependence of the Lauer et al. (2007) bias. In this respect, the distributions shown in fig. 3, 4, and 5 can be interpreted as a quantitative evaluation of the incidence of such a bias in differently selected samples at different redshifts. In fact, fig. 7 shows that the different observations we compared with in the previous Sections are not fully representative of the global behaviour since they refer to specific populations selected according to different criteria which sample only a portion (in the case of SMG actually a minor fraction) of the whole galaxy population.
5.2 Model predictions and downsizing
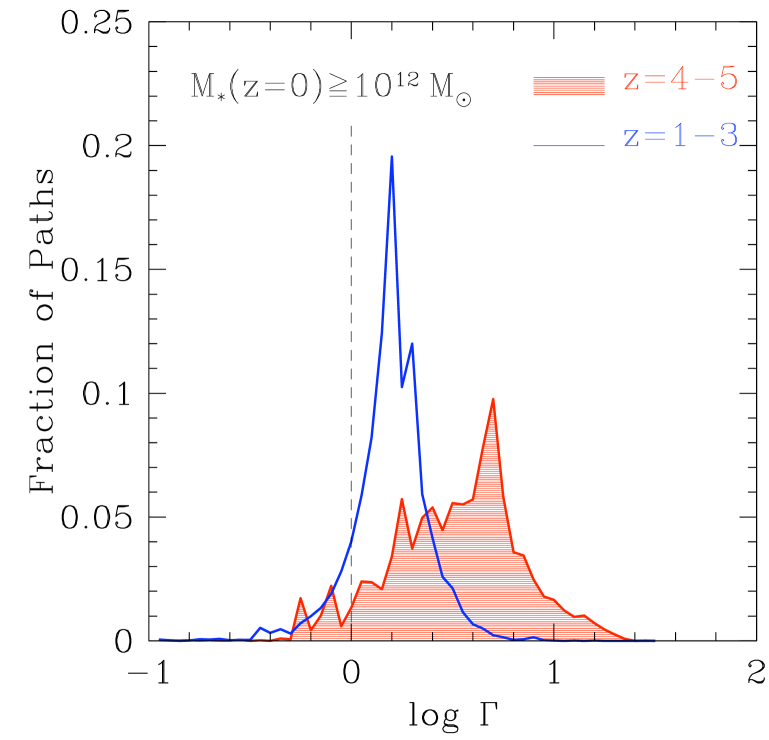
A major result of our previous sections is that the evolution of is a strong function of the BH mass. Such a strong mass dependence of is illustrated by fig. 8 (left panel), where we show with the contours the average values as a function of the final (z=0) BH mass (represented in the y-axis) and of redshift; the average runs over all paths leading to the final BH mass (and hence over all the possible main progenitors at a given redshift). The figure illustrates that indeed for massive objects at high redshifts large values of are expected, since such BH form in the most biased regions of the density field where high-redshift interactions were favoured; values of are also natural for BH at intermediate redshifts , while the low values of observed in SMG at are not representative of the whole AGN population at such redhifts (the average represented in fig. 8 is ), but instead only apply to a population originated by peculiar star formation histories (see section 4.3).
An immediate implication of the above is that massive local galaxies and their BHs have formed preferentially through paths (in the plane) passing above the local relation; this is illustrated in fig. 8 (right panel) where we show the fraction of paths characterized by a given (in two redshift bins) leading to local galaxies with mass . The paths with dominate the statistics not only at high-redshift but also -though to a lower extent- at . As a consequence, in the merging-driven scenario SMGs do not represent typical paths leading to local massive galaxies, but rather correspond to peculiar paths in the tail of the distribution, namely those selected as to lead to gas-rich galaxies at ; this interpretation is supported by the consistency of the predicted number density of such peculiar paths with the observed number densities of SMGs, shown and discussed at the end of sect. 4.3.
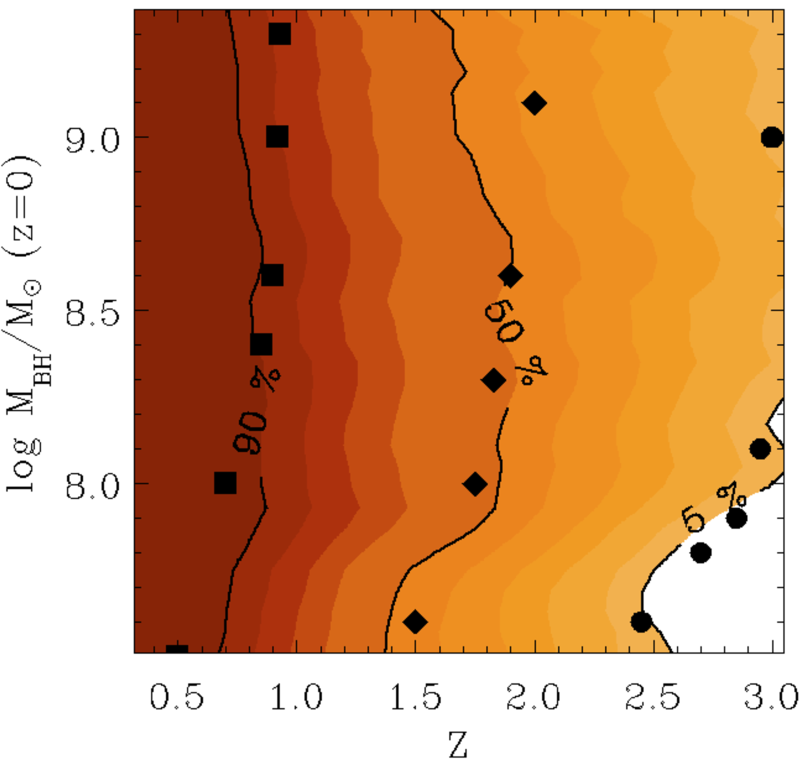
The above mass dependence of has straightforward implications for the so-called AGN downsizing, i.e., the faster building-up of luminous AGNs compared with those with lower luminosities which is indicated by observations (see, e.g., Marconi et al. 2004); such a downsizing effect is also characterizing the faster drop (2.5 dex) from to the present of luminous ( erg/s) AGNs compared to the low-luminosity population ( erg/s), which is observed to follow only a gradual decrease (less than 1 dex in the number density) from to (see, e.g., Fiore et al. 2003; Hasinger , Miyaji & Schmidt 2005; La Franca et al. 2005). In fact, the mass dependence of represented in fig. 8 implies that the massive BH actually grow faster than the low-mass BHs. This is illustrated by fig. 9 (left panel), where the contours represent the fraction of BH mass formed at a given redshift (in the x-axis), for different values of the BH final mass in our model; any given fraction of the final mass is assembled at lower redshift for the less massive objects with with respect to more massive objects. We also reproduce as a sequence of points a similar contour plot produced by Marconi et al. (2004) based on the observed mass and luminosity evolution of AGNs, under the assumption of fixed Eddington ratio , and that galaxy merging does not affect the growth of SMBHs; although both assumptions not hold in our model, it is interesting to note that the representation of downsizing naturally arising from the interaction-driven model resembles that extrapolated from observations.
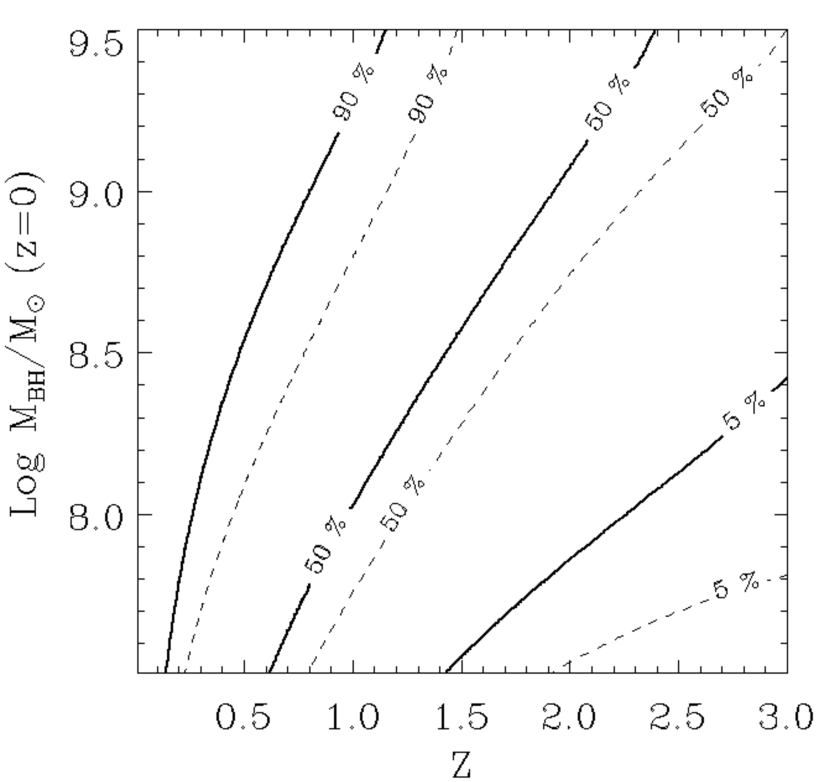
The general observed trend of larger assembled fraction for increasingly massive BH is quite well accounted for by our interaction-driven model, although the model seems to show a bending in correspondence of the 50% contour level at for masses above which is not present in the data; this might constitute a true model inadequacy, or simply result from the simple assumptions of constant adopted in the derivation of the data points by Marconi et al. (2004) from the analysis of the local BH mass function and of the evolution of the AGN luminosity functions. To clarify this issue we reproduce in fig. 9b the results from an improved version (Merloni 2009, in prep.) of the Merloni & Heinz (2008) analysis, based on updated AGN luminosity functions. Such an analysis is similar in methodology to that by Marconi et al. (2004), but avoids the assumption by deriving phenomenological, physically motivated relations between the accretion rate, the BH mass and the AGN luminosity, and solving for a continuity equation for the SMBH mass function evolution. Beyond the details concerning the exact values of the assembled mass fraction derived from the observed luminosity functions (which is still largely affected by uncertainties, as shown by the differences among the results obtained under different assumptions, see caption to fig. 9), the comparison with the Merloni & Heinz (2008) approach shows i) that the BH growth inferred from the evolution of the AGN luminosity functions generally yields a stronger downsizing effect at large masses compared with our model, and ii) that such an effect is probably not due to the assumptions on adopted to derive the BH growth histories from the observed luminosity functions. Thus, the discrepancy is likely to be due to the assumption (common to all the approaches based on the observed luminosity functions) that the BH growth is always dominated by accretion, and that the BH growth due to merging is negligible at any .
This conclusion is not unexpected when one considers the basic features of the hierarchical clustering picture. Indeed, in all approached based on hierarchical scenarios, the merging sector of the models predicts massive objects to form later; such a trend is inverted when one consider how and when baryons are converted into stars or accreted into SMBHs. The overall downsizing effect in hierarchical models thus results from the balance between the two effects above; the downsizing trend resulting at low-intermediate masses in our model means that accretion largely dominates over merging up to very large final BH masses .
While the comparison performed in Fig. 9 is just a first step toward a detailed observational testing of the downsizing properties of cosmological models for the growth of SMBHs, the global picture emerging from the interaction-driven model for the growth of SMBHs seems to consistently account for a wide set of independent observations concerning the growth of SMBHs; these range from the distant QSOs, to the intermediate- BL AGNs, to the extreme population constituted by the SMGs at 2, to the average growth histories estimated from the observed luminosity functions, extending over a wide range of redshifts and of BH masses .
6 Conclusions
We have investigated the growth of SMBHs relative to the stellar content of the host galaxy in the framework of an interaction-driven model for the feeding of BHs during the merging history of the host galaxies. Both the star formation and the BH accretion (i.e., the conversion of baryons from galactic gas into stars or into BHs) are ultimately determined by the histories of the host galaxy potential wells, strongly dependent on their total DM mass as predicted by galaxy formation models in a cosmological context. To test such a model against observations, we worked out specific predictions for sub samples of the simulated galaxy population corresponding to different observational samples for which observational estimates of black hole masses and stellar masses were available. Specifically, for the evolution of the ratio we found that: Massive local galaxies () and their BHs have formed preferentially through paths (in the plane) passing above the local relation. The average value and the spread of increase over the local value for increasing redshift (see fig. 7) . Such an increase is larger for massive BH (fig. 8), originating from biased overdense regions of the primordial density field. This constitutes a specific prediction of the interaction-driven models for the growth of SMBHs, since it is due to the effectiveness of interactions in triggering BH accretion in high-density environments at high redshifts . In our model, the galaxy interactions constitute the only trigger for the BH growth, while star formation can proceed in a quiescent model at lower redshifts even in the absence of starbursts. Therefore, at high redshifts interactions rapidly trigger the accretion of BHs and the impulsive star formation, while at lower redshifts the interaction rate drops, and only star formation can proceed in the quiescent model, leading to a decrease of . The larger is the galaxy and BH mass, the faster is the gas conversion into stars and the BH growth at high redshift, the stronger the decline of at low . Due to the above physical mechanism, extremely massive BHs in high redshift QSOs at are predicted to have typical values of (see fig. 3), consistently with observational estimates (e.g., Willott et al. 2003; McLure & Dunlop 2004; Vestergaard et al. 2004, Walter et al. 2004; Maiolino et al. 2007; Riechers et al. 2008); this corresponds to BHs growing faster than their host galaxy stellar mass in massive galaxies at high redshifts. At lower , lower mass BH hosted in luminous BL AGNs are predicted to have lower values of (see fig.4). A direct implication of this is that AGN feedback begins to affect the galaxy properies already at high redshifts . In such a framework, SMG galaxies correspond to the rare merging histories leading to i) a large fraction of gas available for impulsive star formation at , ii) major merging events at such redshifts. These peculiar merging histories are characterized by lower interaction rates at high redshifts, which otherwise would have exhausted the galactic cold gas reservoirs; in turn, this corresponds to lower values of for such objects (fig. 5), which are predicted to be building up a substantial fraction of their final BH mass at such redshifts . In addition, this objects are predicted to end up their evolution as low-to-intermediate mass BHs with (fig. 6); such a prediction is in agreement with the independent findings of Alexander et al. (2008), based on the large number density of SMGs which is larger than that of local galaxies hosting BHs with masses exceeding ; in fact, the observed SMG density is consistent with the model predictions, as shown in Sect. 4.3.
The above comparison with observations probe the model in different range of masses and redshifts. The global picture emerging from the model (see Discussion in Sect. 5) is consistent with a downsizing scenario, where massive BHs accrete a larger fraction of their final mass at high redshifts ; this is a natural outcome of cosmological interaction-driven model for the growth of BHs, due to the larger effectiveness of interactions in high-density environments, which constitute the density regions where massive objects form. Note that this is entirely consistent with the hierarchical building up of cosmic structures, since the number density of such massive objects is however increasing with time.
Acknowledgments
We thank A. Marconi for useful discussions and for his help in correcting the observed BH masses for the effect of radiation pressure. We acknowledge grants from ASI-INAF I/016/07/0.
References
- Alexander et al. (2005) Alexander D. M., Smail I., Bauer F. E., Chapman S. C., Blain A. W., Brandt W. N., Ivison R. J., 2005, Nature, 434, 738
- Alexander et al. (2008) Alexander D. M., Brandt W. N., Smail I., Swinbank A. M., Bauer F. E., Blain A. W., Chapman S. C., Coppin K. E. K., Ivison R. J., Menéndez-Delmestre K., 2008, AJ, 135, 1968
- Ascasibar & Gottlöber (2008) Ascasibar Y., Gottlöber S., 2008, MNRAS, 386, 2022
- Barth et al. (2003) Barth A. J., Martini P., Nelson C. H., Ho L. C., 2003, ApJ, 594, L95
- Begelman (2004) Begelman M. C., 2004, in L. C. Ho ed., Coevolution of Black Holes and Galaxies AGN Feedback Mechanisms. pp 374–+
- Bond et al. (1991) Bond J. R., Cole S., Efstathiou G., Kaiser N., 1991, ApJ, 379, 440
- Borys et al. (2005) Borys C., Smail I., Chapman S. C., Blain A. W., Alexander D. M., Ivison R. J., 2005, ApJ, 635, 853
- Bower et al. (2006) Bower R. G., Benson A. J., Malbon R., Helly J. C., Frenk C. S., Baugh C. M., Cole S., Lacey C. G., 2006, MNRAS, 370, 645
- Cappellari et al. (2006) Cappellari M., Bacon R., Bureau M., Damen M. C., Davies R. L., de Zeeuw P. T., Emsellem E., Falcón-Barroso J., Krajnović D., Kuntschner H., McDermid R. M., Peletier R. F., Sarzi M., van den Bosch R. C. E., van de Ven G., 2006, MNRAS, 366, 1126
- Carilli & Wang (2006) Carilli C. L., Wang R., 2006, AJ, 131, 2763
- Cavaliere & Vittorini (2000) Cavaliere A., Vittorini V., 2000, ApJ, 543, 599
- Chapman et al. (2005) Chapman S. C., Blain A. W., Smail I., Ivison R. J., 2005, ApJ, 622, 772
- Chartas et al. (2002) Chartas G., Brandt W. N., Gallagher S. C., Garmire G. P., 2002, ApJ, 579, 169
- Coppin et al. (2008) Coppin K. E. K., Swinbank A. M., Neri R., Cox P., Alexander D. M., Smail I., Page M. J., Stevens J. A., Knudsen K. K., Ivison R. J., Beelen A., Bertoldi F., Omont A., 2008, MNRAS, 389, 45
- Crenshaw et al. (2003) Crenshaw D. M., Kraemer S. B., George I. M., 2003, ARA&A, 41, 117
- Croton et al. (2006) Croton D. J., Springel V., White S. D. M., De Lucia G., Frenk C. S., Gao L., Jenkins A., Kauffmann G., Navarro J. F., Yoshida N., 2006, MNRAS, 365, 11
- Di Matteo et al. (2005) Di Matteo T., Springel V., Hernquist L., 2005, Nature, 433, 604
- Diemand et al. (2007) Diemand J., Kuhlen M., Madau P., 2007, ApJ, 667, 859
- Dietrich & Hamann (2004) Dietrich M., Hamann F., 2004, ApJ, 611, 761
- Egami et al. (2000) Egami E., Neugebauer G., Soifer B. T., Matthews K., Ressler M., Becklin E. E., Murphy Jr. T. W., Dale D. A., 2000, ApJ, 535, 561
- Fabian (1999) Fabian A. C., 1999, MNRAS, 308, L39
- Ferrarese & Merritt (2000) Ferrarese L., Merritt D., 2000, ApJ, 539, L9
- Fiore et al. (2003) Fiore F., Brusa M., Cocchia F., Baldi A., Carangelo N., Ciliegi P., Comastri A., La Franca F., Maiolino R., Matt G., Molendi S., Mignoli M., Perola G. C., Severgnini P., Vignali C., 2003, A&A, 409, 79
- Gebhardt et al. (2000) Gebhardt K., Bender R., Bower G., Dressler A., Faber S. M., Filippenko A. V., Green R., Grillmair C., Ho L. C., Kormendy J., Lauer T. R., Magorrian J., Pinkney J., Richstone D., Tremaine S., 2000, ApJ, 539, L13
- Granato et al. (2004) Granato G. L., De Zotti G., Silva L., Bressan A., Danese L., 2004, ApJ, 600, 580
- Greene & Ho (2005) Greene J. E., Ho L. C., 2005, ApJ, 630, 122
- Greve et al. (2005) Greve T. R., Bertoldi F., Smail I., Neri R., Chapman S. C., Blain A. W., Ivison R. J., Genzel R., Omont A., Cox P., Tacconi L., Kneib J.-P., 2005, MNRAS, 359, 1165
- Häring & Rix (2004) Häring N., Rix H.-W., 2004, ApJ, 604, L89
- Hasinger et al. (2005) Hasinger G., Miyaji T., Schmidt M., 2005, A&A, 441, 417
- Ho (1999) Ho L., 1999, in S. K. Chakrabarti ed., Observational Evidence for the Black Holes in the Universe Vol. 234 of Astrophysics and Space Science Library, Supermassive Black Holes in Galactic Nuclei: Observational Evidence and Astrophysical Consequences. pp 157–+
- Hoffman et al. (2007) Hoffman Y., Romano-Díaz E., Shlosman I., Heller C., 2007, ApJ, 671, 1108
- Hopkins et al. (2005) Hopkins P. F., Hernquist L., Cox T. J., Di Matteo T., Robertson B., Springel V., 2005, ApJ, 632, 81
- Hopkins et al. (2006) Hopkins P. F., Hernquist L., Cox T. J., Di Matteo T., Robertson B., Springel V., 2006, ApJS, 163, 1
- Ibata et al. (1999) Ibata R. A., Lewis G. F., Irwin M. J., Lehár J., Totten E. J., 1999, AJ, 118, 1922
- Kaspi et al. (2000) Kaspi S., Smith P. S., Netzer H., Maoz D., Jannuzi B. T., Giveon U., 2000, ApJ, 533, 631
- Kauffmann & Haehnelt (2000) Kauffmann G., Haehnelt M., 2000, MNRAS, 311, 576
- Kormendy & Bender (2009) Kormendy J., Bender R., 2009, ApJ, 691, L142
- Kormendy & Richstone (1995) Kormendy J., Richstone D., 1995, ARA&A, 33, 581
- La Franca et al. (2005) La Franca F., Fiore F., Comastri A., Perola G. C., Sacchi N., Brusa M., Cocchia F., Feruglio C., Matt G., Vignali C., Carangelo N., Ciliegi P., Lamastra A., Maiolino R., Mignoli M., Molendi S., Puccetti S., 2005, ApJ, 635, 864
- Lacey & Cole (1993) Lacey C., Cole S., 1993, MNRAS, 262, 627
- Lauer et al. (2007) Lauer T. R., Tremaine S., Richstone D., Faber S. M., 2007, ApJ, 670, 249
- Lewis et al. (2002) Lewis G. F., Carilli C., Papadopoulos P., Ivison R. J., 2002, MNRAS, 330, L15
- Madau & Rees (2001) Madau P., Rees M. J., 2001, ApJ, 551, L27
- Magorrian et al. (1998) Magorrian J., Tremaine S., Richstone D., Bender R., Bower G., Dressler A., Faber S. M., Gebhardt K., Green R., Grillmair C., Kormendy J., Lauer T., 1998, AJ, 115, 2285
- Maiolino et al. (2007) Maiolino R., Neri R., Beelen A., Bertoldi F., Carilli C. L., Caselli P., Cox P., Menten K. M., Nagao T., Omont A., Walmsley C. M., Walter F., Weiß A., 2007, A&A, 472, L33
- Marconi et al. (2008) Marconi A., Axon D. J., Maiolino R., Nagao T., Pastorini G., Pietrini P., Robinson A., Torricelli G., 2008, ApJ, 678, 693
- Marconi & Hunt (2003) Marconi A., Hunt L. K., 2003, ApJ, 589, L21
- Marconi et al. (2004) Marconi A., Risaliti G., Gilli R., Hunt L. K., Maiolino R., Salvati M., 2004, MNRAS, 351, 169
- Marulli et al. (2008) Marulli F., Bonoli S., Branchini E., Moscardini L., Springel V., 2008, MNRAS, 385, 1846
- McLure & Dunlop (2002) McLure R. J., Dunlop J. S., 2002, MNRAS, 331, 795
- McLure & Dunlop (2004) McLure R. J., Dunlop J. S., 2004, MNRAS, 352, 1390
- McLure et al. (2006) McLure R. J., Jarvis M. J., Targett T. A., Dunlop J. S., Best P. N., 2006, MNRAS, 368, 1395
- Menci et al. (2003) Menci N., Cavaliere A., Fontana A., Giallongo E., Poli F., Vittorini V., 2003, ApJ, 587, L63
- Menci et al. (2004) Menci N., Cavaliere A., Fontana A., Giallongo E., Poli F., Vittorini V., 2004, ApJ, 604, 12
- Menci et al. (2005) Menci N., Fontana A., Giallongo E., Salimbeni S., 2005, ApJ, 632, 49
- Menci et al. (2006) Menci N., Fontana A., Giallongo E., Grazian A., Salimbeni S., 2006, ApJ, 647, 753
- Menci et al. (2008) Menci N., Fiore F., Puccetti S., Cavaliere A., 2008, ApJ, 686, 219
- Merloni & Heinz (2008) Merloni A., Heinz S., 2008, MNRAS, 388, 1011
- Merloni et al. (2004) Merloni A., Rudnick G., Di Matteo T., 2004, MNRAS, 354, L37
- (60) Merloni A., et al., 2009, submitted
- Monaco et al. (2000) Monaco P., Salucci P., Danese L., 2000, MNRAS, 311, 279
- Muñoz et al. (2001) Muñoz J. A., Kochanek C. S., Keeton C. R., 2001, ApJ, 558, 657
- Onken et al. (2004) Onken C. A., Ferrarese L., Merritt D., Peterson B. M., Pogge R. W., Vestergaard M., Wandel A., 2004, ApJ, 615, 645
- Peng et al. (2006) Peng C. Y., Impey C. D., Rix H.-W., Kochanek C. S., Keeton C. R., Falco E. E., Lehár J., McLeod B. A., 2006, ApJ, 649, 616
- Peterson & Wandel (2000) Peterson B. M., Wandel A., 2000, ApJ, 540, L13
- Pounds et al. (2003) Pounds K. A., King A. R., Page K. L., O’Brien P. T., 2003, MNRAS, 346, 1025
- Pounds & Page (2006) Pounds K. A., Page K. L., 2006, MNRAS, 372, 1275
- Proga (2007) Proga D., 2007, ApJ, 661, 693
- Riechers et al. (2008) Riechers D. A., Walter F., Carilli C. L., Bertoldi F., Momjian E., 2008, ApJ, 686, L9
- Riechers et al. (2009) Riechers D. A., Walter F., Carilli C. L., Lewis G. F., 2009, ApJ, 690, 463
- Risaliti et al. (2005) Risaliti G., Bianchi S., Matt G., Baldi A., Elvis M., Fabbiano G., Zezas A., 2005, ApJ, 630, L129
- Saslaw (1985) Saslaw W. C., 1985, Gravitational physics of stellar and galactic systems
- Shields et al. (2006) Shields G. A., Menezes K. L., Massart C. A., Vanden Bout P., 2006, ApJ, 641, 683
- Silk & Rees (1998) Silk J., Rees M. J., 1998, A&A, 331, L1
- Soltan (1982) Soltan A., 1982, MNRAS, 200, 115
- (76) Spergel D. N., Bean R., Doré O., Nolta M. R., Bennett C. L., Dunkley J., Hinshaw G., Jarosik N., Komatsu E., Page L., Peiris H. V., Verde L., Halpern M., Hill R. S., Kogut A., Limon M., Meyer S. S., Odegard N., Tucker G. S., Weiland J. L., Wollack E., Wright E. L., 2007, ApJS, 170, 377
- Springel et al. (2005) Springel V., White S. D. M., Jenkins A., Frenk C. S., Yoshida N., Gao L., Navarro J., Thacker R., Croton D., Helly J., Peacock J. A., Cole S., Thomas P., Couchman H., Evrard A., Colberg J., Pearce F., 2005, Nature, 435, 629
- Swinbank et al. (2006) Swinbank A. M., Chapman S. C., Smail I., Lindner C., Borys C., Blain A. W., Ivison R. J., Lewis G. F., 2006, MNRAS, 371, 465
- Swinbank et al. (2008) Swinbank A. M., Lacey C. G., Smail I., Baugh C. M., Frenk C. S., Blain A. W., Chapman S. C., Coppin K. E. K., Ivison R. J., Gonzalez J. E., Hainline L. J., 2008, MNRAS, 391, 420
- Tacconi et al. (2008) Tacconi L. J., Genzel R., Smail I., Neri R., Chapman S. C., Ivison R. J., Blain A., Cox P., Omont A., Bertoldi F., Greve T., Förster Schreiber N. M., Genel S., Lutz D., Swinbank A. M., Shapley A. E., Erb D. K., Cimatti A., Daddi E., Baker A. J., 2008, ApJ, 680, 246
- Turnshek et al. (1988) Turnshek D. A., Grillmair C. J., Foltz C. B., Weymann R. J., 1988, ApJ, 325, 651
- Ueda et al. (2003) Ueda Y., Akiyama M., Ohta K., Miyaji T., 2003, ApJ, 598, 886
- Vestergaard (2004) Vestergaard M., 2004, ApJ, 601, 676
- Vestergaard & Peterson (2006) Vestergaard M., Peterson B. M., 2006, ApJ, 641, 689
- Volonteri et al. (2003) Volonteri M., Haardt F., Madau P., 2003, ApJ, 582, 559
- Walter et al. (2004) Walter F., Carilli C., Bertoldi F., Menten K., Cox P., Lo K. Y., Fan X., Strauss M. A., 2004, ApJ, 615, L17
- Wandel et al. (1999) Wandel A., Peterson B. M., Malkan M. A., 1999, ApJ, 526, 579
- Weymann et al. (1981) Weymann R. J., Carswell R. F., Smith M. G., 1981, ARA&A, 19, 41
- Willott et al. (2003) Willott C. J., McLure R. J., Jarvis M. J., 2003, ApJ, 587, L15
- Wyithe & Loeb (2003) Wyithe J. S. B., Loeb A., 2003, ApJ, 595, 614
- Yu & Tremaine (2002) Yu Q., Tremaine S., 2002, MNRAS, 335, 965
- Zhao et al. (2003) Zhao D. H., Mo H. J., Jing Y. P., Börner G., 2003, MNRAS, 339, 12
Appendix A The observed black hole–galaxy mass ratio at 3.96.4
A detailed discussion on the BH and galaxy masses in QSO at 4 will be presented in a forthcoming paper by Riechers et al. (priv. comm.).
In this appendix we obtain estimates of the BH and galaxy masses for a sample of four QSO at 4 based on informations already available in the literature.
The values at 3.9z6.4 in Figs.1, 3 and 7, were obtained from
a few quasars whose dynamical mass of the host galaxy could be inferred
by high angular resolution CO millimetric
observations. In paricular the CO kinematical
data were obtained from Walter et al. (2004), for SDSS1148+5251 at z=6.42,
from Maiolino et al. (2007), for SDSS0338+0021 at z=5.03,
from Riechers et al. (2008), for BRI1335-0417 at z=4.407, and
from Riechers et al. (2009), for APM08279+5255 at z=3.911.
Note that for SDSS0338+0021 the dynamical mass is actually only
an upper limit, since the CO emission is not resolved.
We corrected the inferred dynamical masses for an average inclination
of the molecular disc of 15∘ in agreement with the bias
inferred by Carilli & Wang (2006) for the inclination of the discs
in quasar hosts. We inferred the stellar mass by subtracting from the
dynamical mass the gas mass (as reported in the same references
reporting the CO observations) and the black hole mass discussed below.
Black hole masses were inferred for the same quasars by exploiting
virial estimators based on the width of the broad emission lines
and the continuum luminosity, calibrated on local AGNs
(e.g. Vestergaard & Peterson 2006, Onken et al. 2004).
In particular black hole masses were
estimated (by using optical and near-IR spectra) by the following authors:
Barth, Martini & Nelson (2003), for SDSS1148+5251, Dietrich & Hamann (2004)
for SDSS0338+0021 (note that the BH mass in Maiolino et al.
2007 was underestimated due to calibration problems),
Shields et al. (2006) for RI1335-0417, Riechers et al. (2009) for APM08279+5255.
For what concerns the lensing factor of APM08279+5255, we adopted the value =4 for the CO emission in the host galaxy, as inferred by Riechers et al. (2009).
As discussed by the same authors, the lensing factor of the nuclear emission, which is important to estimate the BH mass, can be significantly larger, if the latter is close to the caustic.
To calculate the BH mass of this source we take 20, which is the the logarithmic average of the former value and the previous estimates based on the analysis of the nuclear emission lensed image
(Ibata et al. 1999, Egami et al. 2000, Muñoz et al. 2001, Lewis et al. 2002).
The BH masses were corrected for the effect of radiation pressure on the viral estimates, which is particularly important for such powerful QSOs, by following the prescription given in Marconi et al. (2008).
Appendix B The black hole and stellar mass measurements in individual SMG galaxies
In figs. 5a and 5b the values of six X-ray obscured and three BL SMG
galaxies are reported.
The BH mass estimates of the BL SMGs are taken from Alexander et
al. (2008). They estimated MBH from the luminosity and line width of the
broad H line and the Greene & Ho (2005) virial black hole mass estimator. We have assigned an
uncertainty of 0.5 dex to these estimates, equal to the 1
uncertainty of the virial relation adopted by the authors.
The BH masses of the X-ray obscured SMG are derived from Alexander et
al. (2005). They estimated MBH by converting the
X-ray luminosity in the (0.5-8) keV band to the AGN bolometric luminosity
(assuming a bolometric correction of 6 %) under the assumption
that the accretion is Eddington limited. In fig. 5a the vertical bars correspond
to the MBH we obtain assuming Eddington ratio (=Lbol/LEdd) of 0.1, 0.2 and 1.
The stellar masses, M∗, of the obscured SMGs and of one BL SMG (SMGJ123635+621424, star in fig. 5b ) are from Borys et al. (2005). They estimated stellar masses using rest-frame UV/near-IR luminosities and a mass-to-light ratio of 3.2 for these stellar population. The uncertainties in these M∗ estimates are from 0.01 dex to 0.23 dex (see Borys et al. 2005).
The values for the other two BL SMG (SMGJ131222.3+423814 and SMGJ163706.5+405313, diamonds in fig. 5b) are obtained using dynamical mass estimates, which are derived from CO line width measurements (Coppin et al. 2008; Greve et al. 2005). CO line widths can be converted into dynamical masses assuming a size and inclination for the gas reservoir. These estimates assumed a spatial extent of the CO gas of R 2 Kpc. The main uncertainties of these dynamical mass estimates are due to the unknown extention of the CO region and of the unknown inclination angle. It should also to be noted that the dynamical mass includes gas and stellar masses, therefore the diamonds in fig. 5b represent lower limits for .