The Outer Shock of the Oxygen-Rich Supernova Remnant G292.0+1.8: Evidence for the Interaction with the Stellar Winds from its Massive Progenitor
Abstract
We study the outer-shock structure of the oxygen-rich supernova remnant G292.0+1.8, using a deep observation with the Chandra X-ray Observatory. We measure radial variations of the electron temperature and emission measure that we identify as the outer shock propagating into a medium with a radially decreasing density profile. The inferred ambient density structure is consistent with models for the circumstellar wind of a massive progenitor star rather than for a uniform interstellar medium. The estimated wind density () at the current outer radius ( pc) of the remnant is consistent with a slow wind from a red supergiant (RSG) star. The total mass of the wind is estimated to be (depending on the estimated density range), assuming that the wind extended down to near the surface of the progenitor. The overall kinematics of G292.0+1.8 are consistent with the remnant expanding through the RSG wind.
Subject headings:
ISM: individual objects (G292.0+1.8) — ISM: supernova remnants — shock waves — stars: mass-loss — X-rays: ISM1. Introduction
Studying the environments in which supernovae (SNe) explode and then subsequently evolve is crucial to understand how SNe feed energy and matter into the Galactic ecology. This is particularly important for core-collapse SNe which are believed to explode in a complicated environment caused by the late stage evolution of a massive progenitor star. The study of young core-collapse supernova remnants (SNRs) interacting with their circumstellar media is important in this regard. The evolution of the SNR is not only governed by the medium into which it is expanding but also by the details of its explosion. Therefore, the study of young core-collapse SNRs may also provide valuable information about their explosion.
The environment of a massive star at the time of the explosion is complicated by its evolutionary history. Stars of initial mass are likely to explode as red super giants (RSGs), while more massive stars end as Wolf-Rayet (WR) stars with a possible earlier RSG phase (Chevalier, 2005). For a simplistic case where the stellar wind had a constant velocity and a constant mass loss rate, the circumstellar density profile of the freely flowing unshocked wind is given by where is the density of the wind at the distance from the star. The structure and evolution of a SNR expanding in such a medium differs from that of a SNR expanding in a uniform density medium. Chevalier (1982) derived a self-similar solution for the 1-dimensional spherical expansion of SN ejecta whose density profile is given as a power-law () in a medium with a radial density dependence (). The evolution beyond the RSG wind is more complicated (i.e., similarity solutions fail to apply) and numerical studies are often required for a comprehensive description (e.g., Dwarkadas, 2005). A Wolf-Rayet phase expected in more massive stars further complicates its environment (e.g., Chevalier & Liang, 1989; Dwarkadas, 2007).
The circumstellar interaction of SNe has been extensively studied, especially in the radio band (see Weiler et al., 2002, for a review). Such an interaction plays a critical role in interpreting observations of -ray bursts (e.g., Campana et al., 2006). On the other hand, observational studies of core-collapse SNRs expanding within a circumstellar wind have not been well established so far. Among more than 260 Galactic SNRs, only a few known core-collapse SNRs show circumstantial evidence of the shock–wind interaction (Chevalier, 2005, and references therein), among which the most notable example is Cas A. The overall characteristics of Cas A are well described by a model of a supernova interacting with a RSG wind with a mass loss rate of yr-1 for a wind velocity of 10 (Chevalier & Oishi, 2003).
Another well-known example of a young core-collapse SNR is G292.0+1.8. G292.0+1.8 is one of the three known “oxygen-rich” SNRs (Goss et al., 1979; Murdin & Clark, 1979) in the Galaxy, along with Cas A and Puppis A. These SNRs show optical emission from fast-moving () O-rich ejecta knots, which are suggested to be synthesized in the core of a massive star ( ; e.g. Blair et al., 2000). The existence of the central pulsar (PSR J1124-5916) and its wind nebula (Hughes et al., 2001; Camilo et al., 2002; Hughes et al., 2003; Gaensler & Wallace, 2003) clearly demonstrates that G292.0+1.8 originated from a core-collapse SN of a massive star. A progenitor mass of is suggested from the observed metal abundance structure of an X-ray emitting ejecta (Hughes & Singh, 1994; Gonzalez & Safi-Harb, 2003; Park et al., 2004). Previous X-ray studies showed an X-ray bright central belt-like structure, which likely corresponds to shocked circumstellar medium (CSM) (Park et al., 2002). Park et al. (2002) suggested that the belt traces the enhanced mass loss in the progenitor star’s equatorial plane. G292.0+1.8 also shows faint X-ray emission along the outer boundary of the remnant, which corresponds to a sharp-edged perimeter seen in the radio morphology (Gaensler & Wallace, 2003). This faint X-ray emission is produced by the blast wave propagating into the ambient medium. It shows a simple, nearly circular morphology all around the SNR without showing significant substructures and is mostly free from shocked metal-rich ejecta emission. Thus, this outer region of G292.0+1.8 is useful for the detailed study of the CSM and its interaction with the SN blast wave.
In this paper, we present the results from our analysis of shocked CSM in G292.0+1.8 using our deep 500 ks Chandra observation first presented by Park et al. (2007), which provides an excellent opportunity for the spectral study of this faint emission from the outer boundary of the SNR. We describe the Chandra observation and the data reduction in § 2. In §§ 3 and 4, we investigate radial and azimuthal variations of the X-ray spectral properties of shocked CSM to show that the remnant is expanding in a circumstellar wind. The implications of our results on the nature of the circumstellar wind and the kinematics of the remnant are discussed in § 5. § 6 summarizes our results.
2. Observations and Data Reduction
We observed G292.0+1.8 on 2006 September 13 – October 20 (Park et al., 2007) using the Advanced CCD Imaging Spectrometer (ACIS) on board Chandra. The entire remnant ( in diameter) is covered with ACIS-I ( field of view) and the pointing was selected to place the pulsar (PSR J1124-5916) near the aimpoint. The total effective exposure time is 506 ks after the data reduction, with the exposure of individual observations ranging between and ks (Table 1). The level 1 event files were reprocessed to create new level 2 event files. We applied parameters of the standard Chandra pipeline process, except that we applied the VFAINT mode background cleaning and turned off the pixel randomization. CIAO 3.4 and CALDB 3.2.3 were used for all the reprocessing and analysis. We examined the overall background light curve for periods of high background. Only minor increases above the quiescent background level by a factor of were noticed and their total duration is less than 1% of the total exposure. Therefore, we did not apply any light curve filtering.
We checked the relative astrometry between individual observations using the position of the pulsar (PSR J1124-5916). We found less than deviations which are within typical on-axis astrometric uncertainties of the ACIS. For the purpose of the imaging analysis, event files were reprojected to a common tangent point (that of ObsID 6679). We generated exposure maps for each ObsID with the dead area correction111http://cxc.harvard.edu/ciao/why/acisdeadarea.html applied. For the spectral analysis, spectrum and response files were generated for individual ObsIDs and then merged, weighting by the exposure time. Out-of-time events222http://cxc.harvard.edu/proposer/POG_CYC10/html/chap6.html#sec:trailed-images from the bright SNR emission along the CCD readout directions are present, which in principle could affect our spectral analysis. For the southeastern region, where the SNR emission is faint, the estimated out-of-time event counts are 7% of the total counts (source and background). However, the out-of-time events contribute uniformly along the CCD readout direction and we find the local background subtraction removes more than 90% of out-of-time events in the source spectrum. The effects of out-of-time events to the background-subtracted spectrum are thus negligible.
| ObsID | Date | Exposure | RollAngle$\dagger$$\dagger$ Roll angle describes the orientation of the Chandra instruments on the sky. |
|---|---|---|---|
| [ks] | [] | ||
| 6680$\ddagger$$\ddagger$ ObsID 6680 was conducted with 2 ACIS-S chips in addition to 4 ACIS-I chips, and affected by telemetry saturation, reducing the net exposure time by %. All later observations used only ACIS-I chips, and thus were not affected by the telemetry saturation. | 9/13/2006 | 39 | 180 |
| 6678 | 10/2/2006 | 44 | 157 |
| 6679 | 10/3/2006 | 153 | 157 |
| 8447 | 10/7/2006 | 47 | 157 |
| 6677 | 10/16/2006 | 159 | 140 |
| 8221 | 10/20/2006 | 64 | 140 |
3. Radial Profile of the Outer Shell of G292.0+1.8
3.1. Spectral Fitting
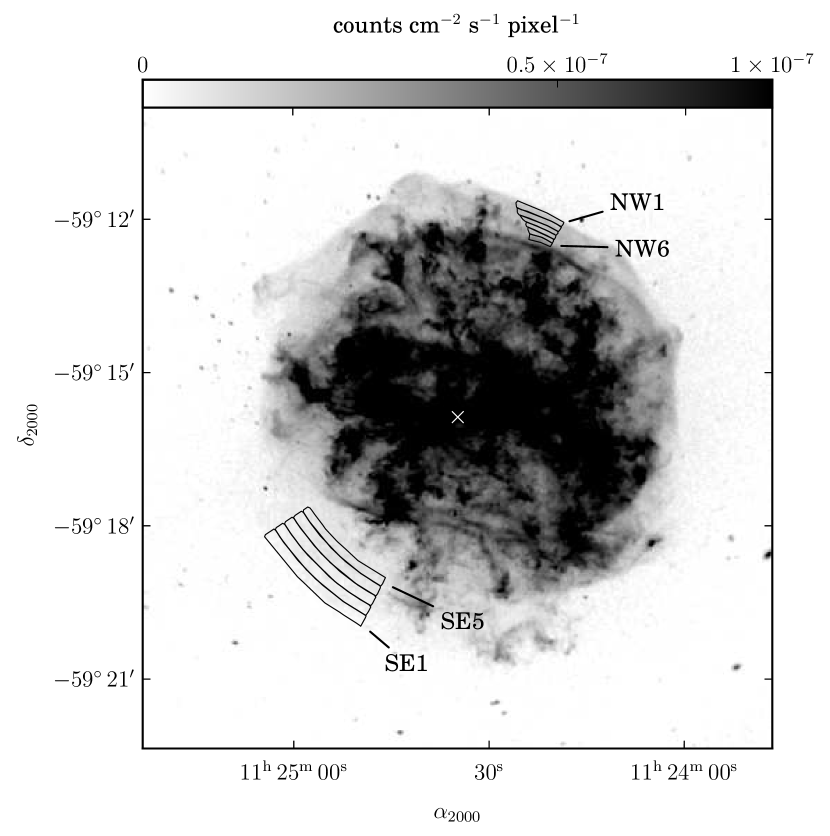
The X-ray images of the deep Chandra observation clearly reveal the faint outer blast wave all around the remnant (Fig. 1). While the northern and western outer boundaries are well-defined and relatively bright, that of the southeast is faint. Although a slight limb-brightening appears to be present in some parts of the northwestern boundary, in general, the surface brightness of the outer boundary does not show a significantly limb brightened morphology. The radial brightness variation is rather flat and even increasing inward in some regions (e.g., southeast). Given the core-collapse origin of the remnant, we consider this overall morphology in the framework of the SNR expanding in its circumstellar wind.
For a quantitative analysis, we investigate the radial variation of the X-ray spectral characteristics near the outer boundary. This approach is motivated by the fact that the gas behind the forward shock preserves the information of the medium it has swept up. Chevalier (1982) found self-similar solutions for the interaction of expanding stellar ejecta (, ) with an external medium (): a remnant expanding in a uniform ambient medium () would result in an inward-decreasing density and an inward-increasing temperature profile for the shocked ambient gas, while a remnant expanding in a medium with a wind profile () would show an inward-increasing density and an inward-decreasing temperature. Therefore, by studying the current radial profile of the density and temperature, we can infer whether the SNR is currently expanding into a density gradient.
We selected two representative regions in the northwest (NW) and southeast (SE). We examined various narrow band images and X-ray color images of the remnant and selected regions where the contamination by ejecta emission is negligible and the area is sufficiently large to study the radial spectral variation. Each region (NW and SE) is divided into several radial subregions to track the radial spectral variation (Fig. 1). The photon statistics for each subregion are counts in the - keV band. The extracted spectrum for each subregion is fitted with a single nonequilibrium ionization (NEI) plane-parallel shock model (vpshock in Xspec v12, Borkowski et al., 2001). The fits with variable metal abundances (O, Ne, Mg, Si, S and Fe were fitted while the other species were fixed at their solar values (Anders & Grevesse, 1989)) are statistically better () than those with metal abundances frozen () at solar values. The fitted metal abundances are generally subsolar, confirming that there is no significant ejecta contamination in the selected regions. The derived spectral parameters from the individual subregional fitting are not well constrained due to the large number of free parameters involved in the fit. As the abundance pattern in each radial region is similar within statistical uncertainties, we simultaneously fit all subregions in each of the NW and SE regions with their metal abundances tied. The variation of the absorbing column density when fitted independently is statistically insignificant, and thus we tie the absorbing column densities among subregions, as well. We note that our fits result in a relatively higher of than from the spectral analysis of the pulsar (Hughes et al., 2001). Fixing at increases the temperature (by %) and decreases the normalization (by %) in a systemic way and does not fundamentally affect our results. The above approach provides acceptable fits (example spectra and the best–fit models are shown in Fig. 2) for individual subregions in each of the SE and NW regions with well constrained spectral parameters. The fitted parameters are consistent with those from independent fits within statistical errors. We utilize these fit parameters for the following radial analysis. The fit results for regions NW and SE are summarized in Tables 2 and 3.

3.2. Model Comparison
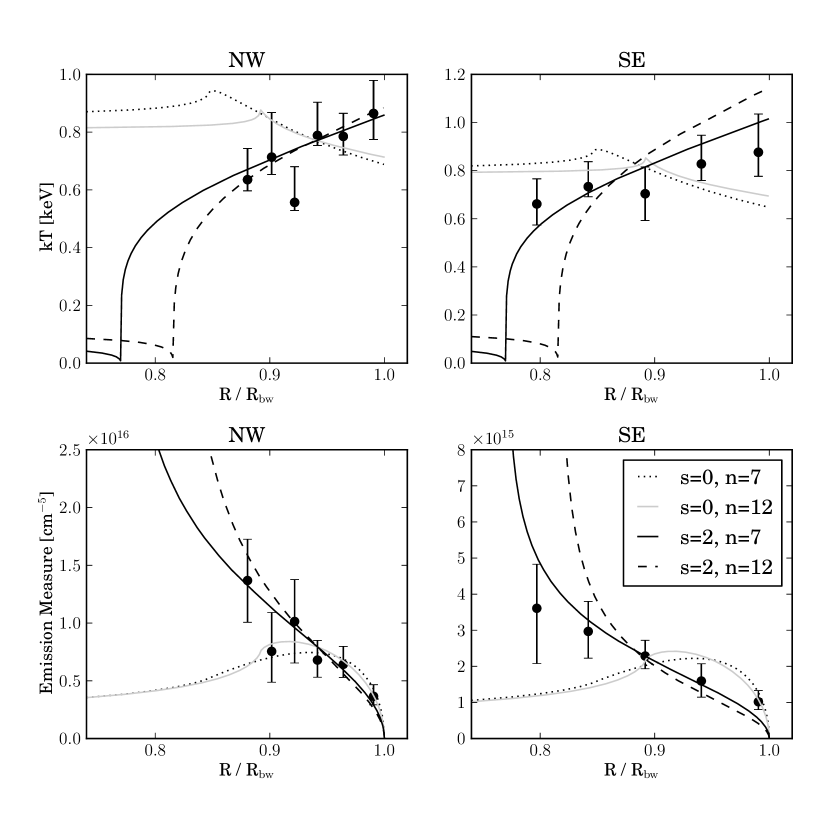
In Fig. 3, we plot the spectral variation as a function of the radial distance of each subregion from the geometric center of the remnant as determined by the radio continuum image ( = 11h 24m 348, -59°15′529, Gaensler & Wallace, 2003), where the radial distance of each subregion is normalized by the distance to the forward shock in that region. As these regions are located in the outer parts of the remnant, the uncertainty of the remnant center does not make a significant effect on the results presented in this section. The radial variations of the spectral parameters are consistent between the NW and SE regions (Fig. 3). The emission measure333 We use the conventional emission measure (EM = ) where the fitted volume emission measure () is normalized by the region area. increases inward, while the electron temperature does not. The ionization timescale () shows a similar trend as the emission measure.
We overlay model predicted radial distributions of the temperature and emission measure in Fig. 3, where the radial profiles from Chevalier (1982) are projected assuming a spherical geometry. Chevalier (1982) provides models of density, pressure and velocity of the gas as a function of the radial distance from the center. The model emission measure in Fig. 3 is calculated by integrating the density square along the line of sight. The temperature is not explicitly provided in Chevalier (1982), and we have calculated it from the thermal pressure and gas density. The projected temperature in Fig. 3 is taken as an average temperature along the line of sight weighted by density squared. While we ignore the variation in the intrinsic emissivity of the gas at different temperatures, the variation is not significant ( %) in the temperature range of 0.6 – 0.9 keV. Models with four different sets of and are plotted. The solutions of show distinguished radial variations from the solutions of , which reflect their different radial trends in density and temperature as briefly described in § 3.1. The projected temperature of the shocked ambient medium of solutions shows a decrease toward the contact discontinuity (CD), in contrast to the increase in solutions. The emission measure of solutions monotonically increases toward the CD. The emission measure of solutions initially increases due to the geometrical effect, and then starts to decrease. These overall trends of the emission measure and temperature profiles are dominated by the ambient density structure ( vs. ) rather than by the ejecta profile. The primary effect by the power law index of the ejecta is on the distance between the forward shock front and the CD: e.g., a steeper ejecta profile makes the CD close to the forward shock. Fig. 3 demonstrates that the general tendency of the observed temperature and emission measure are well described by models with (the solid and dashed lines). The model of , , in particular, is in good agreement with the observations, where our fits show reduced of in both SE and NW regions. On the other hand, models (the gray and the dotted lines) show significant discrepancies especially in the SE region with a reduced of . The observed radial structures of the temperature and the emission measure are inconsistent with the remnant expanding in a uniform medium where the postshock inner region is expected to result in a lower density and a higher temperature than the region immediately behind the blast wave (Chevalier, 1982).
We note that the temperature from the X-ray spectral fit is the electron temperature, while the temperature from the model is the ion temperature. These two can differ considerably in non-radiative shocks faster than 1000 (e.g., Ghavamian et al., 2007, and references therein). Assuming the SNR age of 3000 yr (Ghavamian et al., 2005; Winkler et al., 2009, this age is adopted throughout this paper), the average blast wave velocity would be for a remnant radius of 7.7 pc (see § 5.2), and the blast wave should have been faster in the past. The observed ratio between the electron temperature () and the proton temperature () immediately behind the shock is known to vary with shock velocities (Ghavamian et al., 2007). But the detailed variation of in the shocks of is unclear and we assume a constant value of across the radius of the postshock regions used in our analysis (the actual value does not matter for our analysis). We note that Coulomb equilibration in the downstream region will eventually equilibrate ions and electrons, and the electron temperature will increase. This would increase the downstream electron temperature. Qualitatively, the modeled radial profile of the electron temperature would thus be flatter (in case of the models) than that of the ion temperature, which would still be consistent with our data.
The analytic model of Chevalier (1982) is a similarity solution assuming a power law distribution of the ambient density and ejecta, which may not be entirely adequate for actual SNRs. For example, the models have the initial wind density profile of infinite at and predict an infinite density and zero temperature at the CD. However, we believe that this solution is a good approximation to the real case for the regions away from the CD. While the density distribution of the ejected material depends on the structure of the progenitor star, a power law envelope surrounding a flat (or shallower) core is a reasonable approximation (Chevalier & Soker, 1989; Matzner & McKee, 1999). The assumption of the power law density of ejecta will eventually break down as the reverse shock reaches the core. While this may significantly modify the structure of the shocked ejecta material, the effect on the structure of the shocked ambient gas would not be significant. The Chevalier (1982) models do not include the effects of cosmic ray acceleration in the shock. While the efficient cosmic ray acceleration may modify the underlying shock structure, the overall trend of the radial variation is likely to be still valid (e.g., Decourchelle et al., 2000). Therefore, we conclude that the observed trend of the decreasing temperature and increasing emission measure of the shocked ambient gas toward the CD is a robust indicator that the blast wave is currently expanding into a radially-decreasing density profile () rather than a constant density(). This result provides direct observational evidence that the blast wave of G292.0+1.8 is currently propagating through the stellar winds produced by its massive progenitor. On the other hand, our results may not constrain the power law index of the ejecta (). The apparent effects of is the change in the relative distance from the CD to the outer boundary. However, this distance can be varied by other physical processes which are not properly included in the model, e.g., cosmic ray accelerations. Also, the propagation of the reverse shock into the shallow ejecta core may result in the decrease of the effective power-law index. Therefore, while the observation shows better agreement with the model of than the model of , this may not be interpreted in favor of the model over the model.
| Sector | [ cm-2] | O | Ne | Mg | Si | S | Fe |
|---|---|---|---|---|---|---|---|
| NW | 5.8 | 0.67 | 0.75 | 0.35 | 0.36 | 0.63 | 0.24 |
| SE | 5.0 | 0.36 | 0.64 | 0.21 | 0.13 | 0.12 | 0.07 |
Note. — These parameters are fitted after being tied among subregions. Results for spectral parameters varied freely are presented in Table 3. Metal abundances are with respect to solar (Anders & Grevesse, 1989). Throughout the paper, errors are shown in 90% confidence range unless explicitly specified otherwise.
| Region | Distance | E.M. | ||
|---|---|---|---|---|
| [] | [keV] | [cm-3s] | [ cm-5] | |
| NW1 | 4.33 | 0.86 | 10.41 | 0.37 |
| NW2 | 4.21 | 0.79 | 10.74 | 0.64 |
| NW3 | 4.11 | 0.79 | 10.75 | 0.68 |
| NW4 | 4.03 | 0.56 | 11.34 | 1.01 |
| NW5 | 3.94 | 0.71 | 10.93 | 0.75 |
| NW6 | 3.85 | 0.64 | 11.05 | 1.37 |
| SE1 | 4.30 | 0.88 | 10.69 | 0.10 |
| SE2 | 4.08 | 0.83 | 11.13 | 0.16 |
| SE3 | 3.87 | 0.70 | 11.51 | 0.23 |
| SE4 | 3.65 | 0.73 | 11.37 | 0.30 |
| SE5 | 3.46 | 0.66 | 11.32 | 0.36 |
Note. — Regions are listed on the decreasing order of their distance from the center; i.e., the top row in each region represents the outermost region. Based on the simultaneous fit for each region, and for NW and SE regions, respectively.
4. Azimuthal Variation
Fig. 4 shows regions we chose for the azimuthal study. We selected narrow regions (thickness ) along the outer boundary of the remnant. We avoided regions in which the contamination from the ejecta emission is significant We extracted the spectrum from each region and fitted it independently with the vpshock model. The photon statistics in these regions are a few thousand counts which are similar to those in subregions used in the radial analysis. The fitted spectral parameters are poorly constrained when the metal abundances are freely varied, and we fix the metal abundances to the average values as obtained from the radial analysis (NW and SE regions). The fitted absorbing column density varies between and cm-2. However, the variation is statistically insignificant, e.g., the fits do not significantly change when is fixed at the mean value. Thus, in the following discussion, we use results from the fits where we fix at their mean of cm-2.
| P.A.$\dagger$$\dagger$Position angles to each region are measured east of north from the geometrical center. | $\ddagger$$\ddagger$For all individual spectra, the degree of freedom () is 372. | |||
|---|---|---|---|---|
| [∘] | [keV] | [cm-3] | [ cm-3s] | |
| 13 | 0.86 | 1.06 | 10.36 | 1.06 |
| 59 | 0.76 | 0.90 | 10.79 | 0.89 |
| 126 | 0.71 | 0.51 | 10.81 | 0.97 |
| 144 | 0.73 | 0.58 | 10.43 | 1.05 |
| 229 | 0.84 | 1.07 | 10.68 | 0.90 |
| 264 | 0.80 | 0.96 | 10.77 | 0.92 |
| 275 | 0.69 | 1.43 | 10.40 | 0.93 |
| 300 | 0.66 | 0.85 | 10.30 | 0.90 |
| 329 | 0.84 | 1.22 | 10.48 | 0.95 |
| 338 | 0.68 | 1.21 | 10.41 | 1.01 |
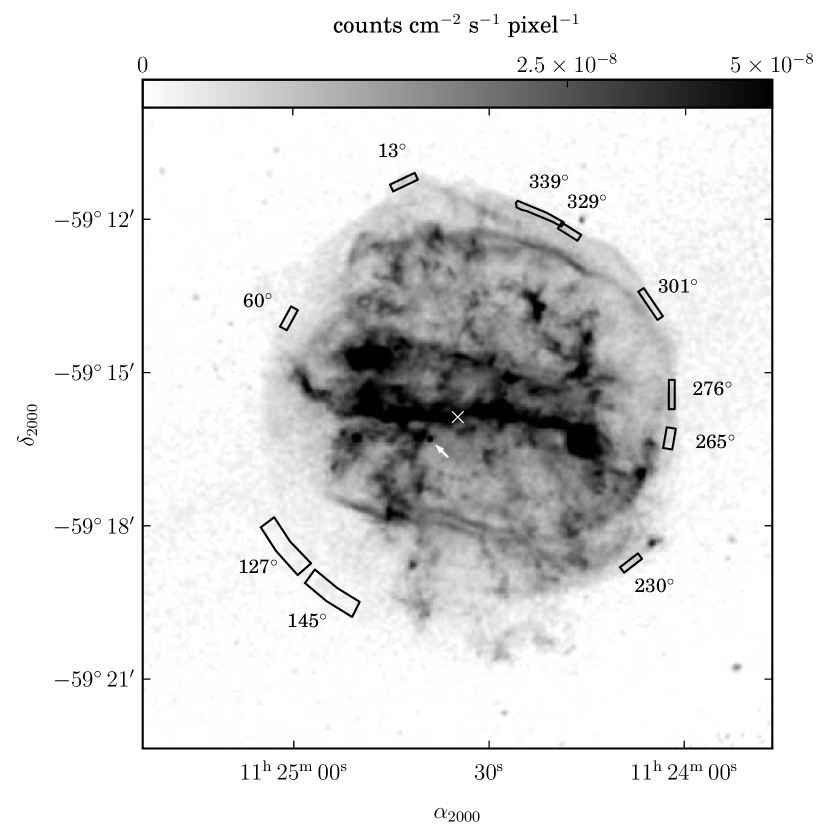
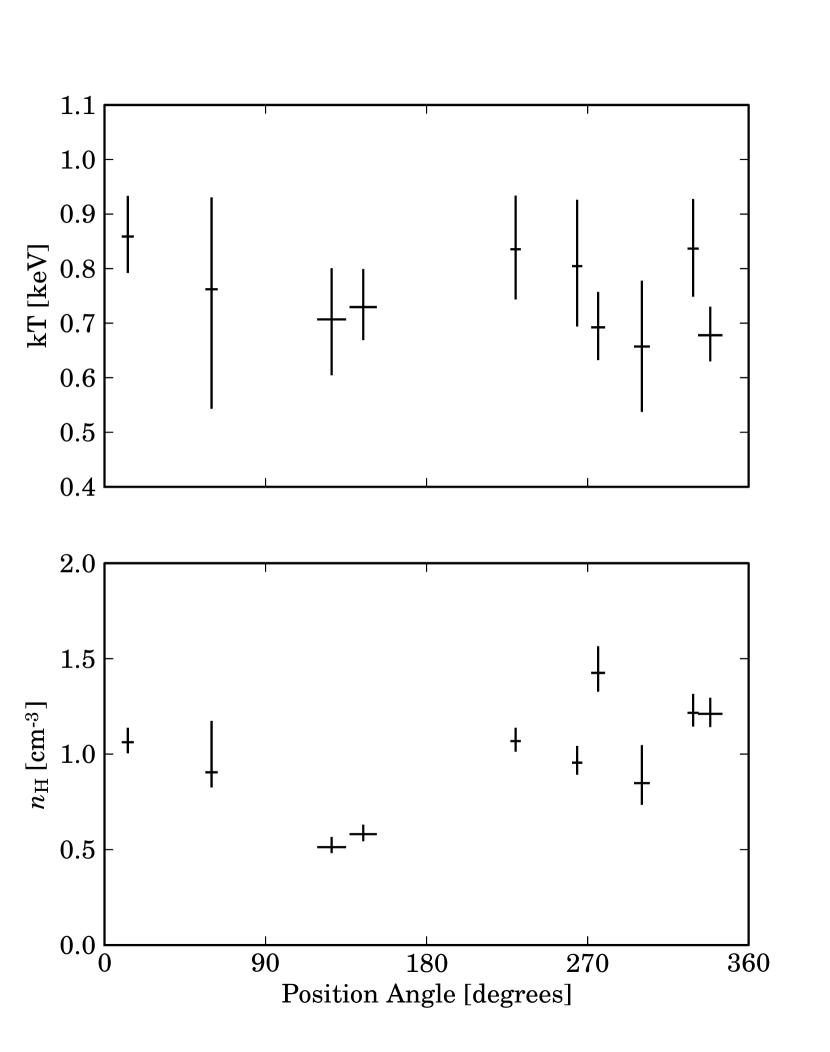
The azimuthal variations of the electron temperature and the hydrogen number density are presented in Table 4 and Fig. 5. The densities are estimated from the volume emission measures. The volume corresponding to each region is calculated by pixel-by-pixel integration of the path-lengths over the projected area. In this calculation, we assumed a sphere centered at the geometrical center of the remnant at a distance of 6 kpc (Gaensler & Wallace, 2003). The radius of the sphere is separately determined for each region as the projected distance of the farthest (from the geometrical center of the remnant) pixel in the region. The uncertainties on the electron temperature are too large to constrain any possible variations around the SNR boundary. On the other hand, in the SE regions (PA ), the density shows a significant drop by a factor 2 from the average (). The gas density shown in Fig. 5 is the postshock hydrogen number density. Assuming a compression factor of 4 from a strong gas shock, this corresponds to a preshock gas density of toward the SE and in other regions.
5. Discussion
Our observation provides direct evidence of G292.0+1.8 interacting with its CSM wind, which is consistent with the core-collapse origin of the remnant (§1). Our results also can help reveal the nature of the progenitor star by the observed wind properties. In the followings, we discuss the nature of the wind with which G292.0+1.8 is currently interacting and the overall kinematics of the remnant. We also briefly discuss the possible evolutionary paths of the progenitor star.
5.1. The Progenitor’s Stellar Wind
The expansion of SN blast waves within circumstellar winds has been extensively studied with SNe observations. The shocked CSM emits in radio continuum and also in X-rays. The mass loss rates of the progenitor stars, estimated by modeling their light curve, are for type Ib/c and for type II SNe (Sramek & Weiler, 2003). The circumstellar interaction of SNRs, on the other hand, has not been well established, although there has been some circumstantial evidence (Chevalier, 2005).
The radial profiles of the postshock temperature and density in G292.0+1.8 argue that the remnant is expanding within the circumstellar wind. A slight limb brightening is seen in a few regions in NW, and we attribute it to a local effect, e.g., the shock is probably encountering locally dense regions in the wind. The overall dynamics of the remnant would not be significantly altered by such a small local effect, and we consider that the SNR shock has not yet reached the termination shock of the wind. The radial profile of the wind density with a constant mass loss rate of and a wind velocity of is given by . Adopting the geometrical center of the remnant as the wind center, where we estimate an average shock radius of pc, we estimate
A slow wind velocity () appropriate for the RSG winds implies a mass loss rate for the observed density range (), which is consistent with the observations of type II SNe. On the other hand, assuming a fast () Wolf-Rayet wind results in , a few orders of magnitudes larger than what is inferred from type Ib/c SNe observations.
The integrated mass of the wind swept up by the remnant, assuming the wind extends down to , is
Accounting for the azimuthal density variation in the postshock regions, we estimate the mass range of . There are further uncertainties involved in this estimate due to the various assumptions we made. Our density measurement scales as inverse square root of the assumed distance to the remnant (), thus . For example, a slightly smaller distance of 5 kpc (which is within uncertainties in the distance measurements to G292.0+1.8, Gaensler & Wallace, 2003) will reduce the mass estimate by . Another source of uncertainties could be our simple assumption on the remnant geometry, a sphere centered at the geometric center of the remnant. If the wind is clumped, a local density fluctuation may have led us to overestimate the average density, as the observed emission measure is likely biased by the high density regions. The mass estimate will also be reduced if the shock compression ratio is higher than 4 due to efficient CR acceleration, while this effect may not be significant as there is no evidence for nonthermal X-ray emission in G292.0+1.8. We assume that the mass loss remained constant until the moment of the explosion. However, observations of some SNe suggest that their mass loss rates have decreased with time before the explosion (e.g., van Dyk et al., 1994). Also, the progenitor star might have evolved through different stages (such as Blue Super Giant or Wolf-Rayet star).
Theoretical studies of the stellar evolution suggests that stars of less massive than 35 end their life during the RSG phase, while more massive stars evolve to WR phase with a possible earlier RSG phase. Given that the wind is likely a dense RSG wind, the progenitor star of G292.0+1.8 might have a initial mass less massive than 35 . In this regards, the wind mass as large as may not be realistic for stellar evolutionary models. However, we note that there could be uncertainties in the modeling of the late stage of the stellar evolution, which is very sensitive to mass loss rate of the star, as the stellar mass loss rate is rather poorly constrained by observations. On the other hand, previous nucleosynthesis studies of G292.0+1.8 using X-ray emission from metal-rich ejecta suggested a progenitor mass of (Hughes & Singh, 1994; Gonzalez & Safi-Harb, 2003; Park et al., 2004), while these progenitor mass estimates were limited by nondetection of the explosive nucleosynthesis products in this SNR (Park et al., 2004). Considering that there are large uncertainties on both estimates of the wind and the progenitor masses, our estimate of the wind mass is in plausible agreement with a general picture: the progenitor of G292.0+1.8 was a massive star which lost a significant amount of its mass during the pre-SN evolution.
Our azimuthal analysis in § 4 suggests an azimuthal density variation. Since the outer boundary of the remnant has unlikely reached the termination shock of the RSG wind, the observed density variation would represent the variation in the wind density. The wind density in the SE boundary of the remnant is smaller than those in other regions by a factor of . While this could be due to some local effects, the wind might have been asymmetric. Alternatively, the center of the wind might have not been at the geometric center of the SNR. The asymmetric SN explosion might have caused the southeastern part of the remnant to expand more rapidly than in NW, and the azimuthal density variation could be due to an offset of the progenitor star from the SNR’s geometric center. Recently, Winkler et al. (2009) studied proper motion of [O III] ejecta and located the estimated expansion center of ejecta knots, which turned out to be consistent with the SNR’s geometric center. However, we note that the observed proper motions of many individual optical knots show significant deviations from the best-fit model which indicated the explosion center at the geometric center of the SNR. Thus, the origin of the azimuthal density variation along the outer boundary of G292.0+1.8 is not conclusive.
5.2. Supernova Remnant Kinematics
The morphology of the remnant, especially when it is young, traces its explosion characteristics. The kinematic properties of G292.0+1.8, such as the age and the explosion energy, have been estimated in the previous works. However, G292.0+1.8 was previously assumed to be expanding in a uniform medium instead of the circumstellar wind (e.g., Gonzalez & Safi-Harb, 2003; Gaensler & Wallace, 2003), although G292.0+1.8 is believed to be a core-collapse SNR. In fact, detailed observational studies of young core-collapse SNRs accounting for the evolution in a circumstellar wind material have been conducted for only a limited number of remnants such as Cas A (Chevalier & Oishi, 2003; Laming & Hwang, 2003). Here, we estimate kinematic properties of G292.0+1.8, explicitly accounting for its evolution in the circumstellar wind.
For simplicity, we assume a spherically symmetric explosion. Like the SNR evolution in a homogeneous medium, the initial evolution of the remnant is dominated by the characteristics of the ejecta (the ejecta-dominated phase) and makes a transition to the Sedov-Taylor (ST) phase as the swept-up mass becomes larger than the ejecta mass. Truelove & McKee (1999, TM99 hereafter) discussed a unified solution which describes a spherically symmetric interaction of the ejected stellar material, which has a flat core surrounded by a power-law envelope, with an ambient medium. TM99 focused on the evolution in the homogeneous medium. Laming & Hwang (2003, LH03 hereafter) extended TM99’s work to evolution in a stellar wind. The characteristic age () and size () of the remnant, which mark the approximate transition from the ejecta-dominated (ED) phase to the ST phase, are given by
for the evolution of the remnant in the pre-supernova wind (from Eq. A3 and A4 of LH03); is a hydrogen number density of the wind at the radius of the blast wave (), ergs, is the explosion energy and is the ejected mass from the supernova, and , and are in units of , pc and cm-3, respectively. If we adopt an average radius of = 7.7 pc from the geometrical center and the low density of = that seems to be preferred by stellar evolution model, we obtain yr and pc for G292.0+1.8. Assuming of several as in Cas A and for a canonical explosion energy of , we estimate yr, which is larger than the remnant age ( yr) (technically, the transition time to the ST phase () can be smaller than , Truelove & McKee, 1999). Thus G292.0+1.8 might still be in its ED phase or in its transition to the ST phase. And the ED phase evolution would be better fit to describe the current kinematics of the G292.0+1.8. The evolution of the SNR in the ED phase is largely determined by , and the power law index of the ejecta envelope. The radius of the blast wave () during the ED phase is described by (from Eq. A5 of LH03)
| (1) |
where and (the physical meanings of and are discussed in LH03 and TM99). Assuming , = 7.7 pc, = , and yrs, the above solution gives a large ejecta mass of for the the power law index of the ejecta envelope between 7 and 12. Adopting a higher wind density of = reduces the ejecta mass estimate and gives . The ejecta mass is also reduced if we assume a less energetic explosion. With and = , we estimate . These estimates are based on the assumption that the remnant is strictly in the ED phase. The deceleration of the remnant during its transition to the ST phase would increase the explosion energy and decrease the ejecta mass. We note that, due to the high wind density near the center, radiative cooling may have been effective in the very early age of the remnant (which may be responsible for the optical emission from the ejecta, Laming & Hwang, 2003) and this could have affected the overall evolution. However, at this early time, most of the explosion energy would be in the form of the kinetic energy of the expanding ejecta, and the loss of energy by radiative cooling should be negligible in the total energy conservation and the overall remnant evolution.
The shock velocity of the blast wave () is given as
. For the observed electron temperature range of 0.6 – 0.9 keV, this shock velocity indicates , consistent with those in other remnants with comparable shock velocities (Ghavamian et al., 2007). The optical observations of [O III] ejecta show an average expansion velocity of (Ghavamian et al., 2005). This velocity may be considered an upper limit for the current reverse shock velocity (the velocity in the rest frame of the ambient gas; ). Using Eq. A13 of LM03, we derive near . The derived velocity is insensitive to because of its logarithmic dependency. We estimate for and for , which are consistent with the optical observations (Ghavamian et al., 2005).
While we have assumed a spherically symmetric explosion, recent observations and hydrodynamic modelings of SNe revealed a compelling case that high-mass SN explosions are intrinsically aspherical events (Wang & Wheeler, 2008; Burrows et al., 2005; Janka et al., 2005). Previous observations of G292.0+1.8 indeed suggested that the explosion of G292.0+1.8 may have been asymmetric. Park et al. (2007) showed that the ejecta temperature is significantly higher generally in the northwestern and western regions of the SNR than in the southeastern regions. They suggested that this large-scale nonuniform distribution of the ejecta temperature may be caused by an asymmetric SN explosion: the explosion could have been more energetic toward NW-W than in SE. Winkler et al. (2009) found that [O III] knots in north–south (N–S) axis are faster than those along the east–west axis, and suggested a possibility that explosions were more energetic along N–S axis. Also, there is a possibility that the azimuthal density variation around the remnant might be related with the asymmetric explosion (§ 4). However, these scenarios are not fully consistent with each other and further studies are needed. Our future study, which will focus on the X-ray characteristics of the shocked ejecta material, will help us reveal the detailed nature of the explosion of G292.0+1.8.
5.3. Progenitor Star
For the progenitor mass of estimated from previous X-ray observations (Hughes & Singh, 1994; Gonzalez & Safi-Harb, 2003; Park et al., 2004), the overall observed wind properties are in plausible agreement with the general physical picture that the progenitor was a massive star which lost a significant amount of the mass through the RSG winds. However, given the uncertainties in the observational results and theoretical models, the current results do not provide a unique evolutionary track for the progenitor star (of a specific initial mass) which led to the explosion of G292.0+1.8. Based on our results, we briefly discuss a few possible scenarios for the evolutionary track of the progenitor.
The progenitor star of initial mass of as low as seems to be consistent with lower end of our wind mass estimate, where the star had a mass loss of as the RSG wind while the rest of the mass went into the ejecta and the neutron star. In this scenario, the kinematics of the remnant can be explained by an explosion of . While the stellar evolutionary models for a single star of seem to predict smaller mass losses than 10 , a possible companion star may have increased the mass loss, as proposed for the case of Cas A (Young et al., 2006). A significantly increased amount of mass loss is expected if the progenitor is more massive. For example, the models suggest that a star of loses as the RSG wind and than explodes as the RSG star (Woosley et al., 2002). While a black hole might be expected after the explosion of such a massive star, the final fate of the compact remnant is inconclusive as observations show that a neutron star can be still formed from even more massive stars (, Muno et al., 2006). A progenitor star of likely has evolved into the WR phase after the RSG phase. This might be the case of G292.0+1.8 if its WR phase has been short. In summary, given that the wind is most likely the RSG wind, the evolutionary models seems to prefer a progenitor’s initial mass between . This is plausibly consistent with the lower range of our wind mass estimates (), although the higher mass progenitor cannot be completely ruled out.
6. Summary
Using our deep (500 ks) Chandra observations, we present the results from our detailed analysis of the blast wave in the Galactic O-rich SNR G292.0+1.8. We find that the observed emission measure of the shocked ambient gas increases toward the contact discontinuity while the observed gas temperature decreases. Comparisons of these observational results to self-similar solutions (Chevalier, 1982) reveal that the observation is best described by the SNR currently expanding within the medium with a radially decreasing density profile (), likely a wind from the massive progenitor star. The inferred ambient medium is well described by a slow RSG wind from the progenitor star with a mass loss rate of assuming a wind velocity of . The ambient density is too high for Wolf-Rayet wind, whose fast wind velocity implies a mass loss rate order-of-magnitude higher than what is generally accepted. The total swept-up mass of the wind is estimated to be , where the quoted range is due to the observed azimuthal density variation. The wind mass estimate may also be affected by other systematic uncertainties such as the distance and geometry. Because the ambient medium is likely the RSG wind from a progenitor of , the higher range of our wind mass estimates () may not be favored by standard stellar evolution models, although it is not completely ruled out. The overall kinematics of G292.0+1.8 is plausibly described by the models for a remnant expanding inside the RSG wind.
Our results provide direct observational evidence for the blast wave interacting with the CSM winds in G292.0+1.8, which is consistent with the core-collapse origin of this SNR as revealed based on the central pulsar and the O-rich nature of the metal-rich ejecta. While the density of the CSM wind is one of the fundamental properties to study the nature of young core-collapse SNRs and their progenitor’s late-stage evolution, a direct observational measurement has been difficult. Deep X-ray observations of young core-collapse SNRs provide an excellent opportunity for such a study. Our future studies of the nature of the SN ejecta in G292.0+1.8 will be helpful to improve our understanding of the late-stage evolution of massive stars and their subsequent explosion as supernovae.
References
- Anders & Grevesse (1989) Anders, E. & Grevesse, N. 1989, Geochim. Cosmochim. Acta, 53, 197
- Blair et al. (2000) Blair, W. P., Morse, J. A., Raymond, J. C., Kirshner, R. P., Hughes, J. P., Dopita, M. A., Sutherland, R. S., Long, K. S., & Winkler, P. F. 2000, ApJ, 537, 667
- Borkowski et al. (2001) Borkowski, K. J., Lyerly, W. J., & Reynolds, S. P. 2001, ApJ, 548, 820
- Burrows et al. (2005) Burrows, A., Walder, R., Ott, C. D., & Livne, E. 2005, in Astronomical Society of the Pacific Conference Series, Vol. 332, The Fate of the Most Massive Stars, ed. R. Humphreys & K. Stanek, 350
- Camilo et al. (2002) Camilo, F., Manchester, R. N., Gaensler, B. M., Lorimer, D. R., & Sarkissian, J. 2002, ApJ, 567, L71
- Campana et al. (2006) Campana, S., Mangano, V., Blustin, A. J., Brown, P., Burrows, D. N., Chincarini, G., Cummings, J. R., Cusumano, G., Della Valle, M., Malesani, D., Mészáros, P., Nousek, J. A., Page, M., Sakamoto, T., Waxman, E., Zhang, B., Dai, Z. G., Gehrels, N., Immler, S., Marshall, F. E., Mason, K. O., Moretti, A., O’Brien, P. T., Osborne, J. P., Page, K. L., Romano, P., Roming, P. W. A., Tagliaferri, G., Cominsky, L. R., Giommi, P., Godet, O., Kennea, J. A., Krimm, H., Angelini, L., Barthelmy, S. D., Boyd, P. T., Palmer, D. M., Wells, A. A., & White, N. E. 2006, Nature, 442, 1008
- Chevalier (1982) Chevalier, R. A. 1982, ApJ, 258, 790
- Chevalier (2005) —. 2005, ApJ, 619, 839
- Chevalier & Liang (1989) Chevalier, R. A. & Liang, E. P. 1989, ApJ, 344, 332
- Chevalier & Oishi (2003) Chevalier, R. A. & Oishi, J. 2003, ApJ, 593, L23
- Chevalier & Soker (1989) Chevalier, R. A. & Soker, N. 1989, ApJ, 341, 867
- Decourchelle et al. (2000) Decourchelle, A., Ellison, D. C., & Ballet, J. 2000, ApJ, 543, L57
- Dwarkadas (2005) Dwarkadas, V. V. 2005, ApJ, 630, 892
- Dwarkadas (2007) —. 2007, ApJ, 667, 226
- Gaensler & Wallace (2003) Gaensler, B. M. & Wallace, B. J. 2003, ApJ, 594, 326
- Ghavamian et al. (2005) Ghavamian, P., Hughes, J. P., & Williams, T. B. 2005, ApJ, 635, 365
- Ghavamian et al. (2007) Ghavamian, P., Laming, J. M., & Rakowski, C. E. 2007, ApJ, 654, L69
- Gonzalez & Safi-Harb (2003) Gonzalez, M. & Safi-Harb, S. 2003, ApJ, 583, L91
- Goss et al. (1979) Goss, W. M., Shaver, P. A., Zealey, W. J., Murdin, P., & Clark, D. H. 1979, MNRAS, 188, 357
- Hughes & Singh (1994) Hughes, J. P. & Singh, K. P. 1994, ApJ, 422, 126
- Hughes et al. (2001) Hughes, J. P., Slane, P. O., Burrows, D. N., Garmire, G., Nousek, J. A., Olbert, C. M., & Keohane, J. W. 2001, ApJ, 559, L153
- Hughes et al. (2003) Hughes, J. P., Slane, P. O., Park, S., Roming, P. W. A., & Burrows, D. N. 2003, ApJ, 591, L139
- Janka et al. (2005) Janka, H.-T., Scheck, L., Kifonidis, K., Müller, E., & Plewa, T. 2005, in Astronomical Society of the Pacific Conference Series, Vol. 332, The Fate of the Most Massive Stars, ed. R. Humphreys & K. Stanek, 363
- Laming & Hwang (2003) Laming, J. M. & Hwang, U. 2003, ApJ, 597, 347
- Matzner & McKee (1999) Matzner, C. D. & McKee, C. F. 1999, ApJ, 510, 379
- Muno et al. (2006) Muno, M. P., et al. 2006, ApJ, 636, L41
- Murdin & Clark (1979) Murdin, P. & Clark, D. H. 1979, MNRAS, 189, 501
- Park et al. (2007) Park, S., Hughes, J. P., Slane, P. O., Burrows, D. N., Gaensler, B. M., & Ghavamian, P. 2007, ApJ, 670, L121
- Park et al. (2004) Park, S., Hughes, J. P., Slane, P. O., Burrows, D. N., Roming, P. W. A., Nousek, J. A., & Garmire, G. P. 2004, ApJ, 602, L33
- Park et al. (2002) Park, S., Roming, P. W. A., Hughes, J. P., Slane, P. O., Burrows, D. N., Garmire, G. P., & Nousek, J. A. 2002, ApJ, 564, L39
- Sramek & Weiler (2003) Sramek, R. A. & Weiler, K. W. 2003, in Lecture Notes in Physics, Berlin Springer Verlag, Vol. 598, Supernovae and Gamma-Ray Bursters, ed. K. Weiler, 145–169
- Truelove & McKee (1999) Truelove, J. K. & McKee, C. F. 1999, ApJS, 120, 299
- van Dyk et al. (1994) van Dyk, S. D., Weiler, K. W., Sramek, R. A., Rupen, M. P., & Panagia, N. 1994, ApJ, 432, L115
- Wang & Wheeler (2008) Wang, L. & Wheeler, J. C. 2008, ARA&A, 46, 433
- Weiler et al. (2002) Weiler, K. W., Panagia, N., Montes, M. J., & Sramek, R. A. 2002, ARA&A, 40, 387
- Winkler et al. (2009) Winkler, P. F., Twelker, K., Reith, C. N., & Long, K. S. 2009, ApJ, 692, 1489
- Woosley et al. (2002) Woosley, S. E., Heger, A., & Weaver, T. A. 2002, Reviews of Modern Physics, 74, 1015
- Young et al. (2006) Young, P. A., et al. 2006, ApJ, 640, 891