Multi-Epoch HST Observations of IZw18: Characterization of Variable Stars at Ultra-Low Metallicities.111Based on observations with the NASA/ESA Hubble Space Telescope, obtained at the Space Telescope Science Institute, which is operated by AURA Inc., under NASA contract NAS 5-26555.
Abstract
Variable stars have been identified for the first time in the very metal-poor Blue Compact dwarf galaxy IZw18, using deep multi-band (F606W, F814W) time-series photometry obtained with the Advanced Camera for Surveys (ACS) on board the Hubble Space Telescope (HST). We detected 34 candidate variable stars in the galaxy. We classify three of them as Classical Cepheids, with periods of 8.71, 125.0 and 130.3 days, respectively, and other two as long period variables with periodicities longer than a hundred days. These are the lowest metallicity Classical Cepheids known so far, thus providing the opportunity to explore and fit models of stellar pulsation for Classical Cepheids at previously inaccessible metallicities. The period distribution of the confirmed Cepheids is markedly different from what is seen in other nearby galaxies, which is likely related to the star bursting nature of IZw18. The long period Cepheids we have detected in IZw18 seem to indicate that massive stars at the metallicity of IZw18 (Z=0.0004) may cross the instability strip long enough to be observed.
By applying to the 8.71 days Cepheid theoretical Wesenheit () relations based on new pulsation models of Classical Cepheids specifically computed for the extremely low metallicity of this galaxy (Z=0.0004, Y=0.24), we estimate the distance modulus of IZw18 to be = 31.4 0.3 (D=19.0 Mpc) for canonical models of Classical Cepheids, and of 31.2 0.3 mag (D= Mpc) using over luminous models. The theoretical modeling of the star’s light curves provides 0.2 mag, D=19.0 Mpc, in good agreement with the results from the theoretical Wesenheit relations. These pulsation distances bracket the distance of 18.2 Mpc inferred by Aloisi et al. (2007) using the galaxy’s Red Giant Branch Tip.
Subject headings:
— galaxies: individual (IZw18) — stars: variables: other - Classical Cepheids — distance scale — galaxies: Blue Dwarf Galaxy — techniques: photometry1. Introduction
Discovered by Searle et al. (1973) more than thirty years ago the Blue Compact Dwarf galaxy IZw18 remains one of the most metal poor (1/50 Z⊙, Skillman & Kennicutt, 1993) and intriguing objects in the local Universe. The galaxy is very rich in gas content and blue stars. These two features both suggested that IZw18 might be undergoing its first episode of star formation, thus representing one of the best local analogs to primordial galaxies in the distant Universe.
Several HST studies by different authors have tried to characterize the evolutionary status of IZw18, with rather discordant results. Aloisi et al. (1999) were the first to detect Asymptotic Giant Branch (AGB) stars in the galaxy, and thus to demonstrate that IZw18 is as old as several hundreds Myr, at least, using HST Wide Field Planetary Camera 2 (WFPC2) data. Izotov & Thuan (2004) failed to detect red giant branch (RGB) stars in IZw18, based on HST/ACS observations of the galaxy. However, Momany et al. (2005) and Tosi (2006), based on a re-analysis of the same ACS data set, suggested that IZw18 is older than previously believed, since they found some evidence for the galaxy’s RGB Tip around 27 mag. Our new time-series HST/ACS data (HST program Id. 10586, PI: Aloisi) have allowed us to definitively solve the mystery on the age of IZw18, by pinning down the galaxy’s distance, using Classical Cepheids that we detected for the first time in this galaxy. The distance to IZw18 inferred from the Classical Cepheids is in very good agreement with the independent estimate obtained from the galaxy’s red giant branch (RGB) Tip ( Mpc), which is identified by Aloisi et al. (2007) at mag (for an assumed Galactic foreground extinction of =0.032 mag, and shows that IZw18 is further away than previously thought. In this paper we present in detail the variable stars we have identified in IZw18 and discuss in particular the galaxy’s Classical Cepheids. Observations and data reduction are described in Section 2. The techniques applied to identify candidate variable stars and derive their periodicities are described in Section 3. The properties of the IZw18 confirmed variable stars are presented in Section 4, while the distance inferred from the Classical Cepheids is presented in Section 5. Finally, our results and conclusions are summarized in Section 6.
2. Observations and data reductions
Time series imaging of IZw18 in the F606W (broad ) and F814W () filters was obtained with the Wide Field Channel of the Advanced Camera for Surveys (ACS/WFC) on board the HST in 13 different epochs properly spread over a time interval of 96 days from 2005 October to 2006 January. The time window and the scheduling of the single epoch observations were specifically devised to allow the discovery and characterization of Classical Cepheids with periods shorter than 100 days, if present.
Each epoch consisted of four optimally dithered single exposures per filter, that we corrected for geometric distortion and co-added by using the MultiDrizzle software, to produce single images per epoch per filter, totaling about 35-37 minute integration time per epoch, and total integration times, over the 13 epochs, of and hours in F606W and F814W, respectively. The proprietary data were complemented by archival F555W () and F814W ACS/WFC images of IZw18 from HST program Id. 9400 (PI Thuan), obtained in 2003, May-June, over a time span of 11 days, thus gaining three and five additional epochs in the F814W and F555W filters, respectively. The additional data allowed us to increase the number of available phase-points on the light curves to 15 in F814W, 13 in F606W and five in F555W and to extend the time interval beyond the 96 days spanned by the proprietary observations. This is valuable to pin down periods longer than the time window covered by the proprietary data, and to reveal long period variability. The log of the observations for both proprietary and archival data is provided in Table 1.
The severe crowding of the IZw18 images, the demand of achieving the maximum possible depth in the color magnitude diagram (CMD), and the need of processing the single epoch data to generate light curves for the candidate variables, made the photometric reduction of our data very challenging and time-consuming, and the use of PSF-fitting photometry mandatory. To produce the galaxy CMD, we built four coadded images by stacking all single epoch images per filter for both archival and proprietary data, separately. Then we performed PSF photometry of each of these four coadded images using the DAOPHOT/ALLSTAR package (Stetson, 1987). The resulting CMD was published by Aloisi et al. (2007). It contains 2100 sources having detection in all four deep images ( and for both datasets), and shows the galaxy’s RGB Tip at =27.27 0.14 mag.
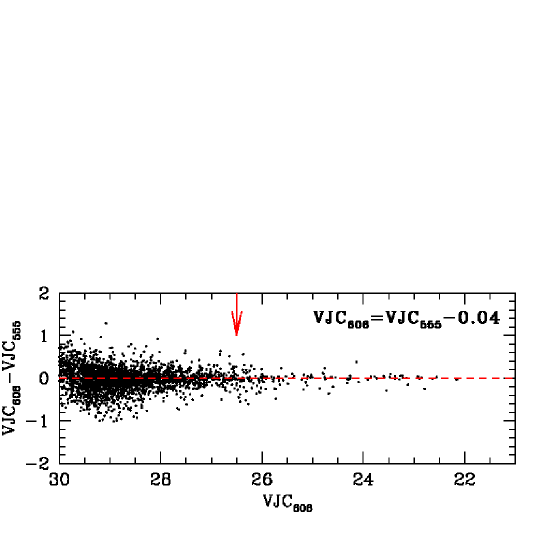
To produce light curves for the candidate variable objects we followed the approach described in the cookbook by Turner (1997) and used the MONTAGE package within DAOPHOTII/ALLSTAR/ALLFRAME (Stetson, 1987, 1994) to build a master frame out of the four coadded images obtained by Aloisi et al. (2007). Then we performed DAOPHOTII/ALLSTAR/ALLFRAME PSF photometry on each single epoch (15 and 18 images) using as a reference the catalogue of sources obtained from the master frame. The new photometry was calibrated to the F555W, F606W and F814W HST Vegamag system by using the IZw18 photometric catalogue presented in Aloisi et al. (2007) as a list of standard reference stars. Finally, the calibration to the Johnson-Cousins photometric system was obtained using the transformations given by Sirianni et al. (2005) (see Aloisi et al., 2007, , for details). The F606W and F555W photometry were calibrated to the Johnson-Cousins photometric system separately, and the resulting standard magnitudes compared. The result of this comparison is shown in Figure 1, for colors redder than 0.4 mag, which roughly corresponds to the average color inside the classical instability strip (IS) in IZw18.
A zero point shift was found to exist between the two -calibrated photometry for magnitudes brighter than V=26.5 mag. (see arrow in Figure 1). In fact, the magnitudes derived from the calibration of the F606W data () are on average mag brighter than the magnitudes derived from the calibration of the F555W data (). Since the F555W filter more closely resembles the photometric passband of the Johnson-Cousins photometry, and the F606W fluxes might be somewhat overestimated because of non-negligible gas contamination, the magnitudes were corrected for this zero point and tied to the ones. The photometric reductions with DAOPHOTII/ALLSTAR/ALLFRAME produced a new CMD of IZw18 which contains about 7000 sources, all having photometric errors mag and parameter222The SHARP parameter is related to the intrinsic angular size of the object image and measures the regularity and symmetry of the PSF stellar profile. in the range from to , and reaches 30.0 mag, i.e. about half a magnitude fainter than the Aloisi et al. (2007) CMD. The new CMD is shown in Figure 2. We note that a fraction of the additional stars in our CMD populate the blue plume of IZw18, and that some of them appear to be bluer than the Padua tracks. An eye inspection of a map of IZw18 confirms that these are likely gas contaminated stars, usually located in gas-rich regions and/or gas filaments.
3. Variable star identification and period search
We used four independent approaches to identify variable stars in IZw18 and to select bona fide variables from false detections. First we applied to our proprietary F606W and F814W data sets the Optical Image Subtraction Technique as performed within the package ISIS 2.2 (Alard, 2000). This method has shown to be very powerful to detect variables in highly crowded stellar fields such as the main body of IZw18 (see e.g., Baldacci et al., 2005). With this approach we obtained a list of candidate variables and differential flux light curves, on which to perform the period search. However, the under-sampling of the ACS/WFC images revealed a very challenging issue for ISIS. The number of sources flagged as candidate variables was extraordinary large, making the check of the individual objects extremely time-consuming and difficult.
Moreover, inspection of the images revealed that ISIS had very often failed to distinguish real stars from spurious sources, galaxies and background noise.
We then used the new DAOPHOTII/ALLSTAR/ALLFRAME photometry of the single-epoch data and an output parameter of ALLFRAME, the Welch-Stetson variability index (see Welch & Stetson, 1993, and the cookbook) to flag candidate variable stars in the catalogue of measured sources returned by ALLFRAME. This second approach allowed us to pick up 66 candidate variables. All of them were already present in the list of variables detected by ISIS. However, by using the light curves in magnitude scales produced by ALLFRAME, it was much easier and straightforward to check the candidate variables than by working with the differential flux light curves of ISIS, where we lacked information on the actual amplitude of the light variation.
As a third approach, PSF-fitting photometry of the single epoch data was performed with DoPHOT (Schechter et al., 1993) and we used the package procedures, as discussed in Saha & Hoessel (1990), to search for periodic variables. Briefly, once we had star magnitudes at several epochs, variable star candidates were detected as the sources whose data points had a large scatter in the MAG vs MAG plane (where MAG is the difference between magnitudes at two different epochs) and good parameters of sharpness and goodness-fit criteria (). To make the flag as candidate variable more robust, the empirical scatter was compared with the average error estimated by DoPHOT. This procedure was applied to several frame pairs. The scattering data points were then checked by eye. They often revealed spurious variable sources, due to the difficulty of performing a reliable PSF-fitting photometry in IZw18.
Finally, identification of candidate sources was also performed by visual inspection of the F606W and F814W images by one of us (A.S.). In this approach each pixel is the value calculated from the corresponding pixels in the co-registered target images at all epochs. The stability of the HST/ACS PSF, combined with the careful registration of the images makes it possible to visualize the variable objects very effectively. The co-registered images in the same passband can be stacked as a data cube, with each layer in the “z” direction as one of the time epochs. An estimate of the noise in each pixel of this data cube is obtained from the Poisson statistics and the read noise of the detectors. From the variance of each pixel along the “z” direction, and the noise estimates as above, a is obtained, thus producing a image. All of the definite variables identified in this paper are clearly visible as pixel groupings with high values in the images. We have not attempted a detailed PSF analysis of these “stars”, but visually, the majority of these enhancements appear as compact and “round” structures, with sizes consistent with that of single stars. Note that the level of enhancement corresponds to the statistical significance for variability, and objects that are relatively very faint can show up prominently. Note also that several enhancements which are consistent with the “footprint” of single stars, appear in the central body of IZw18. In these areas, the crowding makes it impossible to perform any photometry, or even de-blend individual stars in the actual images. It is thus unfortunate that even though the maps show the presence of variable stars so cleanly in such confused regions, they remain inaccessible to further analysis. The image approach is an extension of the “difference image” method for identifying variables. It would eliminate the need to compare images pair-wise, allowing rather to look for statistically significant variability in multi-epoch data, while preserving the information provided by the correlation between neighboring pixels due to the PSF. Clearly, the method bears further investigation and development.
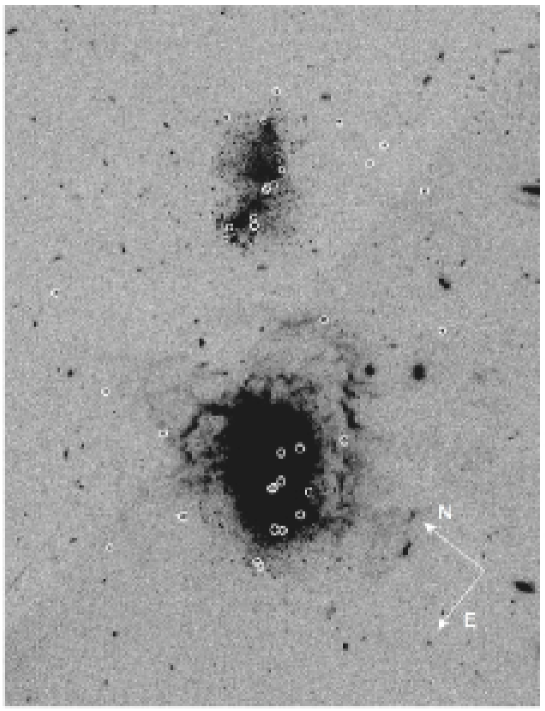
Candidate variable stars found by the four independent procedures described above were counter identified by coordinates, returning a final catalogue of 34 bona fide candidates showing light variations larger than three times the photometric error at their average magnitude, that we retained for further analysis. Nineteen out of the 34 candidates lie on and around the main body of IZw18, the remaining 15 ones on the galaxy secondary body. Figure 3 shows the location of the 34 candidate variables on a map of IZw18.
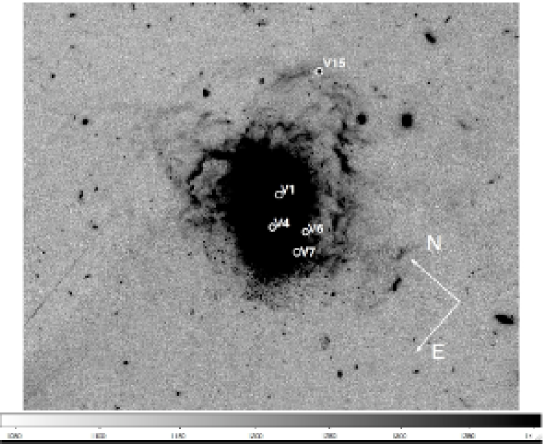
Period search and study of the light curves for the bona fide candidate variables were performed using an iterative procedure that we applied to the F814W, F606W and F555W instrumental magnitudes, separately. A first guess of the star’s periodicity was obtained using the Phase Dispersion Minimization (PDM) algorithm, within the IRAF environment, making a quick search over a large time interval ranging from 2-3 days to about 200 days. The period refinement was then obtained with the Graphical Analyzer of Time Series (GRaTiS), a private software developed at the Bologna Observatory (see e.g., Clementini et al., 2000), which uses both the Lomb periodogram (Lomb, 1976; Scargle, 1982) and the best fit of the data with a truncated Fourier series (e.g., Barning, 1963). First we run GRaTis on the 15 epochs of the 2003+2007 F814W data set deriving a period that we used to phase the F555W and F606W light curves, and iteratively improved by comparing the light curves in the three different pass-bands. Candidate variables showing the same consistent periodicity in all the three bands were confirmed as bona fide variable stars, while the other stars remained potential candidates. This procedure allowed us to select, among the 34 candidates, 5 variable stars with consistent light curves in all the three filters. These five bona fide variables are listed in Table 2 and plotted as red filled triangles in Figure 2. Their position on the body of IZw18 is shown in Figure 4. Four of them (V1,V4, V6 and V7) lie on the galaxy main body. The fifth one, V15, is on a gas shell surrounding the main body and pointing towards the direction of IZw18 secondary body. The 5 confirmed variables are further discussed in Section 4.
For the remaining 29 objects (see Table 3) we only have an identification, the mean , magnitudes provided by ALLFRAME, and a rough indication of the light variation in the F606W and F814W bands, since several of these objects lie in areas where crowding makes it impossible to perform a reliable photometry of the single epoch data. We also note that although many of the objects in Table 3 show significant multi band light variations, for most of them the light curve does not match the curve for the same period. This is likely due to crowding that makes the counter identification of an object in different photometric bands rather uncertain, and to stellar blending, which affects in different ways the star magnitude, depending on the photometric band. It could also be possible that some of these candidate variables are in unresolved stellar associations. The candidate variable stars are shown as orange filled circles in Figure 2.
4. IZw18 confirmed variable stars
The time series data of the five bona fide variable stars were calibrated to the Johnson-Cousins photometric system following the general procedure described in Section 2 and properly taking into account the color variation of the variable stars during the pulsation cycle. In practice, we associated to each phased F555W and F606W data point the F814W value read, at the same phase, from the model best fitting the F814W data, and to each phased F814W data point the F606W value at same phase read from the model best fitting the F606W data. The magnitudes derived from the F606W photometry were corrected for the 0.04 mag zero point shift before combining them to the F555W calibrated photometry to derive the average magnitudes of the variable stars over the pulsation cycle. The time-series photometry of the 5 confirmed variables is provided in Table 4 which is published in its entirety in the electronic edition of the journal.
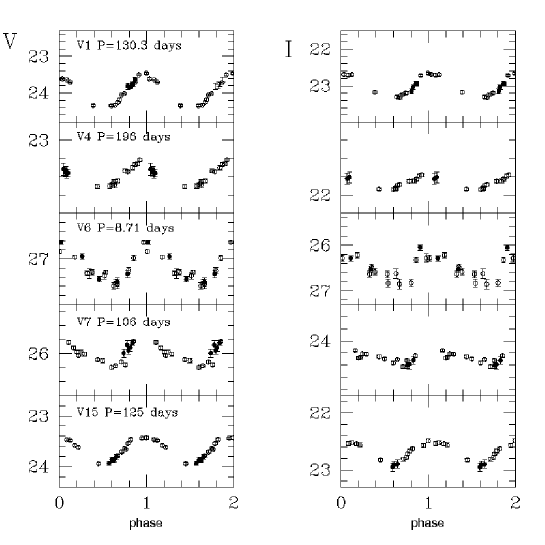
Results from the analysis of the 5 confirmed variables are summarized in Table 2, where for each star we provide identification number, coordinates, period, time of maximum light of the data, intensity-averaged mean magnitudes and colors, amplitudes in the and bands of the Johnson-Cousins photometric system, and amplitude ratios. Figure 5 shows the Johnson-Cousins light curves of the five confirmed variables, where data have been folded according to the periods and times of maximum light listed in Table 2. Error bars show the intrinsic errors of the PSF photometry, as computed by ALLFRAME, on the single epoch measurements. For the faintest variable star (V6) they are of the order of 0.09 mag in and 0.12 mag in . We note that only for V6 the pulsation cycle is repetitively covered by our observations, thus making the period determination robust. We estimate an uncertainty of the order of 0.08 days on the period of this star. The other 4 confirmed variables all have long periodicities exceeding the time window covered by the proprietary data. Although the addition of the archival data allowed us to improve the period determination, for these stars we find more uncertain periods than for V6.
For the longer period variables we first used the Lomb algorithm within GRaTiS to explore a period interval ranging from a few days up to 300-500 days, and chose, as usual, the most likely period as that corresponding to the highest peak in the star’s power spectrum. The period definition was then refined using the truncated Fourier algorithm. In general, given the smooth and sinusoidal shape of the light curves, 2 harmonics were sufficient to best fit the data. According to the width of the highest peaks in the power spectra of V1 and V15, the accuracy of the derived periodicities is of the order of 1day. However, it should be noted that both these two stars also have lower peaks in the power spectra corresponding to P=113 and 152 days for V1, and P=110 and 146 days for V15. We are inclined to attribute these alternative periodicities to the windowing of the data. However, only further time-series covering much longer time windows could allow us to constrain the actual periods.
The period definition is more uncertain for V4 and V7. Indeed, the Lomb periodogram would favor a period around 165 days for V7, while the truncated Fourier series favors a shorter period of 106 days. Our data do not allow us to distinguish between these two periodicities. For practical purposes we adopted the shorter period to fold the light curve data, but this period should be taken with caution.
Similarly, the very long period of V4 (196 days) significantly exceeds the time window covered by the proprietary data (96 days), and after addition of the archival data yet we apparently covered only the rising branch of the star light curve, thus rendering the period determination very uncertain. The highest peak in the power spectrum of V4 is double peaked, with two equally possible periodicities of 187 and 196 days. Moreover, several other longer periods exceeding the 200 days are also possible. We used the 196 period to fold the ligh curve data; however, as with V7, the period of V4 should be considered only a tentative estimate.
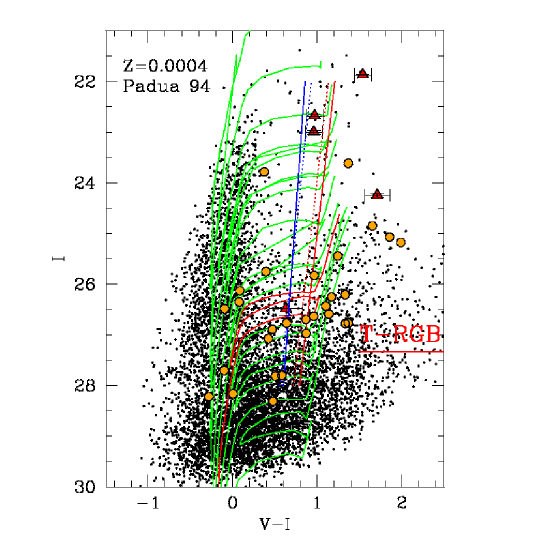
In order to classify the bona fide variable stars in types we have used the following three diagnostics: (i) the star’s pulsation period; (ii) the shape, the morphology, and the amplitude ratios of the light curves; (iii) the location on the galaxy’s CMD in comparison with evolutionary tracks by the Padua group (Fagotto et al., 1994, ; hereafter Padua94) for the mass range from 5 to 60 M⊙ (solid curves in Figure 2). The Cepheid candidates were also compared with the theoretical boundaries of the classical instability strip (IS) specifically computed for the extremely low metallicity of IZw18 (Z=0.0004, Y=0.24, Marconi et al. 2010 accepted on ApJ, hereafter M10), and for two different choices of the mixing length parameter, namely, =1.5 and 2 (solid and dashed lines in Figure 2).
Three out of the five variable stars, namely V1, V6 and V15, have light curves closely matching those of Classical Cepheids. Figure 2 shows the location of the five variable stars on the CMD of IZw18 obtained by the present analysis. The confirmed variable stars (filled triangles in Figure 2) are plotted according to their intensity-averaged mean magnitudes and colors, obtained by weighting over the star pulsation cycle and, with the exception of V4 and V7, occupy a region of the galaxy CMD well confined in color. Both V1 and V15 in the CMD lie well inside the boundaries of the theoretical IS for Cepheids at the metallicity and reddening of IZw18, while the faintest of the three variables, star V6, lies close to the blue edge of the predicted IS, but still within the 1 confidence level. We note that the amplitude of V6 seems to be slightly small compared to the amplitude (see columns 8, 10 and 11 of Table 2). The blue color and the slightly small amplitude could be explained if the star were contaminated by an unresolved blue companion or by gas. and sharpness parameters of V6 do not seem to differ from those of a regular single stellar source, but the star is clearly located in a gas rich region (see Figure 4), thus could easily be contaminated by gas. The large throughput of the F606W filter towards emitting gas wavelengths along with V6 intrinsic faintness could thus have conspired to render the star color bluer than normal.
In summary, the different diagnostics all consistently suggest a classification as Classical Cepheids for V1, V6 and V15. However, of the three stars only V6 (P=8.71 days) has periodicity similar to the typical period ranges commonly observed for Classical Cepheids in and outside the Milky Way. This star also safely falls below the period of P 10 days, where a break has been suggested to occur in the Period Luminosity relation of Classical Cepheids (see, e.g. Ngeow & Kanbur, 2004; Ngeow et al., 2009; Sandage et al., 2004). V1 and V15 instead have rather long periods, which, so far, have been observed only very rarely among Classical Cepheids. In a recent paper, Bird et al. (2009) list the very long period Classical Cepheids known so far, which they name ultra-long period (ULP) Cepheids. Bird et al. (2009) list includes a total number of 18 ULP Cepheids with periods in the range from 83.0 to 210.4 days, distributed over five galaxies, namely, the Large and Small Magellanic Clouds, NGC300, NGC6822, and IZw18, referring to preliminary results for V1 and V15 that we published (Fiorentino et al., 2008). Inspection of the literature light curves compiled by Bird et al. (2009) reveals that those of the ULP Cepheids seem to be more sinusoidal and to have a stronger dependence on wavelength than their classical “short” period counterparts. In most of the cases the band light curves show a sort of plateau rather than the peak at maximum light observed in the -band light curves. However, the amplitude ratios, AI/AV, do not seem to differ significantly from those of Classical Cepheids in standard period ranges (see last column of Table 2).
As already noted in Bird et al. (2009), the “theoretical” interpretation of ULP Cepheids like the bright and long period Cepheids detected in IZw18 poses some problems. In fact the current set of nonlinear convective pulsation models fails to predict pulsation periods longer than about 90 days at this metal content for masses in the typical range of Classical Cepheids (M M⊙; see discussion in M10) and current evolutionary calculations do not predict the existence of a blue loop at so high luminosity levels (see discussion below). Nevertheless, we emphasize the importance of studying Classical Cepheids at the very low metallicity of IZw18 to constrain the still unexplored properties of the period-luminosity (PL) relation in very poor metallicity regimes. This topic is addressed in M10, where we have combined the new pulsation models computed to study the IZw18 Cepheids with previous sets of models at higher metal abundance (Marconi et al., 2005, , and references therein) to constrain the metallicity dependence of the Cepheid PL relation in the low metallicity regime (Z from 0.0004 to 0.008).
The other two confirmed variables in IZw18, V4 and V7, have both rather red colors. Indeed, V7 is the reddest of our confirmed variables with =1.71 mag. The star lies about 3 magnitudes above the RGB Tip of IZw18 in the expected region of TP-AGB stars. The position in the CMD, the long period and the shape of the light curve suggest that the star could be a long period variable (LPV) of Mira type.
The fifth variable, star V4, is one of the brightest and reddest objects in the IZw18 CMD. Only a portion of the star light curve is covered by our observations, thus both period and amplitudes of the light variation are very uncertain. Although the brightness and shape of the light curve could suggest the classification of V4 as a Cepheid, the very red color places the star well outside the typical color range of Classical Cepheids. The uncertainty of the period, which anyway appears to be extraordinarily long for a Classical Cepheid, and the rather red color, which seems intrinsic and not due to contamination by a red companion, suggest to adopt a conservative classification as LPV, and to not use the star to estimate the distance to IZw18.
The theoretical evolutionary tracks shown in Figure 2 span from the post-Main Sequence up to the early Asymptotic Giant Branch evolutionary phase, thus covering both the phase of central Helium and shell Hydrogen burnings. In this phase an intermediate-mass star crosses the pulsation IS while performing the blueward excursion usually called “blue loop”, and thus can be observed as Classical Cepheid. According to the Padua94 models, the evolutionary track that within the uncertainties most closely reproduces the range in magnitude and color spanned by the Cepheid with P=8.71 days ( mag, and mag, respectively) corresponds to (red line in Figure 2). The Padua tracks include a mild overshooting resulting in blue loops brighter by about 0.25 dex than tracks withouth overshooting such as the ones predicted by canonical evolutionary scenarios [see also http://astro.df.unipi.it/SAA/PEL/Z0.html]. In the canonical assumption, the same luminosity level is attained for higher stellar masses closer to .
On the other hand, the brighter Cepheids should have masses larger than 15 M⊙. However, the 20 M⊙ track crosses the IS in the very fast phase of central Helium exhaustion, and the coarse distribution in mass of models between 15 and 20 M⊙ does not allow us to distinguish the largest mass that performs the “blue loop” within the IS. The long period Cepheids we have detected in IZw18 seem to indicate that massive stars at the metallicity of IZw18 (Z=0.0004) may cross the instability strip long enough to be observed. Whether this occurs during the “blue loop” or not should be further investigated from a theoretical point of view by both stellar evolution and pulsation models. Blue loops are not predicted for massive stars by current stellar models, but are invoked by Bird et al. (2009) for the case of HV829, proposed to be a “second crossing” ULP Cepheid in the SMC (Z=0.004).
5. The distance to IZw18 from Classical Cepheids
In the following we apply theoretical Wesenheit (WPL) relations, based on the new pulsation models computed by M10, to the Classical Cepheid with d (V6), to constrain the distance modulus of IZw18. We do not apply the same relation to the Cepheids with longer periods because pulsation models fail to predict such very long periods at this chemical composition. However, extrapolation of the predicted WPL relations to the very long periods of V1 and V15 seems to well reproduce the data (see M10 for details). Moreover, given the small number of Cepheids identified in IZw18, it is not safe to use the PL relations, which are known to provide reliable results only when applied to statistically significant samples, and we prefer to use instead pulsation relations that can be applied to individual Cepheids, such as the PLC and the WPL (Madore, 1982) relations. In particular, the latter has the advantage of being reddening-free by definition (see Madore, 1982; Caputo et al., 2000, , for details).
A further method to measure the distance modulus of IZw18, based on our new pulsation models, is the light curve model fitting technique (see e.g., Bono et al., 2002; Marconi & Clementini, 2005; Keller & Wood, 2006; Natale et al., 2008, and reference therein). In the following subsections we will discuss and use these two methods, separately, and will then compare their results with the distance to IZw18 derived by Aloisi et al. (2007) from the RGB Tip method.
5.1. Theoretical Wesenheit relations
Updated reddening free theoretical () WPL relations have been derived from our new theoretical pulsation models with Z=0.0004 and Y=0.24 (M10) using both a canonical and a non-canonical (overluminous by about 0.25 dex in ) assumption on the evolutionary Mass-Luminosity relation (see M10 for details):
1.54()=2.58(0.12)3.49(0.03)log+0.84(0.10)
with =0.12 mag and =0.25 dex, if we use overlouminous models, thus including both canonical and overluminous solutions.
By applying this new WPL relation to V6 we obtain =31.40.3 mag (D=19.0 Mpc) in the canonical assumption, and =31.2 0.3 mag (D= Mpc) from overluminous models. The distance moduli obtained by the WPL relations bracket the RBG Tip modulus of IZw18 obtained by Aloisi et al. (2007) (=31.300.17 mag), and all three values are consistent within the errors.
5.2. Light curve model fitting
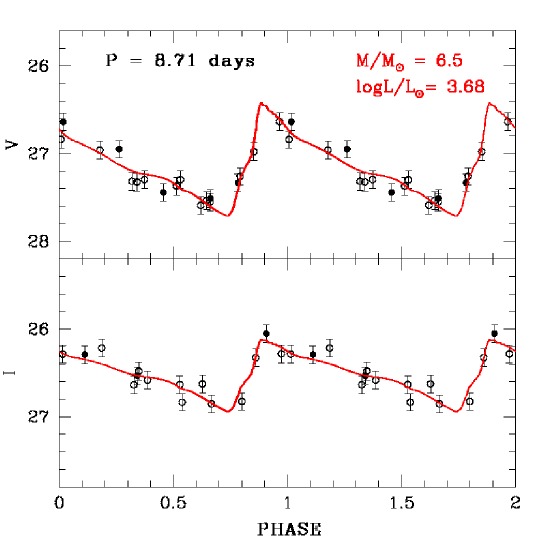
The nonlinearity of our pulsation code allows us to predict the variation of all the relevant physical quantities of a variable star along the pulsation cycle and, in particular, to model the shape and morphology of the light curves of individual Cepheids. This capability can be used to theoretically fit the observed light curves, thus providing another estimate of the stellar parameters and the corresponding distance modulus of the host galaxy. This technique was already applied with success to both RR Lyrae stars and Classical Cepheids (see e.g., Bono et al., 2002; Marconi & Clementini, 2005; Keller & Wood, 2006; Natale et al., 2008, and reference therein). Here, we have applied the method to V6, using the new pulsation models by M10. In particular, we explored the mass range from 5.9 to 6.8 M⊙, as suggested by the comparison with different sets of canonical and non-canonical evolutionary models, and computed isoperiodic sequences of pulsation models by varying both the luminosity and the effective temperature.
The results of the fitting procedure are shown in Figure 6, where we compare the observed light curves (filled circles) to our best fit model (solid lines), that is the model minimizing the mean residuals with respect to the observed curves in both and bands. The best fit model has input parameters: M=6.5 M⊙, 3.68 dex and T5855 K, corresponding to apparent distance moduli of 31.5 0.2 mag in both bands, where the uncertainty includes both the internal dispersion of the fit and the observational errors. Therefore, by correcting the obtained and values for the assumed Galactic foreground extinction we find =31.4 0.2 mag. The distance modulus derived with the model fitting technique is in good agreement with the results obtained from the application of the WPL relations and the RGB Tip method.
Taking into account all the pulsation models that fit the light curves within a mean residual mag, we can estimate the theoretical uncertainties on the intrinsic stellar parameters of the best fit model. We find that luminosities from 3.64 to 3.69 dex in and effective temperatures from 5800 to 6000 K are allowed, for our selection of masses (5.9 to 6.8 ). These masses, luminosities, and effective temperatures are in good agreement, within the uncertainties, with the values predicted by stellar evolution models (see discussion in Section 4). In particular, our result that the best fit model corresponds to a stellar mass of 6.5 seems to support a canonical evolutionary scenario.
6. Discussion and Conclusions
We have identified and derived periods for five variable stars in the blue compact dwarf galaxy IZw18, among a list of 34 candidates, based on time series images of the galaxy obtained with the Advanced Camera for Surveys on board the HST. Three of the variable stars are Classical Cepheids, the remaining 2 are very red objects that we tentatively classify as long period variables.
The distance to IZw18 was estimated from the Classical Cepheids using theoretical Wesenheit relations specifically computed for the very low metal abundance of the galaxy, and by theoretically fitting the observed light curves of the 8.71 days Cepheid. The Wesenheit relations provide an average distance modulus for IZw18 of 31.4 0.3 mag (D=19.0 Mpc) adopting a canonical ML relation and of 31.2 0.3 mag (D= Mpc) when a overluminosity of 0.25 dex (in ) is assumed for each given mass. The theoretical modeling of the 8.71 days Cepheid light curves provides: 31.4 0.2 mag (D=19.0 Mpc).
The Cepheid-based distance estimates are fully consistent within the errors with the distance modulus of 31.30 0.17 mag, obtained by Aloisi et al. (2007) from a totally independent distance indicator, namely, the RGB Tip of IZw18.
Classical Cepheids and the RGB Tip of IZw18 both consistently indicate that the galaxy is much further away than previously thought, in turn supporting the suggestion by Aloisi et al. (2007) that IZw18 is at least as old as about 2 Gyrs.
The number of Classical Cepheids we were able to identify in IZw18 is undoubtedly very small, compared to the galaxy richness in gas and blue stars. Also noticeable is the lack in IZw18 of Classical Cepheids with periods intermediate between the 10 and 100 days. As a matter of fact the CMD of IZw18 does not appear to containn many stars within and/or close to the theoretical boundaries of the IS (see Figure 2). As an additional check we searched for variability all the stars that lie in this region of the CMD, but did not succeed to identify any further reliable candidate.
The gap in periods, as well as in luminosities, of the Cepheids in IZw18 could be related, as discussed in Aloisi et al. (2007), to the starbursting nature of IZw18. In fact, although very active in very recent epochs, the galaxy may lack a significant Star Formation (SF) at the epochs when the missing Cepheids should have formed. Indeed, once we scale the SF history derived by Aloisi et al. (1999) from their assumed distance of 10 Mpc for IZw18 to the 18.2 Mpc distance derived by Aloisi et al. (2007), we expect few stars in the mass range from 6 to 20 M⊙ (corresponding to pulsation periods from 10 to 120 days) currently into the IS. A detailed derivation of the SF history of IZw18 from the new data is in progress (Annibali et al. 2010, in preparation).
References
- Alard (2000) Alard, C. 2000, A&AS, 144, 363
- Aloisi et al. (1999) Aloisi, A., Tosi, M., & Greggio, L. 1999, AJ, 118, 302
- Aloisi et al. (2007) Aloisi, A., et al. 2007, ApJ, 667, L151
- Baldacci et al. (2005) Baldacci, L., Rizzi, L., Clementini, G., & Held, E. V. 2005, A&A, 431, 1189
- Barning (1963) Barning, F. J. M. 1963, Bull. Astron. Inst. Netherlands, 17, 22
- Bird et al. (2009) Bird, J. C., Stanek, K. Z., & Prieto, J. L. 2009, ApJ, 695, 874
- Bono et al. (2002) Bono, G., Castellani, V., & Marconi, M. 2002, ApJ, 565, L83
- Caputo et al. (2000) Caputo, F., Marconi, M., & Musella, I. 2000, A&A, 354, 610
- Clementini et al. (2000) Clementini, G., et al. 2000, AJ, 120, 2054
- Fagotto et al. (1994) Fagotto, F., Bressan, A., Bertelli, G., & Chiosi, C. 1994, A&AS, 104, 365
- Fiorentino et al. (2008) Fiorentino, G., et al. 2008, Memorie della Societa Astronomica Italiana, 79, 461
- Izotov & Thuan (2004) Izotov, Y. I., & Thuan, T. X. 2004, ApJ, 616, 768
- Keller & Wood (2006) Keller, S. C., & Wood, P. R. 2006, ApJ, 642, 834
- Lomb (1976) Lomb, N. R. 1976, Ap&SS, 39, 447
- Madore (1982) Madore, B. F. 1982, ApJ, 253, 575
- Marconi & Clementini (2005) Marconi, M., & Clementini, G. 2005, AJ, 129, 2257
- Marconi et al. (2005) Marconi, M., Musella, I., & Fiorentino, G. 2005, ApJ, 632, 590
- Momany et al. (2005) Momany, Y., et al. 2005, A&A, 439, 111
- Natale et al. (2008) Natale, G., Marconi, M., & Bono, G. 2008, ApJ, 674, L93
- Ngeow & Kanbur (2004) Ngeow, C., & Kanbur, S. 2004, in Bulletin of the American Astronomical Society, Vol. 36, Bulletin of the American Astronomical Society, 1402–+
- Ngeow et al. (2009) Ngeow, C., Kanbur, S. M., Neilson, H. R., Nanthakumar, A., & Buonaccorsi, J. 2009, ApJ, 693, 691
- Saha & Hoessel (1990) Saha, A., & Hoessel, J. G. 1990, AJ, 99, 97
- Sandage et al. (2004) Sandage, A., Tammann, G. A., & Reindl, B. 2004, A&A, 424, 43
- Scargle (1982) Scargle, J. D. 1982, ApJ, 263, 835
- Schechter et al. (1993) Schechter, P. L., Mateo, M., & Saha, A. 1993, PASP, 105, 1342
- Searle et al. (1973) Searle, L., Sargent, W. L. W., & Bagnuolo, W. G. 1973, ApJ, 179, 427
- Sirianni et al. (2005) Sirianni, M., et al. 2005, PASP, 117, 1049
- Skillman & Kennicutt (1993) Skillman, E. D., & Kennicutt, Jr., R. C. 1993, ApJ, 411, 655
- Stetson (1987) Stetson, P. B. 1987, PASP, 99, 191
- Stetson (1994) —. 1994, PASP, 106, 250
- Tosi (2006) Tosi, M. 2006, in The Local Group as an Astrophysical Laboratory, ed. M. Livio & T. M. Brown, 215–225
- Welch & Stetson (1993) Welch, D. L., & Stetson, P. B. 1993, AJ, 105, 1813
| 2003-05-26 | 8100 | 2786.129397 | F555W | GO 9400 |
|---|---|---|---|---|
| 2003-05-29 | 8100 | 2788.995991 | F814W | ” |
| 2003-05-30 | 11120 | 2790.301071 | F555W | ” |
| 2003-05-31 | 8100 | 2790.995864 | F814W | ” |
| 2003-06-01 | 8100 | 2791.995813 | F555W | ” |
| 2003-06-03 | 8100 | 2793.795690 | F555W | ” |
| 2003-06-05 | 8100 | 2795.928907 | F814W | ” |
| 2003-06-06 | 8100 | 2796.879372 | F555W | ” |
| 2005-10-02 | 2140/2140 | 3646.074922/3646.200173 | F606W/F814W | GO 10586 |
| 2005-10-29 | 2140 | 3673.354491 | F606W | ” |
| 2005-11-04 | 2140/2196 | 3679.215186/3679.282332 | F606W/F814W | ” |
| 2005-11-08 | 2140/2196 | 3683.344260/3683.411429 | F606W/F814W | ” |
| 2005-11-10 | 2140/2196 | 3685.208977/3685.276123 | F606W/F814W | ” |
| 2005-11-13 | 2140/2196 | 3688.11391273688.189299 | F606W/F814W | ” |
| 2005-11-18 | 2140/2196 | 3692.577572/3692.653076 | F606W/F814W | ” |
| 2005-12-03 | 2140/2196 | 3708.326761/3708.381510 | F606W/F814W | ” |
| 2005-12-10 | 2140/2196 | 3714.535979/3714.649539 | F606W/F814W | ” |
| 2005-12-20 | 2140/2196 | 3725.390374/3725.456858 | F606W/F814W | ” |
| 2005-12-25 | 2140/2196 | 3730.251196/3730.318190 | F606W/F814W | ” |
| 2006-01-01 | 2140/2196 | 3737.110567/3737.177722 | F606W/F814W | ” |
| 2006-01-06 | 2008/2056 | 3742.035879/3742.103508 | F606W/F814W | ” |
a HJD is the Helicocentric Julian Day of observation at mid exposure.
| (2450000) | / | |||||||||
|---|---|---|---|---|---|---|---|---|---|---|
| V1 | 9:34:1.94 | 55:14:25.87 | 130.3 | 3726.00 | CC | 23.96 | 0.91 | 23.00 | 0.65 | 0.71 |
| V4 | 9:34:2.30 | 55:14:24.17 | 196.0 | 2777.00 | LPV | 23.41 | 0.29 | 21.87 | 0.15 | 0.52 |
| V6 | 9:34:2.07 | 55:14:21.23 | 8.71 | 3685.15 | CC | 27.11 | 0.85 | 26.48 | 0.63 | 0.74 |
| V7 | 9:34:2.33 | 55:14:20.49 | 106.0 | 3662.00 | LPV | 25.96 | 0.49 | 24.25 | 0.25 | 0.54 |
| V15 | 9:34:0.46 | 55:14:31.31 | 125.0 | 3715.055 | CC | 23.65 | 0.54 | 22.68 | 0.41 | 0.76 |
a Variable stars were given increasing numbers with increasing the distance from the
galaxy center which was set at and (J2000.0).
b Coordinates have been measured on the HST image j9ej01010_drz.fits.
c CC = Classical Cepheid; LPV = long period variable.
d AV and AI indicate the amplitude of the light variation in the and bands, respectively.
| V2 | 9:34:01.76 | 55:14:24.75 | 28.170.10 | 0.90 | 28.160.16 | 0.86 |
|---|---|---|---|---|---|---|
| V3 | 9:34:02.19 | 55:14:24.03 | 26.430.04 | 0.71 | 26.350.10 | 0.64 |
| V5 | 9:34:02.31 | 55:14:24.25 | 26.150.04 | 0.65 | 25.750.16 | 0.70 |
| V8 | 9:34:01.35 | 55:14:22.08 | 26.500.03 | 0.27 | 24.850.03 | 0.30 |
| V9 | 9:34:02.65 | 55:14:21.37 | 26.790.11 | 0.90 | 25.830.16 | 0.81 |
| V10 | 9:34:02.59 | 55:14:20.78 | 26.390.03 | 0.50 | 26.490.07 | 0.51 |
| V11 | 9:34:02.67 | 55:14:35.87 | 28.380.06 | 1.46 | 27.800.11 | 0.95 |
| V12 | 9:34:03.24 | 55:14:29.00 | 28.790.08 | 0.62 | 28.310.17 | 0.35 |
| V13 | 9:34:03.06 | 55:14:20.61 | 27.730.04 | 0.66 | 26.590.07 | 0.71 |
| V14 | 9:34:03.08 | 55:14:20.13 | 26.930.03 | 0.25 | 25.070.05 | 0.66 |
| V16 | 9:34:02.74 | 55:14:42.78 | 27.170.03 | 0.87 | 25.180.05 | 1.24 |
| V17 | 9:34:04.05 | 55:14:32.45 | 28.130.05 | 0.81 | 26.770.07 | 0.81 |
| V18 | 9:33:59.67 | 55:14:21.82 | 27.410.06 | 1.11 | 26.770.13 | 1.02 |
| V19 | 9:34:00.53 | 55:14:43.74 | 27.940.04 | 0.98 | 28.220.10 | 0.88 |
| V20 | 9:34:00.19 | 55:14:42.60 | 27.360.03 | 0.69 | 26.890.05 | 0.67 |
| V21 | 9:34:00.38 | 55:14:44.26 | 27.600.03 | 1.02 | 27.700.11 | 1.45 |
| V22 | 9:34:00.14 | 55:14:43.05 | 26.210.03 | 0.34 | 26.130.07 | 0.66 |
| V23 | 9:33:59.78 | 55:14:43.99 | 24.980.03 | 0.40 | 23.620.04 | 0.20 |
| V24 | 9:34:02.25 | 55:14:52.83 | 27.500.04 | 0.35 | 27.080.13 | 0.35 |
| V25 | 9:33:59.75 | 55:14:44.04 | 24.160.05 | 0.74 | 23.780.12 | 1.00 |
| V26 | 9:33:59.68 | 55:14:43.64 | 28.320.06 | 1.12 | 27.810.12 | 0.93 |
| V27 | 9:33:59.49 | 55:14:44.08 | 27.540.05 | 0.71 | 26.430.05 | 0.71 |
| V28 | 9:33:58.60 | 55:14:32.22 | 27.560.06 | 0.90 | 26.700.12 | 1.15 |
| V29 | 9:33:58.77 | 55:14:38.00 | 27.420.04 | 0.80 | 26.250.06 | 1.25 |
| V30 | 9:33:58.51 | 55:14:38.07 | 27.600.05 | 0.83 | 26.680.11 | 0.75 |
| V31 | 9:33:59.22 | 55:14:48.50 | 26.690.05 | 0.30 | 25.450.05 | 0.44 |
| V32 | 9:33:59.46 | 55:14:51.53 | 28.110.06 | 1.12 | 26.780.09 | 1.26 |
| V33 | 9:33:58.65 | 55:14:42.92 | 27.540.04 | 0.62 | 26.210.05 | 1.09 |
| V34 | 9:33:58.87 | 55:14:49.45 | 27.840.05 | 0.70 | 26.970.10 | 1.69 |
a Variables were given increasing numbers with increasing the distance from the
galaxy center.
| Star V6 - Classical Cepheid - P=8.71 days | |||
| HJD | HJD | ||
| (2450000) | (2450000) | ||
| 2786.129397 | 27.330.08 | 2788.995991 | 26.290.08 |
| 2790.301071 | 26.950.06 | 2790.995864 | 26.530.07 |
| 2791.995813 | 27.440.06 | 2795.928907 | 26.050.09 |
| 2793.795690 | 27.510.10 | 3646.200173 | 26.630.06 |
| 2796.879372 | 26.640.04 | 3679.282332 | 26.640.07 |
| 3646.074922 | 27.370.07 | 3683.411429 | 26.830.06 |
| 3673.354491 | 27.530.07 | 3685.276123 | 26.290.12 |
| 3679.215186 | 27.320.06 | 3688.189299 | 26.480.07 |
| 3683.344260 | 27.260.06 | 3692.653076 | 26.330.11 |
| 3685.208977 | 26.840.04 | 3708.381510 | 26.850.06 |
| 3688.113912 | 27.320.10 | 3714.649539 | 26.580.09 |
| 3692.577572 | 26.980.05 | 3725.456858 | 26.630.08 |
| 3708.326761 | 27.550.10 | 3730.318190 | 26.220.06 |
| 3714.535979 | 27.300.06 | 3737.177722 | 26.280.06 |
| 3725.390374 | 27.590.09 | 3742.103508 | 26.840.06 |
| 3730.251196 | 26.960.04 | – | – |
| 3737.110567 | 26.630.03 | – | – |
| 3742.035879 | 27.300.05 | – | – |
A portion of Table 4 is shown here for guidance regarding its form and content. The entire catalog is available in the electronic edition of the journal.