A multifrequency study of the large radio galaxies 3C46 and 3C452
Abstract
We present low-frequency observations starting from 150 MHz with the Giant Metrewave Radio Telescope (GMRT), and high-frequency observations with the Very Large Array (VLA) of two large radio galaxies 3C46 and 3C452. These observations were made with the objectives of estimating their spectral ages and examining any evidence of diffuse extended emission at low radio frequencies due to an earlier cycle of activity. While no evidence of extended emission due to an earlier cycle of activity has been found, the spectral ages have been estimated to be 15 and 27 Myr for the oldest relativistic plasma seen in the regions close to the cores for 3C46 and 3C452 respectively. The spectra in the vicinity of the hotspots are consistent with a straight spectrum with injection spectral indices of 1.0 and 0.78 respectively, somewhat steeper than theoretical expectations.
keywords:
galaxies: active – galaxies: jets – galaxies: nuclei – quasars: general – radio continuum: galaxies1 Introduction
Large double-lobed radio galaxies, the largest of which are the giant radio sources (GRSs), defined to be those which have a projected linear size 1 Mpc (Ho=71 km s-1 Mpc-1, =0.27, =0.73, Spergel et al. 2003), are useful for studying the late stages of evolution of radio sources and possible episodic activity in these objects, constraining orientation-dependent unified schemes and probing the intergalactic medium at different redshifts (e.g. Subrahmanyan & Saripalli 1993; Subrahmanyan, Saripalli & Hunstead 1996; Mack et al. 1998; Ishwara-Chandra & Saikia 1999; Kaiser & Alexander 1999; Blundell, Rawlings & Willott 1999 and references therein; Schoenmakers et al. 2000, 2001; Singal, Konar & Saikia 2004). In addition, large radio sources are useful for studying the effects of electron energy loss in the lobe plasma due to inverse-Compton scattering with the Cosmic Microwave Background Radiation (CMBR) photons at different redshifts (e.g. Konar et al. 2004), make independent estimates of the magnetic field from the inverse-Compton scattered X-ray flux density from the lobes (e.g. Croston et al. 2005; Konar et al. 2009) and spectral as well as dynamical ageing analyses to understand the evolution of the sources (e.g. Konar et al. 2006, 2008; Jamrozy et al. 2008; Machalski, Jamrozy & Saikia 2009).


We have selected two large radio galaxies with prominent bridges, 3C46 and 3C452, for making detailed radio images with the Giant Metrewave Radio Telescope (GMRT) at low frequencies going down to 150 MHz. We have also used archival Very Large Array (VLA) data to make higher-frequency images of these two sources. The twin objectives of this study were to look for diffuse emission at low frequencies from an earlier cycle of activity and estimate the spectral ages of the lobes from data over a large frequency range. Combining the lowest-frequency available data with high-frequency data gives the most reliable estimates of the injection spectral indices (), and also spectral ages from the break frequency. For examining emission from an earlier cycle of activity, it is relevant to note that evidence of episodic activity is seen usually in large radio sources (e.g. Schoenmakers et al. 2000; Saikia, Konar & Kulkarni 2006, and references therein) but not in the small sources even at low radio frequencies (Sirothia et al. 2009).
The radio galaxy 3C46 (J0135+3754), which has a very close companion galaxy (de Vries et al. 1998), is at a redshift of 0.4373 (Smith & Spinrad 1980) and has a largest angular size of 150 arcsec which corresponds to 846 kpc, and a total radio luminosity of log P1.4GHz (W Hz-1) = 27.01 (Konar et al. 2004). VLA B- and C-array images at L-band (Gregorini et al. 1988; Vigotti et al. 1989) and the D-array image at C-band (Konar et al. 2004) show the extended lobes of emission with an edge-brightened structure. de Koff et al. (2000) report evidence of a dust lane lying across the nucleus with the radio axis being nearly perpendicular to it.
3C452 (J2245+3941) is at a redshift of 0.0811 (Schmidt 1965), and has a moderately strong core with a flux density of 130 mJy at 5 GHz (Riley & Pooley 1975), and two edge-brightened lobes separated by 252 arcsec which corresponds to 381 kpc. The total radio luminosity at 1.4 GHz is log P1.4GHz (W Hz-1) = 26.53. There is a suggestion of a faint dust lane near the nucleus leading to the dumbell shape (de Koff et al. 2000). The axis defined by the radio lobes and the core is perpendicular to the proposed dust lane. Very Long Baseline Interferometric (VLBI) observations of the nuclear source show a reasonably symmetric structure with the central peak being identified with the core. The jet symmetry and the prominence of the possible core suggests that the source is oriented at an angle larger than 60∘ to the line of sight ( Giovannini et al. 2001). Gupta & Saikia (2006) have reported the discovery of Hi absorption towards the radio core of 3C452 from GMRT observations of the source.
| Source | Teles- | Array | Obs. | Phase | Obs. |
|---|---|---|---|---|---|
| cope | Conf. | Freq. | Calib. | Date | |
| MHz | |||||
| (1) | (2) | (3) | (4) | (5) | (6) |
| 3C46 | GMRT | 153 | 3C48 | 2007 Dec 07 | |
| 3C46 | GMRT | 240 | 3C48 | 2007 Jun 09 | |
| 3C46 | GMRT | 332 | 3C48 | 2008 Feb 23 | |
| 3C46 | GMRT | 606 | 3C48 | 2007 Jun 09 | |
| 3C46 | VLAa | BnC | 1465 | 2254+247 | 2000 Mar 13 |
| 3C46 | VLAa | D | 4841 | 2250+143 | 2000 Jul 24 |
| 3C46 | VLAa | D | 8460 | 2251+158 | 1998 Jan 24 |
| 3C452 | GMRT | 153 | 2350+646 | 2007 Dec 08 | |
| 3C452 | GMRT | 240 | 2350+646 | 2005 May 30 | |
| 3C452 | GMRT | 332 | 2350+646 | 2008 Jan 02 | |
| 3C452 | GMRT | 606 | 2350+646 | 2005 May 30 | |
| 3C452 | GMRT | 1314 | 2202+422 | 2005 Dec 10 | |
| 3C452 | VLAa | D | 4910 | 2253+417 | 1995 Apr 11 |
| 3C452 | VLAa | D | 8350 | 2255+420 | 1995 Apr 11 |
a archival data from the VLA
2 Observations and analyses
Both the GMRT and the VLA observations were made in the standard fashion, with each target source observations interspersed with observations of the phase calibrator. The primary flux density and bandpass calibrator was 3C48 and/or 3C286 at the different frequencies, with all flux densities being on the scale of Baars et al. (1977). The total observing time on the source is about a few hours for the GMRT observations while for the VLA observations the time on source ranges from a few minutes to 10 minutes. The low-frequency GMRT data were sometimes significantly affected by radio frequency interference, and these data were flagged. All the data were analysed in the standard fashion using the NRAO AIPS package. For the GMRT observations, besides flagging bad data, the steps followed include gain calibration of one spectral channel data, bandpass calibration and channel averaging to obtain the continuum data base. These were then imaged and CLEANed using multiple facets for the different low-frequency GMRT observations. All the data were self calibrated to produce the final images, which were then corrected for the gain of the primary beam.
The observing log for both the GMRT and the VLA observations is given in Table 1 which is arranged as follows. Columns 1 and 2 show the name of the source and the telescope; column 3 gives the array configuration for the VLA observations; column 4 shows the frequency of the observations in MHz, column 5 lists the phase calibrators used for the different observations, while column 6 lists the dates of the observations. For the VLA observations of 3C452 at 8350 MHz, there were two sets of observations, one pointed towards each lobe.


3 Observational results
The GMRT and VLA images of 3C46 are presented in Fig. 1 while those of 3C452 are presented in Fig. 2. The observational parameters and some of the observed properties are presented in Table 2, which is arranged as follows. Column 1: Name of the source; column 2: frequency of observations in units of MHz, with the letter G or V representing either GMRT or VLA observations; columns 3–5: the major and minor axes of the restoring beam in arcsec and its position angle (PA) in degrees; column 6: the rms noise in units of mJy beam-1; column 7: the integrated flux density of the source in mJy. We examined the change in flux density by specifying different areas around the source and found the difference to be within a few per cent. The flux densities at different frequencies have been estimated over similar areas. Columns 8, 11 and 14: component designation, where W, E and C denote the western, eastern and core components respectively; columns 9 and 10, 12 and 13, and 15 and 16: the peak and total flux densities of each of the components in units of mJy beam-1 and mJy respectively. For the 8350-MHz observations of 3C452, the flux density of the lobe which was at the pointing centre is reliable and has been listed. The superscript indicates that the flux densities have been estimated from a two-dimensional Gaussian fit to the core component. The spectra of the extended emission after subtracting the core flux density at frequencies larger than 1400 MHz are shown in Fig. 3 along with the fits to the data using the SYNAGE package (Murgia et al. 1999). The total flux densities are from Laing & Peacock (1980) and our measurements.
4 Discussion and results
4.1 Radiative losses
In the high-luminosity FRII radio sources, as the jets of relativistic plasma traverse outwards initially through the interstellar medium of the host galaxy and later through the intracluster and intergalactic medium, they dissipate their energy at their leading edges. This gives rise to the intense regions of emission called ‘hotspots’. The relativistic particles flow out from the hotspots to form the extended lobes of radio emission, so that the radiating particles closest to the hotspot are the youngest while those farthest from it are the oldest. The radio continuum spectra in different parts of an extended radio source contain information about the various energy losses and gains of the radiating particles during the lifetime of the source. If there is no significant reacceleration within these lobes and no significant mixing of particles, there should be a spectral gradient across the radio source. The hotspots where the particles are being accelerated should have the flattest spectral index, reflecting the injection spectral index , while the spectrum should steepen with increasing distance from the hotspot. Since the high-energy particles lose energy more rapidly, the steepening in the spectrum would be seen more clearly at high frequencies. This trend has been reported in several studies and used to estimate the radiative ages and expansion velocities in the powerful 3CR sources (e.g. Myers & Spangler 1985; Alexander & Leahy 1987; Leahy, Muxlow & Stephens 1989; Carilli et al. 1991; Liu, Pooley & Riley 1992), in the low-luminosity and medium-luminosity radio galaxies (e.g. Klein et al. 1995; Parma et al. 1999), giant radio sources (Konar et al. 2008; Jamrozy et al. 2008 and references therein) and compact steep-spectrum sources (Murgia et al. 1999). However, there are several caveats in the interpretation which one needs to bear in mind. These include details of the backflow of the lobe material, difficulties in disentangling the different energy losses of the radiating particles and variations of the local magnetic field (e.g. Wiita & Gopal-Krishna 1990; Rudnick, Katz-Stone & Anderson 1994; Eilek & Arendt 1996; Jones, Ryu & Engel 1999; Blundell & Rawlings 2000).
| Source | Freq. | Beam size | rms | SI | Cp | Sp | St | Cp | Sp | St | Cp | Sp | St | ||
| MHz | ′′ | ′′ | ∘ | mJy | mJy | mJy | mJy | mJy | mJy | mJy | mJy | ||||
| beam-1 | beam-1 | beam-1 | beam-1 | ||||||||||||
| (1) | (2) | (3) | (4) | (5) | (6) | (7) | (8) | (9) | (10) | (11) | (12) | (13) | (14) | (15) | (16) |
| 3C46 | G153 | 28.5 | 16.0 | 65 | 6.9 | 10880 | W | 2325 | 6029 | C | E | 1852 | 4899 | ||
| G240 | 13.2 | 8.1 | 48 | 4.3 | 6806 | W | 771 | 3821 | C | E | 721 | 3099 | |||
| G332 | 10.3 | 9.1 | 69 | 0.54 | 5957 | W | 725 | 3172 | C | E | 734 | 2689 | |||
| G606 | 5.2 | 3.8 | 48 | 0.23 | 2051 | W | 157 | 1537 | C | E | 277 | 1402 | |||
| V1465 | 13.8 | 12.7 | 12 | 0.61 | 1202 | W | 253 | 640 | C | E | 197 | 590 | |||
| V4841 | 13.9 | 11.6 | 166 | 0.15 | 355 | W | 76 | 185 | Cg | 1.2 | 1.1 | E | 60 | 172 | |
| V8460 | 7.7 | 6.9 | 32 | 0.04 | 183 | W | 25 | 88 | Cg | 1.6 | 1.8 | E | 30 | 94 | |
| 3C452 | G153 | 24.1 | 18.1 | 32 | 8.7 | 81142 | W | 4341 | 38725 | C | E | 3909 | 42366 | ||
| G240 | 13.1 | 11.8 | 34 | 4.5 | 55706 | W | 1810 | 27589 | C | E | 1825 | 28422 | |||
| G332 | 14.9 | 8.3 | 134 | 2.6 | 37703 | W | 967 | 18191 | C | E | 862 | 18724 | |||
| G606 | 6.7 | 4.4 | 98 | 0.68 | 24369 | W | 207 | 11246 | C | E | 251 | 11893 | |||
| G1313 | 16.4 | 10.5 | 65 | 0.92 | 11565 | W | 518 | 5110 | Cg | 213 | 203 | E | 503 | 5677 | |
| V4910 | 17.0 | 12.6 | 85 | 0.44 | 3318 | W | 209 | 1435 | Cg | 153 | 213 | E | 188 | 1399 | |
| V8350W | 16.8 | 11.7 | 94 | 0.06 | 1860 | W | 151 | 860 | Cg | 121 | 145 | E | |||
| V8350E | 16.8 | 11.2 | 93 | 0.07 | 1865 | W | Cg | 134 | 151 | E | 137 | 816 | |||


Nevertheless, these provide useful inputs towards understanding the different physical processes which play a role in the evolution of these radio sources. The large radio sources are particularly suitable for the classical spectral-ageing analysis due to their large angular extent which can be covered by a significant number of resolution elements. Combining low-frequency information from the GMRT along with high-frequency ones from the VLA is likely to yield the most reliable estimates of the spectral break frequency, as has been demonstrated in a number of recent studies (Konar et al. 2008; Jamrozy et al. 2008 and references therein).
4.2 Spectral ageing analysis
The observed spectra have been fitted using the Jaffe & Perola (1973, JP) and the Kardashev-Pacholczyk (Kardashev 1962; Pacholczyk 1970; KP) models using the SYNAGE package (Murgia et al. 1999). As reported by Jamrozy et al. (2008), there is no significant difference between these two models over the frequency range of our observations, and the JP model tends to give a better fit to the different strips in the lobes than with the continuous injection (Kardashev 1962; CI) model. The CI model sometimes gives a somewhat better fit in the area of a prominent hotspot, but since with the resolution of our observations the flux density of the hotspots are contaminated by lobe emission it does not make a significant difference.
Assuming that (i) the magnetic field strength in a given lobe is constant throughout the energy-loss process, (ii) the particles injected into the lobe have a constant power-law energy spectrum with an index , and (iii) the time-scale of isotropization of the pitch angles of the particles is short compared with their radiative lifetime, the spectral age, , is given by
| (1) |
where =0.318(1+)2 is the magnetic field strength equivalent to the cosmic microwave background radiation. Here , the magnetic field strength of the lobes, and are expressed in units of nT, is the spectral break frequency in GHz above which the radio spectrum steepens from the initial power-law spectrum given by =. Alexander & Leahy (1987) and Alexander (1987) have suggested that the effects of expansion losses may be neglected.
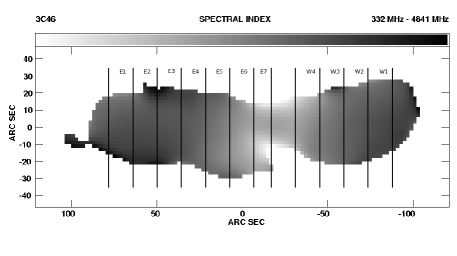
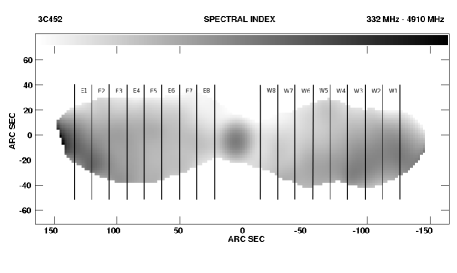
To estimate the values of for the two sources, we fit the JP model to the flux densities of the entire lobes, treating as a free parameter as well as the total flux density measurements of the source which go to lower frequencies (Laing & Peacock 1980) than our measurements. These yield injection spectral indices of 1.00 and 0.78 for 3C46 and 3C452 respectively (Fig. 3). Having estimated the values, the total-intensity images of 3C46 and 3C452 have been convolved to a common resolution of 14 and 17 arcsec respectively to be consistent with the lowest-resolution image for all images at 240 MHz and above. The 150-MHz images have not been used for this analysis since their resolution is coarser by another factor of two, and we wish to have at least 10 resolution elements along the axis of the source. Each lobe is then split into a number of strips as shown in Fig. 4, separated approximately by the resolution element along the axis of the source, and also ensuring that the core component lies between two vertical lines and can be subtracted reliably. The extreme strips are centred at the peaks of brightness on the convolved maps. Both these sources have prominent bridges of emission, and we have also fitted the spectrum to the central region of the source after subtracting the flux density of the radio core. Using the SYNAGE software we determine the best fit to the spectrum in each strip from 240 to 8000 MHz using the JP model, and derive the relevant value of . A few examples of the fits to the different strips of both the lobes in 3C46 and 3C452 are presented in Figs. 5 and 6 respectively, while the fits to the central regions of the source, which as expected show the lowest values of are presented in Fig. 7.


| Strip | Dist. | B | |||
| (kpc) | (GHz) | nT | (Myr) | ||
| Western lobe | |||||
| W1 | 316 | 5.42 | 1.64 | ||
| W2 | 237 | 1.78 | 1.35 | ||
| W3 | 158 | 1.71 | 1.35 | ||
| W4 | 79 | 0.34 | 1.34 | ||
| Eastern lobe | |||||
| E1 | 519 | 10.2 | 1.50 | ||
| E2 | 440 | 11.4 | 1.36 | ||
| E3 | 361 | 5.1 | 1.20 | ||
| E4 | 282 | 1.0 | 1.12 | ||
| E5 | 203 | 0.9 | 1.26 | ||
| E6 | 124 | 0.2 | 1.30 | ||
| E7 | 56 | 4.1 | 1.22 | ||
| Central-core | |||||
| 44 | 1.28 |
| Strip | Dist. | B | |||
| (kpc) | (GHz) | nT | (Myr) | ||
| Western lobe | |||||
| W1 | 197 | 9.87 | 0.76 | ||
| W2 | 173 | 0.71 | 0.83 | ||
| W3 | 150 | 0.71 | 0.79 | ||
| W4 | 126 | 0.49 | 0.77 | ||
| W5 | 103 | 0.18 | 0.80 | ||
| W6 | 79 | 1.12 | 0.81 | ||
| W7 | 56 | 3.71 | 0.82 | ||
| W8 | 32 | 8.81 | 0.80 | ||
| Eastern lobe | |||||
| E1 | 194 | 8.30 | 0.76 | ||
| E2 | 171 | 2.64 | 0.80 | ||
| E3 | 147 | 3.13 | 0.82 | ||
| E4 | 123 | 5.47 | 0.83 | ||
| E5 | 100 | 1.88 | 0.83 | ||
| E6 | 76 | 0.22 | 0.84 | ||
| E7 | 53 | 0.53 | 0.83 | ||
| E8 | 29 | 0.88 | 0.79 | ||
| Central-core | |||||
| 5.18 | 0.83 |


In order to estimate the spectral ages, we have to estimate the magnetic-field strength. We have estimated the magnetic field strength by integrating the spectrum from a frequency corresponding to a minimum Lorentz factor, 10 for the relativistic electrons to an upper limit of 100 GHz, which corresponds to a Lorentz factor ranging from a few times 104 to 105 depending on the estimated magnetic field strength (see Hardcastle et al. 2004; Croston et al. 2005; Konar et al. 2008, 2009). It has also been assumed that the filling factors of the lobes are unity, and the energetically dominant particles are the radiating particles only, neglecting the contribution of the protons. We have assumed a cylindrical geometry for the entire lobe, and have estimated the magnetic field for the entire lobe as well as for individual strips of emission each separated by approximately a beamwidth along the long axis of each source. The magnetic field strengths for each strip are listed in Tables 3 and 4 for 3C46 and 3C452 respectively. The magnetic field strengths for the western and eastern lobes of 3C46 are 1.66 and 1.53 nT while the corresponding values for 3C452 are 0.86 and 0.88 nT respectively. The equipartition magnetic fields are usually within a factor of 2 of those estimated from inverse-Compton scattering of the radiating electrons by the microwave background radiation (e.g. Croston et al. 2005; Konar et al. 2009). For the giant radio source 3C457, the spectral ages estimated from the equipartition magnetic field and the field estimated from the inverse-Compton scattered X-ray emission are similar (Konar et al. 2009).
The results of our spectral ageing analysis for 3C46 and 3C452 are tabulated in Tables 3 and 4 respectively, which are arranged as follows. Column 1: identification of the strip, column 2: projected distance of the centre of the strip from the radio core in units of kpc, column 3: break frequency of the spectrum of the strip according to the JP model in units of GHz, column 4: reduced value of the fit, column 5: magnetic-field strength in units of nT, and column 6: spectral age of particles in the strip. The strips close to the hotspots are consistent with having straight spectra and the SYNAGE fits yield spectral breaks at frequencies larger than several hundred GHz. Our observations show no spectral break till 10 GHz. In Tables 3 and 4 we have listed the values corresponding to a break frequency of 100 GHz for these strips. Observations at mm wavelengths are required to determine reliably the spectral breaks in these regions. The spectral age increases with distance from the hotspot for both sources, with the maximum spectral ages estimated for 3C46 and 3C452 being 15 and 27 Myr in the regions closest to the core (Fig. 8).
4.3 Search for episodic activity
The outer diffuse lobes from an earlier cycle of activity in sources with episodic activity are expected to have a steep spectra due to radiative and adiabatic losses. This has been observationally demonstrated in some cases such as J1453+3308 (Konar et al. 2006) and 4C29.30 (Jamrozy et al. 2008). Therefore, ideally one should be able to detect these features more easily at low frequencies. Our low-frequency images show the prominent bridges of emission but no diffuse features that could be attributed to an earlier cycle of activity. In the case of 3C46, a diffuse component of say 20 mJy at 153 MHz and a spectral index of 1 would have a surface brightness similar to the rms noise in the 8460-MHz image. The corresponding value for 3C452 is 8 mJy at 153 MHz. These values would increase by a factor of 2 and 7 for spectral indices of 1.2 and 1.5 respectively. With the rms noise values of 6.9 and 8.7 mJy beam-1 at 153 MHz for 3C46 and 3C452 respectively, diffuse emission not seen at the highest frequency could have been just about detected in 3C46. However, for 3C452 only steeper spectrum emission with a spectral index of 1.4 could have been detected. While it is important to make more sensitive images at the lowest frequencies, the non-detection of extended emission due to an earlier cycle of activity in these two sources, is consistent with the trend that such objects are rare even amongst large radio sources (cf. Schoenmakers et al. 2000; Saikia et al. 2006).
5 Concluding remarks
The maximum spectral ages determined for 3C46 and 3C452 are 15 and 27 Myr respectively, which is similar to the values of Jamrozy et al. (2008) obtained for a sample of 10 large radio galaxies by combining GMRT and VLA data. Their values range from 6 to 36 Myr with a median value of 20 Myr using the classic equipartition magnetic fields. These estimates are significantly older than those of smaller sources (e.g. Leahy et al. 1989; Liu et al. 1992), and broadly consistent with the tendency for spectral age to increase with the projected linear size (Jamrozy et al. 2008 and references therein).
The injection spectral indices are 1.0 and 0.78, compared with the values ranging from 0.55 to 0.88 with a median value of 0.6 for the sample of Jamrozy et al. (2008). Our estimates for 3C46 and 3C452, which have prominent hotspots, are consistent with the higher values in the sample of Jamrozy et al. (2008), and studies of smaller FRII sources studied by Leahy et al. (1989) and Liu et al. (1992). Our estimates of the injection spectral indices appear steeper than theoretically expected values for a strong, non-relativistic shock in a Newtonian fluid where = 0.5 (Bell 1978a,b; Blandford & Ostriker 1978), or for different scenarios involving relativistic shocks where vary in the range of 0.35 to 0.65 (Heavens 1989; Kirk & Schneider 1987; Drury & Volk 1981; Axford, Leer & McKenzie 1982). High-resolution observations of these sources at even lower frequencies with future instruments should help in determining injection spectra more reliably.
Acknowledgments
We thank an anonymous reviewer for a very detailed report which has improved the paper significantly. SN and AP thank NCRA, TIFR for hospitality during the course of this work and DST, Government of India for financial support vide Grant No. SR/S2/HEP-17/2005. We thank Neeraj Gupta for providing the calibrated L-band GMRT data on 3C452. The GMRT is a national facility operated by the National Centre for Radio Astrophysics of the Tata Institute of Fundamental Research. We thank the staff for help with the observations. The National Radio Astronomy Observatory is a facility of the National Science Foundation operated under co-operative agreement by Associated Universities Inc. We thank the VLA staff for easy access to the archival data base. This research has made use of the NASA/IPAC extragalactic database (NED) which is operated by the Jet Propulsion Laboratory, Caltech, under contract with the National Aeronautics and Space Administration. We thank numerous contributors to the GNU/Linux group.
References
- [] Alexander P., 1987, MNRAS, 225, 27
- [] Alexander P., Leahy J.P., 1987, MNRAS, 225, 1
- [] Axford W.I., Leer E., McKenzie J.F., 1982, A&A, 111, 317
- [] Baars J.W.M., Genzel R., Pauliny-Toth I.I.K., Witzel A. 1977, A&A, 61, 99
- [] Bell A.R., 1978a, MNRAS, 182, 147
- [] Bell A.R., 1978b, MNRAS, 182, 443
- [] Blandford R.D., Ostriker J.P., 1978, ApJ, 221, L29
- [] Blundell K.M., Rawlings S., 2000, AJ, 119, 1111
- [] Blundell K.M., Rawlings S., Willott C.J., 1999, AJ, 117, 677
- [] Carilli C.L., Perley R.A., Dreher J.W., Leahy J.P., 1991, ApJ, 383, 554
- [] Croston J.H., Hardcastle M.J., Harris D.E., Belsole E., Birkinshaw M., Worrall D.M., 2005, ApJ, 626, 733
- [] de Koff S., et al., 2000, ApJS, 129, 33
- [] de Vries W. H., O’Dea C. P., Perlman E., Baum S. A., Lehnert M. D., Stocke J., Rector T., Elston R., 1998, ApJ, 503, 138
- [] Drury L. O’C., Völk J.H., 1981, ApJ, 248, 344
- [] Eilek J.A., Arendt P.N., 1996, ApJ, 457, 150
- [] Giovannini G., Cotton W.D., Feretti L., Lara L., Venturi T., 2001, ApJ, 552, 508
- [] Gregorini L., Padrielli L., Parma P., Gilmore G., 1988, A&AS, 74, 107
- [] Gupta N., Saikia D.J., 2006, MNRAS, 370, 80L
- [] Hardcastle M.J., Harris D.E., Worrall D.M., Birkinshaw M., 2004, ApJ, 612, 729
- [] Heavens A., 1989, in Radio Hotspots in Extragalactic Radio Sources, eds. K. Meisenheimer, H.-J. Röser, Sringer-Verlag, Heidelberg, p. 247
- [] Ishwara-Chandra C.H., Saikia D.J., 1999, MNRAS, 309, 100
- [] Jaffe W.J., Perola G.C., 1973, A&A, 26, 423
- [] Jamrozy M., Konar C., Machalski J., Saikia D.J., 2008, MNRAS, 385, 1286
- [] Jones T.W., Ryu D., Engel A., 1999, ApJ, 512, 105
- [] Kaiser C.R., Alexander P. 1999, MNRAS, 302, 515
- [] Kardashev N.S., 1962, SvA, 6, 317
- [] Kirk J.G., Schneider P., 1987, ApJ, 315, 425
- [] Klein U., Mack K.-H., Gregorini L., Parma P., 1995, A&A, 303, 427
- [] Konar C., Saikia D.J., Ishwara-Chandra C.H., Kulkarni V.K., 2004, MNRAS, 355, 845
- [] Konar C., Saikia D.J., Jamrozy M., Machalski, J., 2006, MNRAS, 372, 693
- [] Konar C., Jamrozy M., Saikia D.J., Machalski J., 2008, MNRAS, 383, 525
- [] Konar C., Hardcastle M., Croston J., Saikia D.J., MNRAS, 2009, 400, 480
- [] Laing R.A., Peacock J.A., 1980, MNRAS, 190, 903
- [] Leahy J.P., Muxlow T.W.B., Stephens P.W., 1989, MNRAS, 239, 401
- [] Liu R., Pooley G., Riley J.M., 1992, MNRAS, 257, 545
- [] Machalski J., Jamrozy M., Saikia D.J., 2009, MNRAS, 395, 812
- [] Mack K.-H., Klein U., O’Dea C. P., Willis A. G., Saripalli L., 1998, A&A, 329, 431
- [] Murgia M., Fanti C., Fanti R., Gregorini L., Klein U., Mack K.-H., Vigotti M., 1999, A&A, 345, 769
- [] Myers S.T., Spangler S.R., 1985, ApJ, 291, 52
- [] Pacholczyk A.G., 1970, Radio Astrophysics, W.H. Freeman & Co., San Francisco
- [] Parma P., Murgia M., Morganti R., Capetti A., de Ruiter H.R., Fanti R., 1999, A&A, 344, 7
- [] Riley J.M., Pooley G.G., 1975, MmRAS, 80, 105
- [] Rudnick L., Katz-Stone D., Anderson M., 1994, ApJS, 90, 955
- [] Saikia D.J., Konar C., Kulkarni V.K., 2006, MNRAS, 366, 1391
- [] Schmidt M., 1965, ApJ, 141, 1
- [] Schoenmakers A.P., Mack K.-H., de Bruyn A.G., Röttgering H.J.A., Klein U., van der Laan H., 2000, A&AS, 146, 293
- [] Schoenmakers A.P., de Bruyn A.G., Röttgering H.J.A., van der Laan H., 2001, A&A, 374, 861
- [] Singal A.K., Konar C., Saikia D.J., 2004, MNRAS, 347, 79L
- [] Sirothia S.K., Saikia D.J., Ishwara-Chandra C.H., Kantharia N.G., 2009, MNRAS, 392, 1403
- [] Smith H.E., Spinrad H., 1980, PASP, 92, 553
- [] Spergel D.N. et al., 2003, ApJS, 148, 175
- [] Subrahmanyan R., Saripalli L., 1993, MNRAS, 260, 908
- [] Subrahmanyan R., Saripalli L., Hunstead R.W., 1996, MNRAS, 279, 257
- [] Vigotti M., Grueff G., Perley R., Clark B.G., Bridle A.H., 1989, AJ, 98, 419
- [] Wiita P.J., Gopal-Krishna, 1990, ApJ, 353, 476