Confirmation of X-Ray Absorption by WHIM in the Sculptor Wall
Abstract
In a previous paper we reported a 3 detection of an absorption line from the Warm-Hot Intergalactic Medium (WHIM) using the Chandra and XMM X-ray grating spectra of the blazar H2356-309, the sight-line of which intercepts the Sculptor Wall, a large-scale superstructure of galaxies at . To verify our initial detection, we obtained a deep (500 ks), follow-up exposure of H2356-309 as part of the Cycle-10 Chandra Large Project Program. From a joint analysis of the Cycle-10 and previous (Cycle-8) Chandra grating data we detect the redshifted O VII WHIM line at a significance level of 3.4, a substantial improvement over the level reported previously when using only the Cycle-8 data. The significance increases to 4.0 when the existing XMM grating data are included in the analysis, thus confirming at higher significance the existence of the line at the redshift of the Sculptor Wall with an equivalent width of mÅ (90% confidence). We obtain a 90% lower limit on the O VII column density of and a 90% upper limit on the Doppler parameter of km s-1. Assuming the absorber is uniformly distributed throughout the Mpc portion of the blazar’s sight-line that intercepts the Sculptor Wall, that the O VII column density is (corresponding to km -1 where the inferred column density is only weakly dependent on ), and that the oxygen abundance is 0.1 solar, we estimate a baryon over-density of for the WHIM, which is consistent with the peak of the WHIM mass fraction predicted by cosmological simulations. The clear detection of O VII absorption in the Sculptor Wall demonstrates the viability of using current observatories to study WHIM in the X-ray absorption spectra of blazars behind known large-scale structures.
Subject headings:
BL Lacertae objects: individual (H 2356-309) — intergalactic medium — quasars: absorption lines — large-scale structure of universe — X-rays: diffuse background — X-rays: galaxies: clusters1. Introduction
The total amount of the luminous baryons in the nearby universe probed by the stellar light, narrow Ly absorption, as well as the X-ray emission from the hot intracluster and intragroup medium, accounts for at most 50% of the total baryonic matter in the low-redshift universe (e.g., Fukugita et al. 1998). Large-scale, cosmological hydrodynamic simulations predict that most of the “missing baryons” are distributed as filamentary structures between galaxies, in the form of a warm-hot intergalactic medium (WHIM; – K) (see, e.g., Fukugita et al. 1998; Davé et al. 1999; Cen & Ostriker 1999; 2006; Davé et al. 2001), with typical overdensity between 5 and 200111, where is the density of the WHIM at a given location, and is the mean density of the universe..
The first evidence of the WHIM gas came from the detection of highly ionized, ultraviolet absorption lines in the spectra of background quasars. With the Hubble Space Telescope (HST) and the Far Ultraviolet Spectroscopic Explorer (FUSE), a number of intervening O VI absorption systems were detected (see, e.g., Savage et al. 1998; Shull et al. 1998; Tripp & Savage 2000; Oegerle et al. 2000; Tripp et al. 2001; Savage et al. 2002; Sembach et al. 2004; Richter et al. 2004), for the first time revealing the existence of the WHIM gas (O VI is sensitive to gas at temperature between and K).
While the ultraviolet absorption lines detected in the background quasar spectra reveal its existence (see Tripp et al. 2006 for a review), the majority of the WHIM is expected to be in a temperature region that can only be studied in X-rays (e.g., Cen & Ostriker 1999; Davé et al. 2001). Since the launch of Chandra and XMM-Newton nearly a decade ago, combined high resolution imaging and spectroscopy has, for the first time, made the X-ray study of the WHIM possible. The diffuse hot plasma associated with the WHIM can be probed in X-ray emission and absorption, with each technique possessing certain advantages. The spatial distribution is most naturally revealed by imaging the X-ray emission. However, because of the low density of the WHIM gas and the contamination from the Galactic foreground, X-ray emission measurements are very challenging, and are therefore restricted to the highest density tail of the WHIM distribution (e.g., Soltan et al. 2002; Kaastra et al. 2003; Finoguenov et al. 2003; Zappacosta et al. 2005; Lieu & Mittaz 2005; Galeazzi et al. 2007; Takei et al. 2007; Werner et al. 2008). For example, the recent X-ray imaging study by Werner et al. (2008) of a massive binary cluster system obtained a 5 detection of WHIM between the clusters with an estimated baryon over-density of , which is larger than expected for the bulk of the WHIM gas (Davé et al. 2001; Cen & Ostriker 2006).
There are distinct advantages to studying the WHIM in X-ray absorption (Fang & Canizares 1997; Hellesten et al. 1998; Perna & Loeb 1998). In contrast to the X-ray emission which depends on , the column density of WHIM gas revealed in the X-ray absorption spectrum of a background quasar depends on , which is an advantage for the very low densities expected in the WHIM. Moreover, the Galactic foreground emission is dwarfed by the continuum of the quasar, while any foreground Galactic absorption line is easily separated in wavelength from the redshifted WHIM line at cosmological distance. However, the spectral resolution and flux sensitivity of existing X-ray grating spectrometers severely limit such studies. The first study using Chandra did not reveal any detections because the background quasars were too faint and thus did not produce spectra of high enough quality (Fang et al. 2001). In fact, most early attempts with Chandra were similarly unsuccessful (e.g., Fang et al. 2002; Mathur et al. 2003; McKernan et al. 2003; Fang et al. 2005).
The first report of a significant detection of the WHIM in X-ray absorption was made by Fang et al. (2002). Using the Low Energy Transmission Gratings (LETG) and the Advanced CCD Imaging Spectrometer (ACIS) combination in the Chandra X-ray Telescope, an O VIII absorption line produced by the intragroup medium of a small galaxy group along the sight line of PKS 2155-304 was detected with more than 4 confidence. This detection later was confirmed with more observations using the same instrumental set (Fang et al. 2007), along with several other independent analyses (e.g., Williams et al. 2005; Yao et al. 2009). However, this line was not detected when using the Chandra LETG with the high resolution camera (HRC), as well as the XMM-Newton X-ray telescope, although the upper limits from the non-detections are fully consistent with the detected line parameters (Williams et al. 2005; Fang et al. 2007). Despite the consistency between these different measurements, the failure to detect the line independently with multiple instruments has generated some skepticism (e.g., Richter et al, 2008). Nevertheless, given the crucial importance of a firm WHIM detection for our understanding of the cosmic baryon budget and structure formation, it is desirable that the result is not contingent only on a single instrument (nor, indeed, measurement) which could plausibly be affected by hitherto unrecognized systematic effects.
This point is underlined by the recent controversial claims of WHIM detections in X-ray absorption along the sightline to the unusually bright blazar, Mkn 421, while in outburst (Nicastro et al, 2005). Based on Chandra grating spectra, Nicastro et al. reported highly significant detections of two WHIM systems (at 3.5 and 5.8), which were not detected with a deep XMM-Newton RGS observation (Rasmussen et al. 2007). Although the RGS upper limits on the absorption-line column densities are consistent with the Chandra measurements, Kaastra et al. (2006) showed that the line significances reported by Nicastro et al. were inflated because insufficient redshift trials were employed to assess the statistical significance of the absorption systems, given that their redshifts were not known a priori. Kaastra et al.’s criticism highlights a fundamental limitation with the “blind”-search method, which has been the primary tool to search for WHIM in absorption. This technique involves observing bright background sources at random directions on the sky, in the hope that their line of sight intersects a WHIM filament, the redshift of which is a priori unknown.
An alternative strategy is to focus on known foreground structures that likely have associated WHIM. The advantage of this method is that the absorption signatures can be regarded as highly significant even if they are less prominent than those found in a random search, since the redshift of the absorber is known a priori from the redshift of the superstructure traced by its galaxies. Based on cosmological simulations of the local universe, Kravtsov et al. (2002) first proposed that the WHIM absorption lines are most likely to be detected in the local superstructure region. Fujimoto et al. (2004) first observed a quasar behind the Virgo Cluster, and found low-significance evidence of O VIII absorption from the foreground cluster. Takei et al. (2007) looked at an active galactic nucleus (AGN) behind the Coma Cluster, and also marginally detected O VIII and Ne IX absorption from the hot gas in the galaxy cluster.
In 2007 we performed such a ”targeted” study of the WHIM by observing the blazar, H 2356-309 (), with Chandra and XMM. The blazar’s sight-line passes through multiple large-scale galaxy structures, including the Sculptor Wall superstructure (; see Figure 1 of Buote et al. 2009; B09 hereafter). Blazars are preferred for this type of observation, not just because they are X-ray bright, but also because they typically lack intrinsic absorption features that may complicate the search for intervening features. For the first time, we detected a WHIM absorption line at the redshift of the Sculptor Wall with both telescopes, with a joint detection significance of (B09; specifically, B09 obtained a detection significance when using the C-statistic and when using ).
While this result is very promising, in light of the various controversies which have plagued past attempts to measure the WHIM in absorption, a definitive detection requires further confirmation at a higher statistical significance level. In particular, the detection significance was driven mostly by the XMM RGS data, with the line only found at 1.7 in the Chandra grating data. To address this, in 2008 we performed a deep, follow-up observation of H 2356-309 as part of the Chandra Cycle 10 Large Project Program, which we discuss in this paper. We confirm the presence of the Sculptor WHIM line at 3.4 with Chandra alone, while improving the joint Chandra-XMM significance to 4. This clear detection with both satellites constitutes arguably the most compelling X-ray evidence to date of a WHIM-like absorber along the line of sight to a blazar.
In this paper we will focus on the Helium-like oxygen line (O VII, rest wavelength 21.6019 Å) studied by B09. Oxygen is the most abundant heavy element in the intergalactic medium (IGM), and numerical simulations predict that given the WHIM gas temperature, most oxygen should be in the form of O VII (Fang et al. 2002; Chen et al. 2003; Cen & Fang et al. 2006). Unlike O VI and O VIII, it probes a wide temperature range of the WHIM gas between to K. Absorption lines from other ion species may also be expected but at lower significance, and a companion paper (Buote et al. 2010) will discuss those lines. Evidence for the WHIM absorption in galaxy superstructures at higher redshifts than the Sculptor Wall will be presented in Zappacosta et al. (2009).
2. Observation and Data Extraction
H 2356-309 was observed first in 2007 during Chandra Cycle 8 for 100 ks, and it was observed again in 2008 during Cycle 10 in ten separate exposures totaling ks. The exposures range from 15 to 100 ks; see Table 1 for details. We selected the Chandra Low Energy Transmission Grating and the High Resolution Camera (LETG-HRC) combination. It offers high sensitivity with less instrumental features between 22 and 23 Å, where the redshifted O VII line is located. The LETG-HRC also offers a constant spectral resolution of Å. The Cycle 10 observation substantially improved the count statistics when expressed in terms of the counts per resolution element; i.e., the photon counts within a bin size of the spectral resolution (50 mÅ). In the vicinity of 22 Å the combined Chandra data sets from Cycle 8 and Cycle 10 (excluding sequence 10498, as discussed below) have a total CPRE of (including background counts), which greatly exceeds the CPRE of (including background counts) obtained for just the Cycle 8 data.
As in B09, we followed the standard procedures to extract the spectra. We used the software package CIAO (Version 4.0222see http://asc.havard.edu/ciao) and calibration database CALDB (Version 3.5333see http://asc.havard.edu/caldb) developed by the Chandra X-ray Center. Most changes in the latest release CIAO V4.1 and CALDB V4.1 are related to the Advanced CCD Imaging Spectrometer (ACIS) and do not impact our analysis. Specifically, we followed the science thread for analyzing LETG-HRC data444see http://asc.havard.edu/ciao/threads/gspec.html, in which one first generates a type II pha file, builds the redistribution matrix files (RMFs) and the ancillary response files (ARFs), and groups the spectrum.
As in B09, we have generated our own type II pha file, rather than using the file produced by the standard pipeline (Reprocessing III), to take advantage of an improved background filter not yet available in the standard processing. This LETG background filter recently developed by the Chandra X-ray Center (CXC) 555see http://cxc.harvard.edu/contrib/letg/GainFilter/software.html can allow us to reduce the background rate by as much as 50% at the wavelength regions of interest ( Å) with a negligible loss of source X-ray events (). We therefore reprocessed the data and applied this new filter to generate the type II pha spectra.
Unlike ACIS, the HRC does not have the energy resolution to sort individual orders, and each spectrum contains contributions from all the diffraction orders. To account for the high-order contributions, it is necessary to build the response matrix that includes all the relevant orders. Our experience showed that orders higher than the sixth make negligible contributions. Therefore, as in B09, we ignore them and focus only on the first to the sixth orders. For each observation, we first built the RMF and ARF for each order; these RMFs and ARFs were then combined together, following the procedures described on the Chandra website666see http://cxc.harvard.edu/cal/Letg/Hrc_QE/ea_index.html. We also combined the negative and positive orders.
We rebinned each LETG-HRC spectrum to have a minimum of 40 counts per bin. We examined other binning schemes (e.g., fixed wavelength bins) and did not find substantial improvement in the spectral fitting results.
Finally, we refer the reader to B09 for details of the XMM RGS observation and data preparation.
3. Data Analysis
| Observation ID | Exposure | Date | Fluxa | |
|---|---|---|---|---|
| (ks) | ||||
| 8120b | 100 | Oct 11 2007 | 1.12 | |
| 10577 | 82 | Sep 17 2008 | 2.08 | |
| 10497 | 52 | Sep 19 2008 | 1.95 | |
| 10498 | 80 | Sep 22 2008 | 1.94 | |
| 10762 | 35 | Sep 25 2008 | 2.04 | |
| 10761 | 45 | Sep 27 2008 | 2.20 | |
| 10499 | 56 | Sep 29 2008 | 2.01 | |
| 10764 | 103 | Oct 10 2008 | 1.74 | |
| 10840 | 15 | Dec 23 2008 | 1.87 | |
| 10500 | 16 | Dec 25 2008 | 1.89 | |
| 10841 | 15 | Dec 28 2008 | 1.95 |
Note. — a. Flux between 0.5 and 2 keV, in units of . b. This sequence was first analyzed in B09.
3.1. Continuum
To make an accurate determination of the WHIM absorption line properties it is desirable to measure the continuum level as close as possible to the line. However, because of the contribution from overlapping higher orders diffracted from higher energies, as noted above, it is necessary to model the continuum over a wide energy band. Consequently, following B09 we first fitted a power-law to the broad-band spectrum (5 – 30 Å) for each exposure. (By fitting down to 5 Å we account for contributions from orders 2–6, including order 3, which is the most important higher order.) For determining the WHIM (and local absorption) line parameters, we actually only fitted the data over a restricted continuum range (21–22.5Å). We model the continuum as a powerlaw with its spectral index restricted to the 90% confidence range determined from the broad-band fit (given in Table 1), but its normalization allowed to vary freely. This procedure balances the need to account for the contributions from higher orders while allowing for some adjustment in the local continuum with respect to that established by the broadband fit.
For each observation, we fitted the broadband spectrum (5 – 30 Å) with a power law with the Galactic neutral hydrogen absorption. We used the software package XSPECV11.3777See http://heasarc.nasa.gov/docs/xanadu/xspec/xspec11/index.html. for spectral fitting throughout the data analysis. Since fits of Poissonian data, even when rebinned far more heavily than the canonical 20 counts per bin, tend to be significantly biased, we performed the fits by minimizing the C-statistic (identical to maximizing the Poisson likelihood function) of Cash (1979), which yields less biased best-fitting parameters (Humphrey, Liu & Buote 2008) 888Although it is not strictly necessary to bin the data to obtain the best-fitting model when using the C-statistic, it is critical to bin the data in order to assess the statistical significance of the line detection (Humphrey et al, 2009). We discuss the impact of different binning schemes in §4.4.. We note that the statistical significance does not change appreciably between the and -statistic (see below).
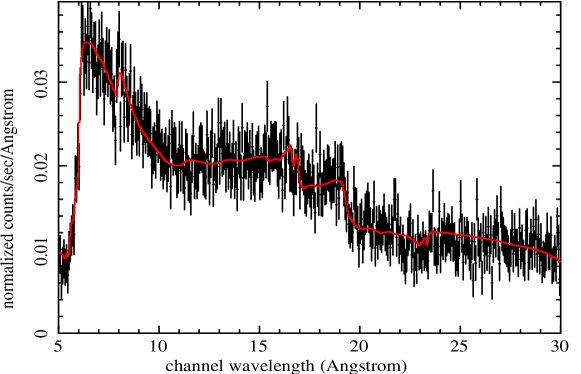
The column density estimated from the HI map of Dickey & Lockman (1990) by the Colden tool999see http://asc.harvard.edu/toolkit/colden.jsp is , and we fixed the Galactic absorption at this level. We also tested our fits with free and found the fitted differed very little, indicating no excess neutral hydrogen absorption. Figure 1 shows an example of the broadband fitting for the obs.#10577, demonstrating that our simple model (red line) provides a satisfactory fit to the broadband behavior.
The photon index and spectral flux of each observation are listed in columns 4 and 5 in Table 1101010Throughout the paper, all the errors and limits are quoted at 90% confidence level, unless otherwise specified.. For consistency, we also refitted obs.#8120, listed in the first row, that was analyzed in B09, and report its flux including Galactic absorption (B09 reported the unabsorbed flux.) The flux is measured between 0.5 and 2 keV, in units of . The flux increased almost by a factor of between the Cycle 8 (observed in October 2007) and the Cycle 10 (observed in late 2008) observations. Overall, the 2008 flux levels are very consistent with previous BeppoSAX (Costamante et al. 2001) and RXTE (Aharonian et al. 2006) observations. The photon index also varied between approximately 1.7 and 2.
| Line | Chandra Redshift | XMM Redshift | EW | ||
|---|---|---|---|---|---|
| (cm-2) | (km s-1) | (mÅ) | |||
| Sculptor Wall | 96 | ||||
| Local |
Note. — All the errors are quoted at the 90% confidence level on one interesting parameter (). The Doppler parameter was allowed to vary between km s-1.
3.2. Absorption Lines
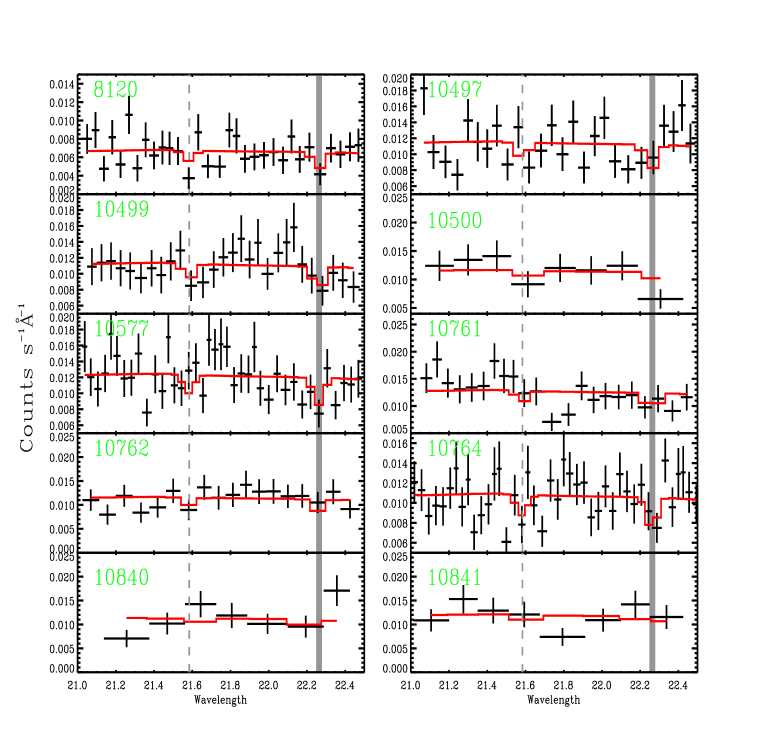
In Figure 2 we display the spectrum for each individual exposure over the Å wavelength range used for our analysis. The positions of the O VII absorption lines corresponding to the local () absorber and the Sculptor Wall () previously detected by B09 are indicated. For one of the exposures (obs. #10498, not shown), there is also a significant absorption feature located near 22.05A, and we defer analysis of that data set until discussing systematic errors in §4.1. Consequently, the total Cycle 8 and Cycle 10 Chandra exposure (omitting #10498) used in our analysis is ks.
The absorption lines are fitted using a model that was developed in B09 rather than simply subtracting a Gaussian component from the continuum. This physical, Voigt-broadened line absorber model has three free parameters: the column density of the absorbing ions, the Doppler- parameter, and the redshift. This model is motivated by the absorption line physics, and the model parameters reflect directly the physical properties of the absorbers. Consequently, this model readily allows the line parameters, notably the column density, to be tied consistently between the different spectra, unlike ad hoc models that simply subtract a gaussian from a continuum model. Note following B09, in calculating the optical depth we ignore the correction term from stimulated emission since it is negligible at the gas temperature where the O VII ionization fraction peaks.
To determine the significance of the WHIM line at Å, we adopt the following procedure. We first fit the Galactic (i.e., local) line in addition to the local continuum (all modified by Galactic neutral hydrogen absorption), where, as noted above, the latter is restricted to have powerlaw exponent consistent with the 90% limits that were established by the broadband fit. The redshift of the added line was restricted to match the structure in the Sculptor Wall (z=0.028–0.032; B09). We then add the WHIM line, fit again, and the resulting -statistic difference between this fit and the previous one (local continuum + the Galactic line) gives the significance of the WHIM line. For the Galactic line, we follow the same procedure by fitting the WHIM line first and then adding the Galactic line, which we restrict to have z0.0025.
We have two choices for spectral fitting. One is to stack all the observations into one spectrum, and combine the response and effective area file of each observation into one response file. This approach is advantageous for low signal-to-noise spectra. However, due to the variation of each spectrum (both power law index and flux), which is typical for blazars, this approach will produce significant systematic errors, as described in Rasmussen et al. (2007). So instead of stacking all the spectra, we simultaneously fit all the data sets, such as we did previously with the Cycle-8 Chandra data and the XMM data in B09. Each spectrum has its own RMF and ARF. While we allow the continuum parameters (photon index and normalization) to vary separately for each observation, the parameters for the absorption lines are tied between each Chandra observation. We also allow the redshift of the XMM data to be fitted separately from the Chandra data, which we discuss more below.
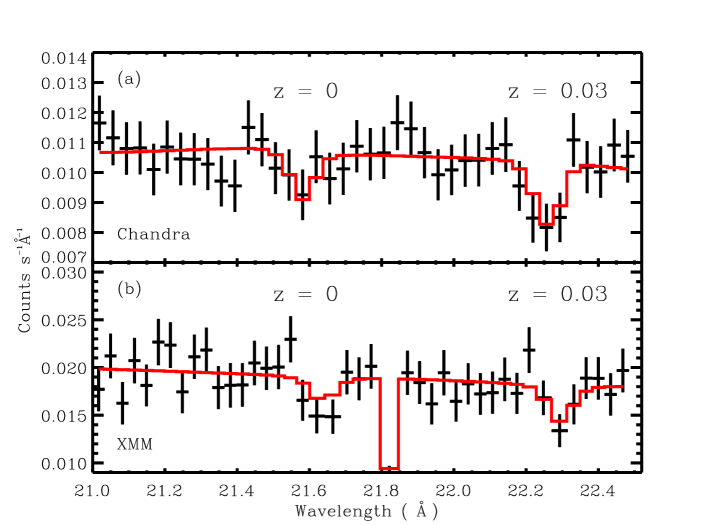
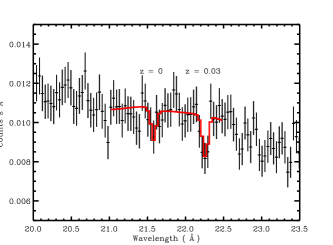
In Figure 2 we display for each Chandra spectrum the best-fitting model obtained from a simultaneous fit of the Chandra and XMM data. Because the absorption lines are not immediately apparent to visual inspection in every Chandra spectrum, to aid visual interpretation we stacked the individual spectra into a single combined spectrum using an adaptive binning scheme. We show the resulting stacked spectrum for the Chandra data in Figure 3 (along with the XMM data), which can be considered a lightly smoothed spectrum constructed from some components with a coarser bin scale. Also shown are the best-fitting models obtained from the simultaneous fits to the individual exposures. We reiterate that the models displayed in Figure 3 are not fitted to the stacked spectrum. In Figure 4 we show the expanded Chandra spectrum between 20.5 and 23.5 Å.
Visual inspection of Figure 3 reveals very clearly the presence of the WHIM line near 22.25 Å. This is confirmed by the improvement in the spectral fits when adding the WHIM line. The C-statistic decreases by 14.1 (229 bins) when using only the Chandra data, and decreases even more (20.4 for 271 bins) when including the XMM data in the fits. The reduction in the C-statistic and the total number of bins are over twice that reported in B09 using only the Cycle-8 Chandra data along with the XMM data, and thus the statistical significance of the line detection is now much larger. (We note that the measured line equivalent width of mÅ (Table 2) is very close to, and consistent with, the value of 30 mÅ obtained by B09.)
Following B09, we estimate the statistical significance of the WHIM and local lines using Monte Carlo simulations (see B09 for details). Briefly, we make two sets of simulated spectra for each observation. One includes both source and background, and one is the background only. For the simulated background spectra, we used the model parameters obtained by fitting the real extracted background with a single powerlaw model. For the source spectrum, we use a model that includes the continuum and only one absorption feature, i.e., we include the Galactic line when estimating the significance for the WHIM line, and vice versa. We treat the two spectra in exactly the same way as the real data sets. In particular, as above we restricted the redshift of the WHIM line to lie between 0.028 — 0.032 to match the Sculptor Wall.
First, we examined the significance of the Sculptor O VII line using only the Chandra data. In 100,000 simulations of the Chandra data without the Sculptor line, we obtained 64 false detections with a reduction in the -statistic at least as large as we measured from the real data; i.e., we conclude that the Sculptor O VII line is detected at a statistical significance of 99.936%, or 3.4, using only the Chandra data. This represents a substantial improvement over the detection we reported previously when using only the Cycle-8 Chandra data (B09). Second, when the XMM data are included, we obtain just 16 false detections out of 200,000 simulations corresponding to a detection significance of 99.992%, or 4.0. Therefore, the Sculptor O VII WHIM line is confirmed. If instead we use the standard data-weighted statistic in place of the -statistic we obtain fully consistent results; i.e., we detect the WHIM line at a significance level of 3.3 using only the Chandra data and at 4.0 using both the Chandra and XMM data. We found these results are consistent with those obtained using -statistic.
The redshift of the WHIM line is well constrained separately for both the Chandra and XMM data (Table 2), and each are consistent with lying within the redshift range 0.028-0.032 representing the portion of the blazar’s sight line intercepted by the Sculptor Wall. However, although the redshifts are formally consistent at the confidence level, the Chandra data suggest a slightly lower value. (Note if the redshifts are tied between the Chandra and XMM data, then the WHIM line redshift is and the line is detected at a slightly lower significance level: we found 32 false-detections in 200,000 simulations, yielding a significance of 99.984%, or .) A similar offset between Chandra and XMM is also observed for the local line. These differences reflect the approximately 40 mÅ wavelength shift between the XMM and Chandra data first reported in B09. The exact reason for the shift is unclear, since the typical XMM RGS wavelength accuracy is 10 mÅ ; however, it is noted that occasionally the RGS wavelength scale can be in error by this magnitude possibly owing to operation issues (A. Rasmussen, private communication).
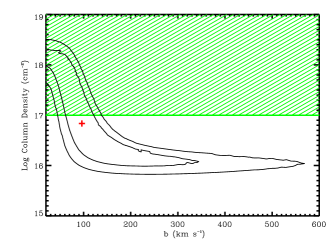
For the column density and -parameter we list their 90% errors on one interesting parameter in Table 3 and display contours representing their joint 68% and 90% errors on two interesting parameters in Figure 5. While the data do not place a strong constraint on , we obtain a best-fitting value of 96 km/s and a 90% upper limit of 455 km/s, which is an improvement over our previous study in B09. The constraints on are consistent with theoretical expectations for the WHIM; e.g., we expect even with shocks and turbulence the velocity should not be much higher than 500 – 600 in these superstructures (e.g., Kang et al. 2005).
As shown in Figure 5, the constraint on the O VII column density is sensitive to . For km/s, the column density lies in a fairly narrow range with a typical value, cm-2, that is fully consistent with cosmological simulations. However, for smaller the column density is not as well constrained: for km/s the column density can take a large range of values from below cm-2 to values exceeding cm-2. Since O VII column densities exceeding cm-2 are neither easily produced in cosmological simulations of the WHIM (e.g., Fang, Canizares, & Bryan 2002) nor are they measured for the local X-ray absorption lines (e.g., Williams et al. 2005, 2007; Wang et al. 2005; Fang et al. 2006), we indicate such disfavored values of large column density with a (green) hatched region in Figure 5.
Following the same procedure we also estimate the detection significance of the Galactic O VII absorption line. This line was detected in the observations reported in B09, with a joint significance of about 3. With the new observation, the reduction of the -statistic for the Chandra + XMM data is 9.6. For the simultaneous fit of the Chandra and XMM data we obtained 145 false detections in 10,000 Monte Carlo trials for a detection significance. Using only the Chandra data, we obtained 1607 false detections for a detection significance. The somewhat smaller detection significance of the local line we have obtained with Chandra compared to B09 (who obtained ) can be understood in terms of the line equivalent width. Here we have measured an equivalent width of mÅ (Table 2) for the local line, whereas B09 obtained mÅ with a error of 11 mÅ. While the values are formally consistent at the level, the best-fitting value has been cut almost in half, implying the line is weaker than previously estimated (note the O VII column density for the local line is very poorly constrained and, while the best-fitting value is larger than that of the Sculptor line, the lower limit is even lower.)
4. Systematics
4.1. Anomalous Exposure #10498
For one of the exposures (obs. #10498), there is a significant absorption feature located near 22.05 Å which does not correspond to a known instrumental feature, nor is it present in any of the other Chandra exposures or the XMM observation. There is no known large-scale galaxy concentration along the blazar’s sight-line at the redshift () corresponding to the feature. One possibility is that the feature represents the Sculptor line which has been shifted (by mÅ) as the result of a temporary gain non-linearity in the HRC-S. We believe this is unlikely because a gain non-linearity should produce a shift no larger than mÅ(Chung et al. 2004), and there is also no corresponding evidence for a shift in the local line. Instead, the transient feature is more likely intrinsic to the blazar, a possibility we discuss in more detail in a separate paper (Fang et al. 2009, in preparation).
Transient absorption line features were first discovered in early X-ray observations of blazars, and often interpreted as intrinsic to the source and can be characterized by, e.g., an absorption edge or a P-Cygni profile (e.g., Canizares & Kruper 1984; Krolick et al. 1985; Madejski et al. 1991). These absorption profiles are sufficiently broad so as to impact significantly the local continuum shape near the Sculptor WHIM line, complicating interpretation of the WHIM line in this single exposure. For example, if the transient line shape follows a P-Cygni profile, it would contribute extra emission in the region of the Sculptor WHIM absorption line which could then be compensated for by a stronger, more significant, WHIM line. We defer a detailed investigation of the modeling of the transient line to our dedicated paper on the transient feature. Here we estimate the maximum reduction in the WHIM significance we might expect when including exposure #10498.
Such a conservative estimate is provided by assuming the transient line is Voigt-broadened like the WHIM line, although it is unlikely that a line intrinsic to the blazar will be thermally broadened. In this case, the transient absorption line contaminates the Å WHIM line by contributing excess absorption, lessening the need for the WHIM line. If we include exposure #10498 in our simultaneous Chandra and XMM fits while treating the feature as a separate, Voigt-broadened absorption line present only in this one data set, then we obtain fully consistent results for the WHIM absorption line parameters, though the statistical significance of the line is slightly reduced (99.986%, or ). Similarly, the statistical significance of the WHIM line decreases from to (99.840%) when using only the Chandra data. Given such systematic uncertainties owing to the specific treatment of the transient line shape, and since this conservative estimate of the reduction in the WHIM significance does not have a qualitative impact on our finding of a clear WHIM detection, we exclude exposure #10498 from our analysis.
4.2. Background
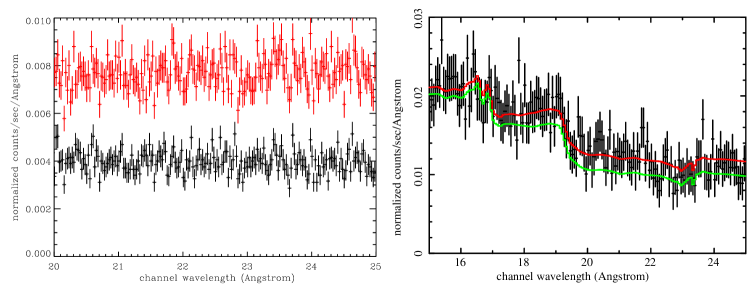
Due to the malfunction of the anti-coincidence shield, the HRC-S has a higher background than expected prior to launch. The standard procedure to estimate the background involves defining a special region on the HRC-S to extract a background spectrum, and then perform filtering based on the photon energy111111see http://cxc.harvard.edu/cal/Letg/Hrc_bg/. Recently, the CXO has refined the background estimation procedure with an improved pulse-height filter that also includes time-dependent gain corrections (Wargelin et al. 2009). As in B09, we have adopted the improved procedure because, indeed, we find it delivers a superior background reduction.
In the left panel of Figure 6 we show the background spectra for obs.#10577 between 20 and 25 Å. Red shows the result from the standard extraction procedure, and black is from using the improved pulse-height filter. The new filter reduces the background rate by almost 50%, and the variation is also significantly reduced.
The smaller background produced by the improved procedure also leads to a higher detection significance for the O VII line. When preparing the Chandra spectra using the previous background estimation procedure without the improvements, we obtain a slightly lower detection significance () when adding the Sculptor line.
4.3. Higher Order Contribution
As noted previously, the HRC-S cannot separate photons arising from different diffraction orders. The result is that the higher-order photons act as an additional ”background” component on top of the dominant first-order spectrum. In this section we explore the sensitivity of our analysis to our model of the higher orders by taking the extreme alternative of ignoring them altogether.
Taking obs.#10577 as an example, we estimate the continuum made by the first order photons. We convolve the model spectrum (obtained by fitting the source spectrum with the total response matrix) with the first-order response. The result is shown as the green curve in the right panel of Figure 6. Over 21 – 22.5 Å, the first-order contributes about 80 – 85% of the total photons.
To assess the impact of ignoring the noise contributed by the higher-order photons in our analysis, we have performed our spectral fitting using the RMF and ARF files containing only information on the first-order photons. Furthermore, since the first-order RMF does not account for the diffraction of photons with energies outside of the 21 – 22.5 Å band of interest, we do not need to restrict the power-law index of the continuum models for each observation. In this way we are able to assess how much the detection significance of the O VII line is degraded using a higher background and a more flexible continuum model. Despite these changes, we find that the -statistic is still reduced by 19.8, very close to the value we obtained when properly accounting for the higher-order photons.
We also note a weak correlation (not shown) between the slope of the power-law index for the broad-band continuum and the reduction in the -statistic obtained for each Chandra exposure when including the Sculptor line. This behavior is expected because a flatter continuum implies a larger proportion of higher-order photons from shorter wavelengths being diffracted into the 21 – 22.5 Å band, thus effectively lowering the S/N. The trend is fairly weak because the exposure time and flux of each observation also affect the S/N, and the variation in photon index between the observations is modest.
4.4. Choice of Spectral Binning
In our analysis we have adopted a conventional approach where the individual spectra have been rebinned so that each bin has counts above some minimum threshold value. The thresholds adopted (40 for Chandra, 75 for XMM) were chosen to be consistent with B09. However, other binning choices are possible which can yield different results for the statistical significance of the WHIM line (e.g., Gumble 1943, Humphrey et al. 2009). To assess the magnitude of possible variations in the WHIM line significance arising from the binning procedure, we considered a more complicated scheme, focusing only on the Chandra data for simplicity.
In this scheme each Chandra spectrum was first analyzed separately for a suite of different binning definitions (considering different rebinning factors and shifts in the location of the first bin). For each individual spectrum we selected the binning definition that gave the maximum -statistic difference obtained from fitting models with and without the Sculptor WHIM line only to that individual spectrum. After the binning definitions were determined in this way, we computed the WHIM line significance by first simultaneously fitting all of the Chandra spectra to determine the total change in the -statistic. This change in the -statistic was then compared to those obtained from Monte Carlo simulations as before. In particular, as above we restricted the redshift of the WHIM line to lie between 0.028 — 0.032 to match the Sculptor Wall. In this case, however, the more complicated rebinning procedure is also incorporated in the Monte Carlo simulations; i.e., the binning of each mock spectrum is determined specially for each Monte Carlo simulation as specified above. We find that when enacting this binning procedure, we obtain a statistical significance of for the WHIM line (132 false detections over 100,000 simulations), similar to that obtained () with the conventional binning approach. (The quoted significance estimates are accurate to considering Poisson noise in the number of simulations/trials.)
5. Discussion & Summary
Using a deep, 500 ks follow-up Chandra observation, we confirm at higher significance the O VII absorption line in the Sculptor Wall () in the sight-line of the blazar H 2356-309 () first reported in B09. We detect the O VII line at the significance level when using only the Chandra data, a substantial improvement over the level reported previously when using only the Chandra Cycle-8 data (B09). The significance increases to when including the existing XMM RGS observation in a joint fit with the Chandra exposures. While the significance of the Sculptor line improves substantially with the addition of the new Chandra data, the significance of the local O VII line is slightly reduced compared to that found by B09 ( vs. ). Finally, in one of the Chandra exposures we find evidence for a transient absorption line intrinsic to the blazar (§4.1), which we discuss further in a separate paper (Fang et al. 2010, in preparation).
5.1. Interpreting the Sculptor line as Intrinsic to the Blazar
While the possibility that the WHIM line is instead intrinsic to the blazar cannot be categorically ruled out with the current data, we believe this to be highly unlikely. The redshift of H 2356-309, determined by stellar absorption features from the host galaxy is (Falomo 1991). Therefore, the most likely candidates for an intrinsic absorption line would be O VII K with an implied outflow velocity of , or O VIII Ly-, inflowing at 2000 km s-1 (in contrast to the expected outflows in the polar region; e.g. Proga 2005). In the latter case, if we consider that the line arises from a cloud of inflowing material, and if we make the reasonable assumption that the inflow speed does not exceed the freefall velocity, it follows that the cloud must lie within cm of the black hole (which has mass ). As there are no significant absorption lines of other species at the same redshift, we assume that O VIII is close to its peak ionization fraction (), which occurs for ionization parameters, 20–40 erg cm s-1 (Kallman & Bautista 2001), where (erg s-1) is the source luminosity and is the number density of hydrogen in the cloud. Given the luminosity of the AGN ( erg s-1, assuming isotropic emission), maintaining this would require, cm-3. Assuming a uniform, spherical cloud with Solar abundances, the measured O VIII column density ( cm-2) would thus require a size, cm. The persistence of the WHIM absorption line over the time 1.5 yr spanned by the XMM and Chandra observations would therefore imply a velocity perpendicular to the line of sight, km s-1. Even allowing for black holes as massive as , this would require an extremely fortuitous (and improbable) orientation of the cloud’s velocity vector to the line of sight.
Interpreting the line as outflowing material is also problematical. While high-velocity outflows have been reported in some other AGNs (see, e.g., Pounds & Reeves 2009), typically they exhibit features produced by several different ion species. Although we cannot rule out there being other, weak lines, they are certainly not as prominent as the implied O VII line. This situation is to be contrasted with the interpretation as a WHIM line, where it is likely a collisionally ionized plasma in which a dominant O VII K line is expected. Further observations of H 2356-309 will be useful to investigate whether weaker lines are present. Nevertheless, reconciling such a putative outflow with the appearance of a transient line at 22.05Å (Section 4.1) would require the outflowing material to exhibit a wide range of line-of-sight velocities.
5.2. Density of the Sculptor WHIM
Our clear detection of the WHIM absorption line allows us to make a rough estimate of the three-dimensional density of the WHIM gas. We obtain a 90% lower limit on the O VII column density of and a 90% upper limit on the Doppler parameter of km s-1, each of which are consistent with cosmological simulations of the WHIM (§3.2). Assuming the absorber is uniformly distributed along the portion of the blazar’s sight-line that intercepts the Sculptor Wall ( Mpc from ) 121212We note that while the Hubble flow could contribute to the line broadening, the effect is very uncertain in a superstructure like the Sculptor Wall, where local gravitational interactions between galaxies may dominate the global Hubble flow., the density of hydrogen is,
| (1) | |||||
where we have used a typical value of corresponding to km -1 where the inferred column density is only weakly dependent on (Figure 5), is the O VII ionization fraction, is the path length, and we assume a solar ratio of O/H and a metallicity, , of 0.1 solar typical of low-density gas produced in cosmological simulations (Davé et al. 2001; Cen & Ostriker 2006). We assume because the data do not show evidence of a very significant, redshifted O VIII line at Å. (The study of the lines other than O VII K will be the subject of a future paper.) Hence, this density in equation (1) translates to a baryon over-density of , which is consistent with the peak of the WHIM mass fraction predicted by cosmological simulations (Davé et al. 2001; Cen & Ostriker 2006). Moreover, the cosmological simulations predict that WHIM gas at this over-density should have a temperature of K. This temperature also happens to correspond to the peak in the O VII ionization fraction, consistent with our assumptions.
Since the Sculptor line provides key new evidence for WHIM with over-density and temperature typical of ( 50%) of the WHIM gas, it also provides a crucial link between the results obtained from O VI absorption and X-ray emission studies of the WHIM. First, the O VI absorbers typically probe the low-density, low-temperature portion of the WHIM, because the O VI ionization fraction peaks near K assuming collisional ionization. If the O VI absorbers are produced by photo-ionized gas, then the gas is even colder ( K). In all, probably 10-20% of the WHIM gas is probed by the O VI absorbers (Danforth & Shull 2007; Tripp et al. 2008; Thom & Chen 2008). On the other hand, the WHIM gas probed by X-ray emission studies typically has a higher temperature ( K) and higher over-density (; e.g., Werner et al. 2008), which represents the higher-density tail of the WHIM distribution (Davé et al. 2001; Cen & Ostriker 2006).
5.3. Future Work
Due to the limitations in the spectral resolution of the Chandra and XMM data, we are unable to map in detail the spatial distribution of the absorber along the line-of-sight. Because the Sculptor Wall is densely populated with galaxies, it is possible that the O VII WHIM absorber we have detected actually corresponds to the halo of an individual galaxy or group, rather than to the entire 15 Mpc sight line. Indeed, such X-ray absorption is seen in our Chandra and XMM spectra (i.e., the O VII line) and has been detected repeatedly in and/or around the Milky Way (e.g., Nicastro et al. 2002; Fang et al. 2003; Rasmussen et al. 2003; Yao & Wang 2004; Williams et al. 2005). Although it is still under debate whether these absorption lines are produced by hot gas in the disk, in the halo of the Milky Way, in the intra-group medium of the Local Group, or some combination of the three, several lines of evidence (e.g., Wang et al. 2005; Fang et al. 2006) do suggest the hot gas in our Galaxy may be responsible for absorption.
One method to address the spatial distribution of the Sculptor WHIM line is through X-ray imaging of the WHIM emission. If the Sculptor WHIM actually arises from the halo of a Milky-Way–sized galaxy, there should be no significant WHIM emission outside the virial radius, corresponding to about at . Although imaging studies of the WHIM are better suited to much higher over-densities than we infer for the Sculptor Wall gas, it should nevertheless be possible to detect it in emission using offset pointings at least away from the blazar with Suzaku and XMM-Newton, if it is actually extended throughout the entire Sculptor Wall.
Our successful detection of the O VII Sculptor WHIM absorption line demonstrates the viability of our observation strategy using Chandra and XMM; i.e., deep (0.5-1 Ms) targeted observations of a modest number (5-10) of bright blazars behind known large-scale galaxy structures is an effective means to detect and study the WHIM in X-ray absorption with current observatories and is much more efficient than blind searches. To achieve a complete census of the WHIM gas in the X-ray band, higher quality data are needed such as would be provided by the planned International X-ray Observatory (IXO)131313See http://ixo.gsfc.nasa.gov/. The grating for the IXO has an effective area of at the soft energy band, two orders-of-magnitude larger than that of Chandra gratings. This means a few ten ks observations of H 2356-309 with the IXO would achieve the same level of detection as we reported in this paper. Also, the much higher spectral resolution of the IXO grating will clearly resolve the WHIM line structure, therefore providing rich details of the WHIM gas. Finally, such telescopes will make the “blind”-search strategy possible since it can probe the WHIM gas in very low density filaments, and complete the census of the WHIM gas.
Acknowledgments: We thank Brad Wargelin for assistance with observation set-up, Peter Ratzlaff for helping implement the new filtering procedure, and Vinay Kashyap for assistance with the Chandra observation #10498. We also thank Andrew Rasmussen, Aaron Barth, and Hélène Flohic for helpful discussions. T.F., D.A.B., and P.J.H. gratefully acknowledge partial support from NASA through Chandra Award Numbers GO7-8140X and G09-0154X issued by the Chandra X-Ray Observatory Center, which is operated by the Smithsonian Astrophysical Observatory for and on behalf of NASA under contract NAS8-03060. We also are grateful for partial support from NASA-XMM grant NNX07AT24G. C.R.C. acknowledges NASA through Smithsonian Astrophysical Observatory contract SV1-61010.
References
- Aharonian et al. (2006) Aharonian, F., et al. 2006, A&A, 455, 461
- Buote et al. (2009) Buote, D. A., Zappacosta, L., Fang, T., Humphrey, P. J., Gastaldello, F., & Tagliaferri, G. 2009, ApJ, 695, 1351
- Canizares & Kruper (1984) Canizares, C. R., & Kruper, J. 1984, ApJ, 278, L99
- Cash (1979) Cash, W. 1979, ApJ, 228, 939
- Cen & Fang (2006) Cen, R., & Fang, T. 2006, ApJ, 650, 573
- Cen & Ostriker (2006) Cen, R., & Ostriker, J. P. 2006, ApJ, 650, 560
- Cen & Ostriker (1999) Cen, R., & Ostriker, J. P. 1999, ApJ, 514, 1
- Chen et al. (2003) Chen, X., Weinberg, D. H., Katz, N., & Davé, R. 2003, ApJ, 594, 42
- Chung et al. (2004) Chung, S. M., Drake, J. J., Kashyap, V. L., Ratzlaff, P. W., & Wargelin, B. J. 2004, Proc. SPIE, 5488, 51
- Costamante & Ghisellini (2002) Costamante, L., & Ghisellini, G. 2002, A&A, 384, 56
- Danforth & Shull (2008) Danforth, C. W., & Shull, J. M. 2008, ApJ, 679, 194
- Davé et al. (2001) Davé, R., et al. 2001, ApJ, 552, 473
- Davé et al. (1999) Davé, R., Hernquist, L., Katz, N., & Weinberg, D. H. 1999, ApJ, 511, 521
- Dai et al (2008) Dai, X., Mathur, S., Chartas, G., Nair, S. & Garmire, G. 2008, ApJ, 135, 333
- Dickey & Lockman (1990) Dickey, J. M. & Lockman, F. J 1990, ARA&A, 28, 215
- Falomo (1991) Falomo, R. 1991, AJ, 101, 821
- Fang & Canizares (1997) Fang, T., & Canizares, C. R. 1997, Bulletin of the American Astronomical Society, 29, 1406
- Fang & Bryan (2001) Fang, T., & Bryan, G. L. 2001, ApJ, 561, L31
- Fang et al. (2005) Fang, T., Canizares, C. R., & Marshall, H. L. 2005, ApJ, 633, 61
- Fang et al. (2007) Fang, T., Canizares, C. R., & Yao, Y. 2007, ApJ, 670, 992
- Fang et al. (2002) Fang, T., Davis, D. S., Lee, J. C., Marshall, H. L., Bryan, G. L., & Canizares, C. R. 2002, ApJ, 565, 86
- Fang et al. (2006) Fang, T., Mckee, C. F., Canizares, C. R., & Wolfire, M. 2006, ApJ, 644, 174
- Fang et al. (2001) Fang, T., Marshall, H. L., Bryan, G. L., & Canizares, C. R. 2001, ApJ, 555, 356
- Fang et al. (2002) Fang, T., Marshall, H. L., Lee, J. C., Davis, D. S., & Canizares, C. R. 2002, ApJ, 572, L127
- Ferrarese & Ford (2005) Ferrarese, F. & Ford, H. 2005, Sp. Sci. Rev., 116, 523
- Finoguenov et al. (2003) Finoguenov, A., Briel, U. G., & Henry, J. P. 2003, A&A, 410, 777
- Fujimoto et al. (2004) Fujimoto, R., et al. 2004, PASJ, 56, L29
- Fukugita et al. (1998) Fukugita, M., Hogan, C. J., & Peebles, P. J. E. 1998, ApJ, 503, 518
- Galeazzi et al. (2007) Galeazzi, M., Gupta, A., Covey, K., & Ursino, E. 2007, ApJ, 658, 1081
- Hellsten et al. (1998) Hellsten, U., Gnedin, N. Y., & Miralda-Escudé, J. 1998, ApJ, 509, 56
- Humphrey et al. (2009) Humphrey, P. J., Liu, W., & Buote, D. A. 2009, ApJ, 693, 822
- Kaastra et al. (2003) Kaastra, J. S., Lieu, R., Tamura, T., Paerels, F. B. S., & den Herder, J. W. 2003, A&A, 397, 445
- Kaastra et al. (2006) Kaastra, J. S., Werner, N., Herder, J. W. A. d., Paerels, F. B. S., de Plaa, J., Rasmussen, A. P., & de Vries, C. P. 2006, ApJ, 652, 189
- Kallman & Bautista (2001) Kallman, T. & Bautista, M. 2001, ApJS, 133, 221
- Kravtsov et al. (2002) Kravtsov, A. V., Klypin, A., & Hoffman, Y. 2002, ApJ, 571, 563
- Krolik et al. (1985) Krolik, J. H., Kallman, T. R., Fabian, A. C., & Rees, M. J. 1985, ApJ, 295, 104
- Lieu & Mittaz (2005) Lieu, R., & Mittaz, J. 2005, Highlights of Astronomy, 13, 330
- Madejski et al. (1991) Madejski, G. M., Mushotzky, R. F., Weaver, K. A., Arnaud, K. A., & Urry, C. M. 1991, ApJ, 370, 198
- Mathur et al. (2003) Mathur, S., Weinberg, D. H., & Chen, X. 2003, ApJ, 582, 82
- McKernan et al. (2003) McKernan, B., Yaqoob, T., Mushotzky, R., George, I. M., & Turner, T. J. 2003, ApJ, 598, L83
- Nicastro et al. (2005) Nicastro, F., et al. 2005, Nature, 433, 495
- Nicastro et al. (2002) Nicastro, F., et al. 2002, ApJ, 573, 157
- Oegerle et al. (2000) Oegerle, W. R., et al. 2000, ApJ, 538, L23
- Perna & Loeb (1998) Perna, R., & Loeb, A. 1998, ApJ, 503, L135
- Proga (2005) Proga, D. 2007, ApJ, 661, 693
- Raiteri et al. (2009) Raiteri, C. M., et al. 2009, arXiv:0909.1701
- Rasmussen et al. (2007) Rasmussen, A. P., Kahn, S. M., Paerels, F., Herder, J. W. d., Kaastra, J., & de Vries, C. 2007, ApJ, 656, 129
- Richter et al. (2008) Richter, P., Paerels, F. B. S., & Kaastra, J. S. 2008, Sp. Sci. Rev. 134, 25
- Richter et al. (2004) Richter, P., Savage, B. D., Tripp, T. M., & Sembach, K. R. 2004, ApJS, 153, 165
- Savage et al. (1998) Savage, B. D., Tripp, T. M., & Lu, L. 1998, AJ, 115, 436
- Sembach et al. (2004) Sembach, K. R., Tripp, T. M., Savage, B. D., & Richter, P. 2004, ApJS, 155, 351
- Shull et al. (1998) Shull, J. M., Penton, S. V., Stocke, J. T., Giroux, M. L., van Gorkom, J. H., Lee, Y. H., & Carilli, C. 1998, AJ, 116, 2094
- Sołtan et al. (2002) Sołtan, A. M., Freyberg, M. J., & Hasinger, G. 2002, A&A, 395, 475
- Takei et al. (2007) Takei, Y., Henry, J. P., Finoguenov, A., Mitsuda, K., Tamura, T., Fujimoto, R., & Briel, U. G. 2007, ApJ, 655, 831
- Takei et al. (2008) Takei, Y., et al. 2008, ApJ, 680, 1049
- Takei et al. (2007) Takei, Y., et al. 2007, PASJ, 59, 339
- Thom & Chen (2008) Thom, C., & Chen, H.-W. 2008, ApJS, 179, 37
- Tripp & Savage (2000) Tripp, T. M., & Savage, B. D. 2000, ApJ, 542, 42
- Tripp et al. (2008) Tripp, T. M., Sembach, K. R., Bowen, D. V., Savage, B. D., Jenkins, E. B., Lehner, N., & Richter, P. 2008, ApJS, 177, 39
- Tumlinson et al. (2005) Tumlinson, J., Shull, J. M., Giroux, M. L., & Stocke, J. T. 2005, ApJ, 620, 95
- Ursino & Galeazzi (2006) Ursino, E., & Galeazzi, M. 2006, ApJ, 652, 1085
- Wang et al. (2005) Wang, Q. D., et al. 2005, ApJ, 635, 386
- Werner et al. (2008) Werner, N., Finoguenov, A., Kaastra, J. S., Simionescu, A., Dietrich, J. P., Vink, J., Böhringer, H. 2008, A&A, 482, L29
- Williams et al. (2006) Williams, R. J., Mathur, S., Nicastro, F., & Elvis, M. 2006, ApJ, 642, L95
- Williams et al. (2007) Williams, R. J., Mathur, S., Nicastro, F., & Elvis, M. 2007, ApJ, 665, 247
- Williams et al. (2005) Williams, R. J., et al. 2005, ApJ, 631, 856
- Worsley et al (2004) Worsley, M. A., Fabian, A. C., Turner, A. K., Celotti, A., & Iwasawa, K., 2004, MNRAS 350, 207
- Yao et al. (2009) Yao, Y., Tripp, T. M., Wang, Q. D., Danforth, C. W., Canizares, C. R., Shull, J. M., Marshall, H. L., & Song, L. 2009, ApJ, 697, 1784
- Yao & Wang (2005) Yao, Y., & Wang, Q. D. 2005, ApJ, 624, 751
- Yoshikawa et al. (2004) Yoshikawa, K., et al. 2004, PASJ, 56, 939
- Zappacosta et al. (2005) Zappacosta, L., Maiolino, R., Mannucci, F., Gilli, R., & Schuecker, P. 2005, MNRAS, 357, 929