Gas cooling in semi-analytic models and SPH simulations: are results consistent?
Abstract
We present a detailed comparison between the galaxy populations within a massive cluster, as predicted by hydrodynamical SPH simulations and by a semi-analytic model (SAM) of galaxy formation. Both models include gas cooling and a simple prescription of star formation, which consists in transforming instantaneously any cold gas available into stars, while neglecting any source of energy feedback. This simplified comparison is thus not meant to be compared with observational data, but is aimed at understanding the level of agreement, at the stripped-down level considered, between two techniques that are widely used to model galaxy formation in a cosmological framework and which present complementary advantages and disadvantages. We find that, in general, galaxy populations from SAMs and SPH have similar statistical properties, in agreement with previous studies. However, when comparing galaxies on an object-by-object basis, we find a number of interesting differences: a) the star formation histories of the brightest cluster galaxies (BCGs) from SAM and SPH models differ significantly, with the SPH BCG exhibiting a lower level of star formation activity at low redshift, and a more intense and shorter initial burst of star formation with respect to its SAM counterpart; b) while all stars associated with the BCG were formed in its progenitors in the semi-analytic model used here, this holds true only for half of the final BCG stellar mass in the SPH simulation, the remaining half being contributed by tidal stripping of stars from the diffuse stellar component associated with galaxies accreted on the cluster halo; c) SPH satellites can loose up to 90 per cent of their stellar mass at the time of accretion, due to tidal stripping, a process not included in the semi-analytic model used in this study; d) in the SPH simulation, significant cooling occurs on the most massive satellite galaxies and this lasts for up to 1 Gyr after accretion. This physical process is not included in the semi-analytic model used in our study, as well as in most of the models discussed in the recent literature. Our results identify specific directions of improvements for our methods to study galaxy formation in a hierarchical Universe.
keywords:
Cosmology: theory – galaxies: clusters – methods: N-body simulations, numerical – hydrodynamics1 Introduction
In the current standard cosmological scenario, galaxies form when gas that has been trapped in the potential wells of dark matter haloes and has been shock heated to high temperatures, cools and condenses at the centre of the haloes. The dynamical evolution of dark matter haloes is governed by gravity alone and can be studied using either analytic techniques (i.e. the Press–Schechter theory and its extensions; Press & Schechter 1974; Bond et al. 1991; Lacey & Cole 1993) or -body simulations (e.g. Boylan-Kolchin et al., 2009, to mention just the most recent cosmological simulation). The evolution of the baryonic component is, in contrast, less well understood and complicated by gas-dynamical and radiative processes that can be treated only to some extent using direct hydrodynamical simulations.
In fact, lacking a ‘complete theory’ of star formation (as well as of almost all the physical processes at play), we are currently not in the position to model galaxy formation from first principles.
Different methods have been developed to model galaxy formation in a cosmological context. Among these, semi-analytic models (SAMs) have developed into a flexible and widely used technique to make detailed predictions of galaxy properties. In these models, the physical processes driving galaxy formation and evolution are approximated using physically and/or observationally motivated analytic laws (for a review, see Baugh, 2006). Computational costs are limited so that this approach allows an efficient investigation of the parameter space and of the influence of different physical assumptions. Modern renditions of these models are coupled to -body simulations, thus removing uncertainties of the analytic approach (Benson et al., 2005; Li et al., 2007; Cole et al., 2008) and providing consistent dynamical information for model galaxies (e.g. Kauffmann et al., 1999; Benson et al., 2000; Springel et al., 2001). Another approach consists in carrying out -body + hydrodynamical simulations that include both gas and dark matter (e.g. Katz et al., 1996; Pearce et al., 2001; White et al., 2001). These simulations provide an explicit description of gas dynamics, but they are still limited by relatively low mass and spatial resolution and by computational costs that become highly prohibitive for simulations of galaxies within large cosmological volumes. Recent work has analysed the properties of galaxies in hydrodynamical simulations (e.g. Frenk et al., 1996; Pearce et al., 1999; Nagamine et al., 2005; Nagai & Kravtsov, 2005; Romeo et al., 2005; Saro et al., 2006; Oppenheimer & Davé, 2006; Simha et al., 2008), but some difficulties are persistent. Albeit some recent progress (e.g., Mayer et al., 2008), it remains difficult for example to produce realistic and rapidly rotating disks from cosmological initial conditions (e.g. Scannapieco et al., 2009).
In this paper, we will carry out a comparison between predictions of SAMs and of SPH hydrodynamical simulations for the properties of galaxies inside and around galaxy clusters. In order to minimize the uncertainties related to different treatments of energetic feedback processes from supernovae and AGN, we have considered only radiative gas cooling, and assumed that cooled gas is instantaneously transformed into stars. It is important to stress that already at this basic level, the different ways in which cooling is treated by SAMs and hydrodynamical simulation codes may lead in principle to non-negligible differences (e.g., Viola et al., 2008).
Semi-analytic models assume that the haloes are spherically symmetric and that the gas is efficiently shock heated to the ‘virial temperature’ of the halo. Hydrodynamical simulations do not require any specific assumption on halo geometry, and solve explicitly the hydrodynamic equations describing the evolution of the gas that is, however, represented by a discrete number of fluid elements. Is is difficult, given these limitations, to understand which of the two techniques gives the correct answer. While a comparison of the ‘full semi-analytic model’ with simulations that attempt to include all physical processes at play would be of interest, a correct interpretation of the results of such a comparison will necessarily require a good understanding of any discrepancy induced by a different treatment of gas cooling. In addition, it would be very difficult to understand the origin of any similarity or difference between results from non stripped-down versions of SAMs and simulations, as most of the physical processes one would need to consider (e.g. feedback) are necessarily included using quite different ‘recipes’.
Previous studies (e.g. Benson et al., 2001; Yoshida et al., 2002; Helly et al., 2003; Cattaneo et al., 2007) have compared numerical predictions from stripped-down versions of semi-analytic models with those from hydrodynamical simulations to verify whether these methods provide consistent predictions in the idealized case in which only gas cooling is included.
In this study, we will present both a statistical comparison and an object-by-object comparison between the two techniques. To this aim we use a simulation of a massive cluster, and calculate the merger trees directly from the simulation. While our results agree with those of previous studies in showing that the two methods provide results that are statistically consistent, we will highlight that significant differences arise when focusing on an object-by-object comparison, particularly in the high-density environment of galaxy clusters. As we will discuss below, some of the discrepancies highlighted in this work have been already noted in previous studies, although the general consensus is that the cooling model usually employed in SAMs is in good agreement with hydrodynamical simulations that adopt the same physics.
The layout of the paper is as follows. In Sec. 2 we describe the cluster simulation used in this study, while in Sec. 3 we provide a brief description of the adopted SAM. In Sec. 4 we present a statistical comparison between the cluster galaxy population predicted by the two methods, while in Sec. 5 we focus on a detailed comparison of a sample of galaxies which have been matched in the different runs. Finally, we discuss our results and give our conclusions in Sections 6 and 7.
2 The simulation
In this study, we use a re-simulation of a massive isolated galaxy cluster with 111We define as the mass contained within a radius encompassing a mean density equal to 200 times the critical density of the Universe. and , at (see also cluster g51 from Dolag et al. 2009). The target cluster was identified in a DM only simulation that followed the evolution of DM particles (with a particle mass of ) in a comoving box of size Mpc on a side (Yoshida et al., 2001). The simulation was carried out assuming a flat CDM cosmology with parameters: , , , and . All particles in the target cluster and its immediate surroundings were then traced back to their Lagrangian positions and re-simulated using the Zoomed Initial Condition (ZIC) technique by Tormen et al. (1997), increasing the force and mass resolution in the region of interest. In the high-resolution region, each DM particle has a mass , while gas particles have mass to account for the cosmic baryon fraction.
The simulation was carried out using the TreePM–SPH code GADGET-2 (Springel, 2005), and includes gravitational dynamics, gas cooling, and a simple scheme of star formation, in which all gas particles colder than K and denser than g cm-3 (corresponding to cm-3 for a gas of primordial composition) are immediately turned into star particles. The simulation does not include a model for supernova and active galactic nuclei (AGN) feedback. The Plummer–equivalent softening length for the gravitational force was set to in physical units from to , while at higher redshifts it was set to in comoving units. The smallest value assumed for the smoothing length of the SPH kernel is half the gravitational softening.
Simulation data were stored in 93 outputs that are approximately logarithmically spaced in time down to , and approximately linearly spaced in time thereafter. For each snapshot, we have run a standard friends-of-friends (FOF) algorithm with a linking length of 0.2 in units of the mean particle separation. Each FOF group was then decomposed into a set of disjoint substructures, identified by the SUBFIND algorithm (Springel et al., 2001) as locally over-dense regions in the density field of the background main halo. For our simulation, we have used a slight modification of the SUBFIND algorithm (for details, see Dolag et al. 2009) which links together all high-resolution particles (DM, gas, and star particles). Only subhalos that retain at least 20 bound DM particles, after a gravitational unbinding procedure, are considered ‘genuine substructures’. We note that SUBFIND classifies all particles inside a FOF group either as belonging to a bound substructure or as being ‘unbound’. The self-bound part of the FOF group itself will then also appear in the substructure list, and represents what we will refer to below as the ‘main halo’. This particular subhalo contains typically per cent of the mass of the FOF group (e.g. Springel et al. 2001). The group catalogues were finally used to construct merger histories of all gravitationally self-bound structures using the software originally developed for the Millennium Simulation project222http://www.mpa-garching.mpg.de/galform/virgo/millennium/. We refer to Springel et al. (2005) and to De Lucia & Blaizot (2007) for a detailed description of the merger tree construction algorithm. These merger trees represent the basic input needed by the semi-analytic model used in our study (see Section 3). In the following, we will refer to all quantities related to the simulation using the label SPH.
3 The semi-analytic model
We use a stripped-down version of the semi-analytic model described by De Lucia & Blaizot (2007), which builds upon the methodology originally introduced by Kauffmann et al. (1999), Springel et al. (2001), and De Lucia, Kauffmann & White (2004). In order to carry out a fair comparison with the simulation described above, all physical processes in the semi-analytic model have been switched off, with the exclusion of gas cooling and star formation.
Gas cooling is modelled following White & Frenk (1991). The hot gas within dark matter haloes is assumed to follow an isothermal profile:
Following De Lucia et al. (2004), we define a cooling radius as the radius at which the local cooling time is equal to the halo dynamical time333We note that White & Frenk (1991) defined the cooling radius equating the cooling time to the age of the Universe, which is about one order of magnitude larger than the halo dynamical time. As explained in De Lucia et al. (2004), this particular choice was required by the significant enhancement of cooling rates in galaxy-size haloes when adopting metal dependent cooling functions.. When the cooling radius lies within the virial radius, the gas is assumed to cool quasi-statically and the cooling rate is modelled by a simple inflow equation:
At early times and for low-mass haloes, the formal cooling radius is larger than the virial radius. In these conditions, the hot gas is never expected to be in hydrostatic equilibrium and the cooling rate is essentially limited by the gas accretion rate. In this ‘rapid cooling regime’, we assume that all new diffuse gas that is added to the halo, is accreted immediately onto the central object of the halo under consideration. We note that different assumptions are made in other published semi-analytic models (e.g. a cored gas profile profile, and the inclusion of a free-fall time for gas to be incorporated into the model galaxies). The model used in this paper, however, has been shown to produce results that are in good agreement with –body hydrodynamical simulations that adopt the same physics (Yoshida et al., 2002). In addition, it provide results that are in quite good agreement with other semi-analytic models which adopts more realistic assumptions about the hot gas profile (De Lucia et al., in preparation).
To simplify our comparison with simulation results, we have also adopted a simplified star formation recipe: all gas that condenses onto central objects via radiative cooling is immediately (rather than on a disk dynamical timescale) turned into stars. No other physical process (e.g. supernova and AGN feedback, gas and/or metal recycling) is considered.
We recall that the semi-analytic model adopted in this study includes explicitly dark matter substructures: the haloes within which galaxies form are still traced even when accreted onto larger systems. As explained in Springel et al. (2001) and De Lucia et al. (2004), the adoption of this particular scheme leads to the definition of three different ‘types’ of galaxies. Each FOF group hosts a ‘Type-0’ galaxy, that is located at the position of the most bound particle of the main halo, and is the only galaxy fed by radiative cooling from the surrounding hot halo medium. All galaxies attached to distinct dark matter substructures are referred to as ‘Type-1’. These galaxies were previously central galaxy of a halo that later merged onto the larger system in which they currently reside. Positions of these galaxies are given by those of the most bound particles of the subalos tracing the surviving cores of the accreted haloes, while velocities are the mass weighted mean velocities of all the selfbound particles. The hot reservoir that is originally associated with the merging galaxy, is assumed to be kinematically stripped at the time of accretion and is added to the hot component of the remnant halo. Tidal truncation and stripping rapidly reduce the mass of dark matter substructures below the resolution limit of the simulation (De Lucia et al., 2004; Gao et al., 2004). When this happens, we estimate a residual surviving time for the satellite galaxies, using the classical dynamical friction formula by Chandrasekhar (1943) (see also Saro et al. 2008). The positions and velocities of these galaxies are followed by tracing the most bound particles of the subhalos at the last time they were identified, before being disrupted. Galaxies no longer associated with distinct dark matter substructures are referred to as ‘Type-2’ galaxies, and their stellar mass is assumed not to be affected by the tidal stripping that reduces the mass of their parent haloes.
We note that, by construction, the merger trees extracted from our simulation will not include any Type-2 galaxy (only subhalos with more than 20 DM particles are retained). In order to show how the semi-analytic results are affected by the inclusion of a dynamical friction time-scale, we will analyse in the following two different runs. We will use the label SAM to refer to a run in which, whenever a subhalo falls below the resolution limit, its galaxy is assumed to merge instantaneously with the galaxy sitting at the centre of the main halo. This SAM run allows us to carry out a fair object-by-object comparison between the simulation and the semi-analytic results. We will also show results from a model that includes the dynamical friction formulation described in De Lucia & Blaizot (2007) and Saro et al. (2008). These results will be indicated using the label SAM2. We note that the SAM2 run should be compared with the SAM run, rather than with the SPH simulation.
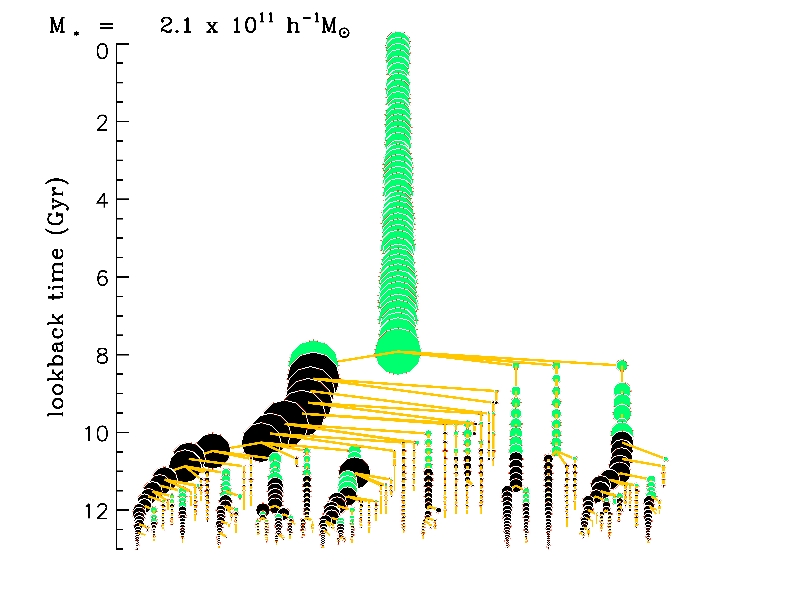
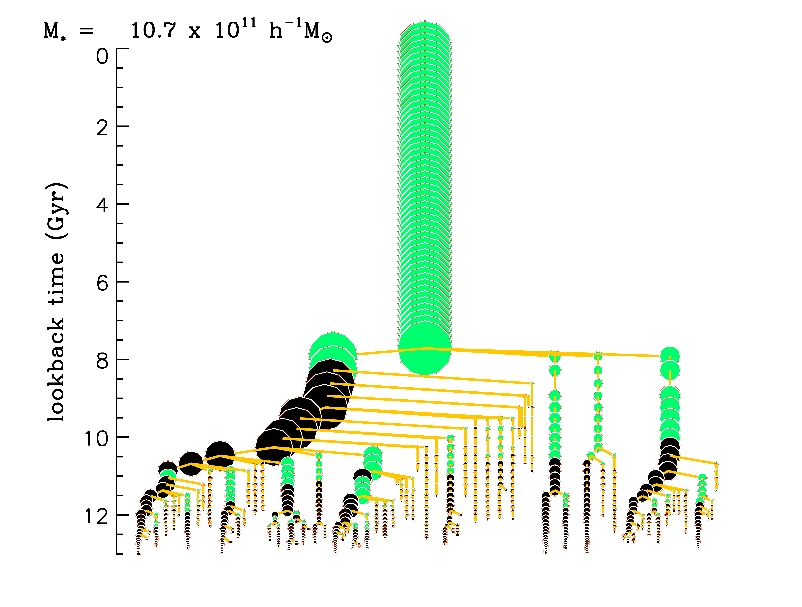
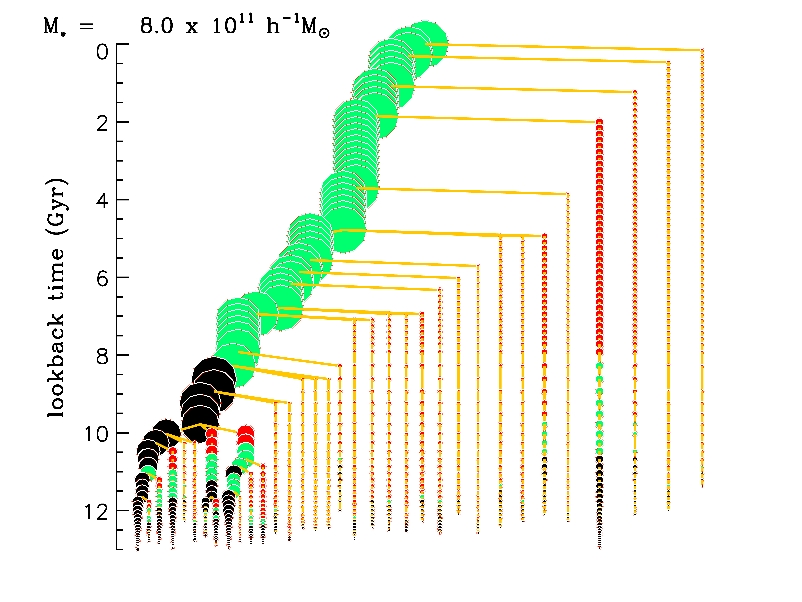
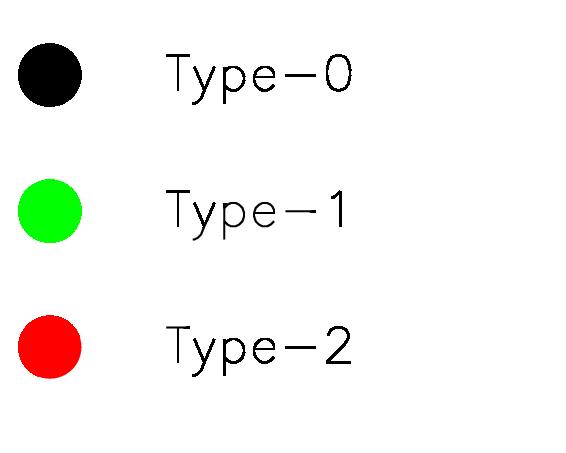
To illustrate how results from the hydrodynamical simulation and from the semi-analytic model used in this study compare to each other, we show in Figure 1 the merger tree of the sixth most massive satellite galaxy within at . The upper left panel corresponds to the merger tree extracted from the SPH simulation, while the corresponding trees from the SAM and SAM2 runs are shown in the upper right and in the lower left panel, respectively. In this figure, the size of the symbols scales as the square root of the galaxy stellar mass, and different colours correspond to different galaxy Types (black for Type-0, green for Type-1, and red for Type-2 galaxies). We recall that by construction, the SPH simulation and the SAM run do not contain Type-2 galaxies. This galaxy population is only present in the SAM2 run.
The final stellar masses of the SAM and SAM2 galaxies are and , respectively. The SPH galaxy has a stellar mass of , lower than the corresponding SAM and SAM2 value by a factor five and four, respectively. Figure 1 shows that the SAM2 merger tree has fewer branches than the corresponding SPH and SAM trees. This happens because of the large number of surviving Type-2 galaxies which are progenitors of the final galaxy in the SPH and SAM runs as we set the merging times equal to zero once the parent substructure falls below the 20 DM particles limit. In the SAM2 run, these galaxies are assigned a residual merging time which is longer than the time interval between the lookback time corresponding to their ‘appearance’ and present, and are therefore not included in the merger tree shown in the bottom panel of Figure 1.
The figure shows that in the SAM and SAM2 runs, galaxies increase their stellar mass mostly while they are Type-0 central galaxies and gas is allowed to radiatively cool towards their centres to form stars. Satellite Type-1 galaxies can increase their stellar mass only via merging. In the semi-analytic model, their stellar mass never decreases as stellar stripping is not modelled. In contrast, in the SPH simulation, satellite Type-1 galaxies continuously loose mass because of tidal interactions with the main halo. The stellar material that is lost is deposited in a diffuse stellar component that is associated with the central galaxy of the main halo by SUBFIND. By the time satellite galaxies merge in SPH simulation, their stellar masses are significantly reduced. We will come back to this issue in Sections 4 and 5.
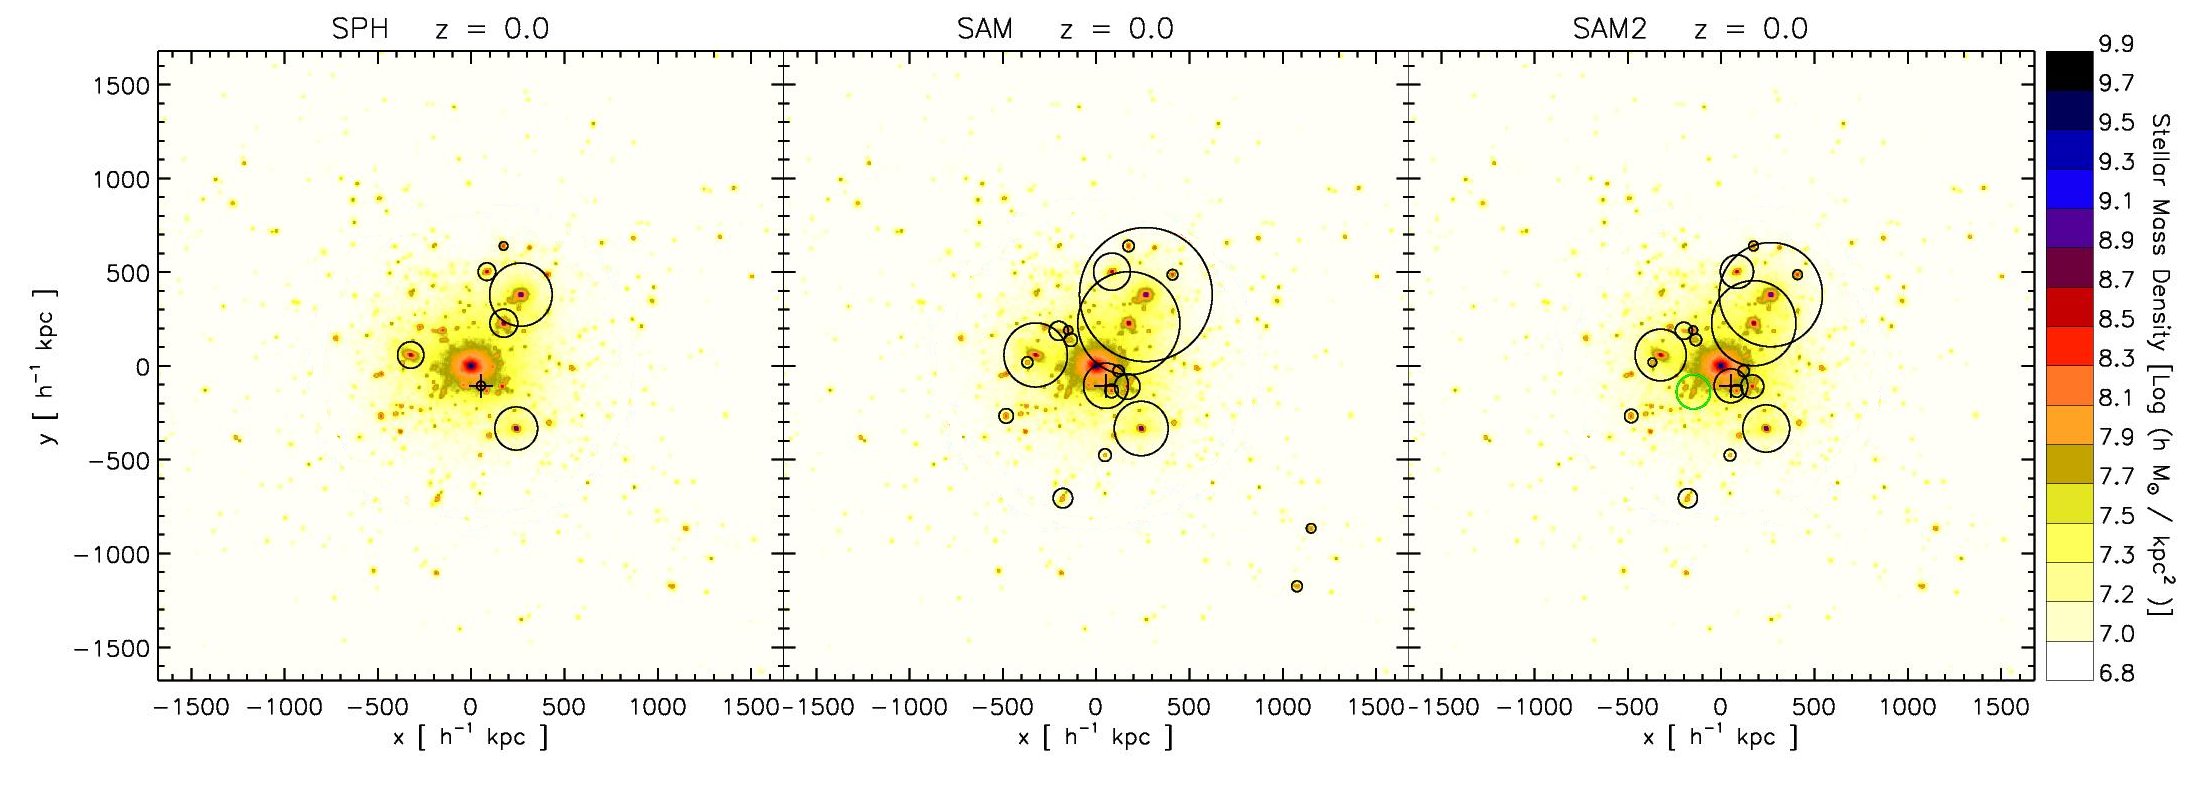
Figure 2 shows the stellar mass density within a box of on a side, centred on the main halo of the cluster. Superimposed on each map are the positions of all the satellite galaxies with stellar mass larger than . Each satellite galaxy is indicated by an open circle whose radius scales with the galaxy stellar mass. Each panel corresponds to a different run (left to SPH, central to SAM, and right to SAM2). Only one Type-2 galaxy is found in this region in the SAM2 run, and is marked with a green circle. Position of the sixth most massive galaxy in the simulation shown in Fig. 1 is marked with a cross. The figure shows that the satellite galaxies in the SPH run are significantly less massive than those in the SAM and SAM2 run, because of the tidal stripping of stars discussed above. As a consequence, semi-analytic runs contain a larger number of massive galaxies within the virial radius.
4 A statistical comparison
In this Section, we will carry out a statistical comparison between the properties of galaxies from the SPH simulation and those from the SAM and SAM2 runs. In particular, we will focus on the radial density distribution and on the stellar mass function. In the next section, we will then carry out a more detailed object-by-object comparison.
Figure 3 shows the radial density distribution of all galaxies lying within at . The dotted black line shows the distribution of galaxies identified in the SPH simulation, while the dashed red and solid green lines corresponds to the SAM and SAM2 runs respectively. The dot-dashed blue line shows the total mass density profile, normalised to match the radial number density of galaxies in the SAM2 run at . As shown by Gao et al. (2004), a run that includes Type-2 galaxies traces better the mass density profile, while the corresponding distributions from the SPH and SAM runs are anti-biased with respect to the matter distribution in the inner regions, as the subhalo profiles (De Lucia et al., 2004; Gao et al., 2004). Interestingly, the contribution from the Type-2 population in the SAM2 run remains significant also at large radii, and even beyond the cluster virial radius.
Figure 3 indicates a small excess of SPH satellites with respect to the SAM results, in the inner central bin. We have verified that this small excess is due to galaxies which do not have any counter-part in the SAM run because of a failure of the merger tree reconstruction algorithm. In order to maximize the algorithm performance for haloes that are close to the 20 particles limit, whenever a descendant of a halo under consideration is not found in the next simulation snapshot, the algorithm also searches for a descendant in the subsequent snapshot. Close to the resolution limit, however, there are a few haloes that disappear for more than two contiguous snapshots. These are identified at a later time as satellite galaxies with a non-zero stellar mass in the simulation. In the semi-analytic model, gas is allowed to cool only on central galaxies of ‘main haloes’. Since these structures appear as ‘subhalos’, no new galaxy is formed within them. There will be, however, a type 2 galaxy associated with the (erroneously) lost Type-1 galaxy. We have verified that this ‘failure’ is actually occurring for all Type-2 galaxies in the SAM2 run whose associated merging times are large enough to let them survive as distinct galaxies down to . The positions assigned to the Type-2 galaxies coincide with those of the Type-1 SPH galaxies which are erroneously identified as new.
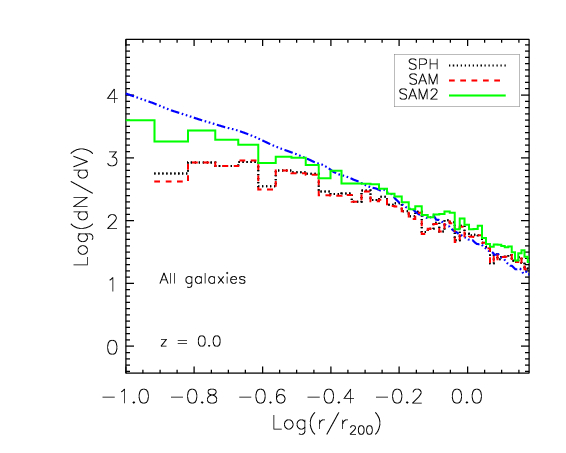
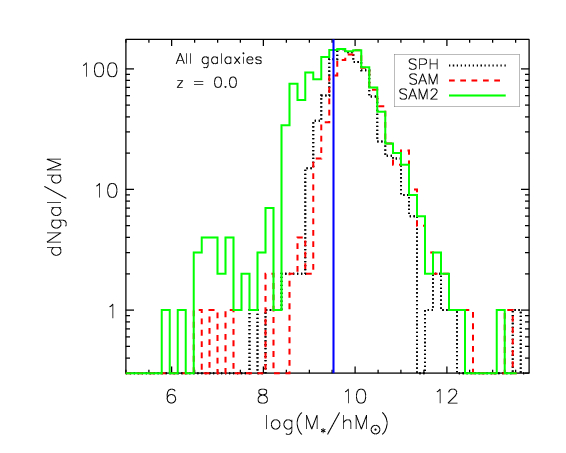
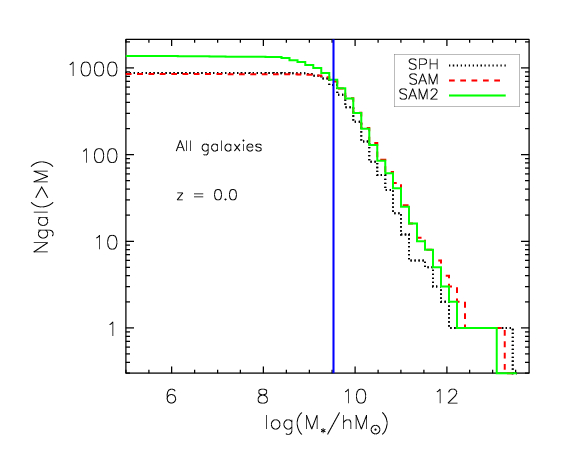
Figure 4 shows the stellar mass function of all galaxies identified within at . The differential and cumulative mass functions are shown in left and right panel, respectively. Dotted black lines represent the stellar mass function of galaxies identified in the SPH run, while red and green lines correspond to the SAM and SAM2 runs, respectively. The solid vertical blue lines in the two panels mark the mass corresponding to the cosmic baryonic fraction multiplied by the mass of 20 DM particles, and therefore roughly corresponds to the resolution limit of the simulation.
The figure shows that the stellar mass of the SAM BCG is larger than the corresponding value in the SAM2 run, but smaller than the corresponding value in the SPH run. We recall that the latter value includes the intra-cluster light. The difference between the SAM and SAM2 BCGs is mainly due to the lower number of progenitors of the SAM2 BCG (see Figure 1), which translates in a much larger (by about 50 per cent) number of galaxies at with respect to the SAM (and SPH) run, as clearly shown by the cumulative mass functions. As explained above, there are more massive galaxies in the SAM run than in the SPH simulation. As we will see in the following, the differences between the SPH and the semi-analytic runs can be explained as a combination of tidal stripping of stars from the SPH satellite galaxies, and to different predicted star formation histories for the BCGs.
5 An object-by-object comparison
The dynamical evolution of central galaxies and of satellite Type-1 galaxies in the semi-analytic model is based on merger trees that are equivalent to those extracted from the SPH simulation. This allows us to identify a sample of galaxies which includes all those at that have the same positions in all three runs. This sample includes all central Type-0 galaxies and all satellites Type-1 galaxies, with the exception of those Type-1 satellites in the SPH run which do not have a counterpart in the SAM and SAM2 runs as described in Section 4.
5.1 General behaviour
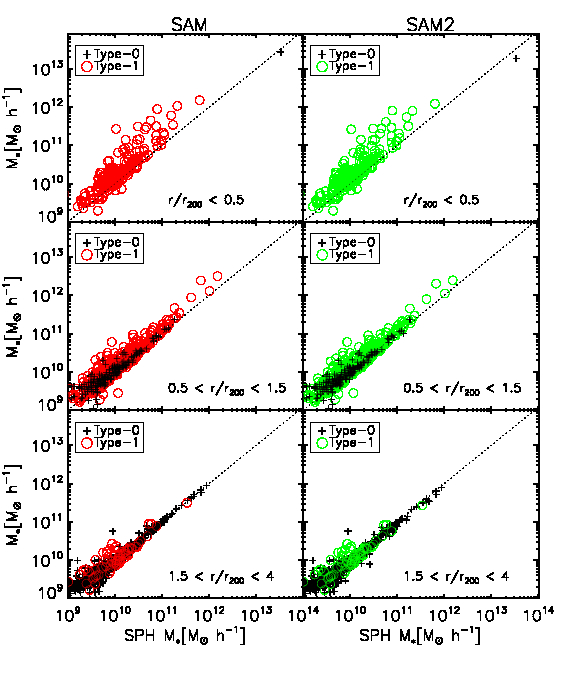
Figure 5 shows the stellar mass of matched galaxies at as predicted by the SPH simulation (x-axis), by the SAM run (y-axis, left panels), and by the SAM2 run (y-axis, right panels). Type-0 central galaxies are shown as black crosses, while Type-1 satellite galaxies are shown as red circles for the SAM run and as green circles for the SAM2 run. The dotted line in each panel represents the one-to-one relation. Different panels correspond to different radial bins, with cluster-centric distance increasing from top to bottom panels.
In the innermost region of the cluster (upper panels), corresponding to galaxies at distances smaller than , there is only one Type-0 central galaxy, which is the BCG itself. On average, satellite galaxies in the SAM and SAM2 runs tend to be more massive than in the SPH simulation, even by more than one order of magnitude. The scatter above the one-to-one relation is also larger in the innermost radial bin. For central Type-0 galaxies, the agreement between the simulation and the semi-analytic runs is better. We note, however, that the SPH BCG has a stellar mass that is and per cent larger than the corresponding values in the SAM and SAM2 runs, respectively. In the next section, we will show that these differences are mainly due to tidal stripping of stars from satellite galaxies in the SPH simulation. At larger distances from the cluster centre, the importance of tidal stripping decreases and the agreement between the SPH and the semi-analytic runs improves.
5.2 Evolution of the Brightest Cluster Galaxies
As discussed above, the SPH simulation predicts for the BCG a stellar mass that is larger than the corresponding values found in the SAM and SAM2 runs. In this section, we discuss in more detail the origin of this differences. As explained above, the BCG mass in the SPH simulation includes the diffuse stellar component. The semi-analytic model used here does not account for tidal stripping of stars from satellite galaxies and does not model explicitly the formation of the ICL. However, Murante et al. (2007) have shown that most of the diffuse stellar component does not come from tidal stripping but originates from mergers associated with the formation of the BCG. Thus the SAM BCG will also include the ICL, with the exclusion of the (small) contribution of stellar material that was tidally stripped from satellite galaxies.
In Figure 6, we show the mass accretion and star formation history of the BCG as predicted by the SPH simulation (black lines), by the SAM run (red lines) and by the SAM2 run (green lines). The upper left panel shows the number of progenitors of the BCG as a function of lookback time for the three runs. As explained in Section 3, the number of progenitors in the SPH simulation and in the SAM run is larger than in the SAM2 run. This difference is due to the Type-2 galaxies, which maintain their identity down to in the SAM2 run. By construction, this population of galaxies does not exist in both the direct simulation and in the SAM galaxy catalogue, which are based on equivalent merger trees. In these runs, whenever a substructure ‘merge’ (i.e. falls below the resolution limit of the simulation), the associated galaxy is assumed to merge instantaneously with the central galaxy of its halo. Thus, the number of progenitors is higher in these two runs. The merging rate (the derivative of the curve shown in the top left panel of Figure 6) predicted by the SPH and by the SAM runs looks quite different from the one predicted by the SAM2 run. In particular, the merging rate is almost linear along the whole galaxy history in the SAM2 run, while in the SPH simulation and in the SAM run it is characterised by a phase of high merging activity before lookback time Gyrs, followed by a shallow decline which lasts down to a lookback time Gyrs, and then another phase of high merging activity in the past 2 Gyrs.
The upper right panel of Figure 6 shows the star formation history of the BCG (obtained by summing up the star formation histories of all its progenitors). The star formation histories predicted by the three models differ significantly. The SPH BCG exhibits an intense initial burst of star formation at lookback time Gyrs, followed by a sharp decline. After lookback time Gyrs, the star formation rate associated with the BCG is roughly constant at a value of yr-1. The corresponding star formation histories from the semi-analytic model look very different. As for the SPH BCG, the SAM run exhibits an initial burst of star formation at early times. This burst is, however, less intense and broader than the one predicted by the SPH simulation. The different intensity of the initial burst of star formation might be due to inaccurate/simplified treatment of the ‘rapid cooling regime’. In the semi-analytic model used in this study, all hot gas associated with the main halo is assumed to condense instantaneously onto the central galaxy when the formal cooling radius is larger than (see Section 3). This simple implementation does not seem to describe accurately the deposition of cold gas along filaments that penetrate the virial radius without being heated to the virial temperature (Dekel et al. 2008 and references therein).
In the last Gyrs, the star formation history of the SAM BCG is roughly constant with an average star formation rate of yr-1. For the SAM2 BCG, the star formation history appears roughly constant along the whole history of the galaxy with an average value of yr-1. It is close to the values predicted in the SAM run in the last Gyrs, but is significantly lower than the corresponding values predicted in the SAM run and SPH simulation at early times. This difference can be ascribed to the lower number of progenitors of the SAM2 BCG, as shown in the upper left panel. Indeed, the Type-2 galaxy population, which is present in the SAM2 run, has formed its stellar mass at very early times.
As explained above, our comparison is based on a stripped-down version of the semi-analytic model and on a simulation in which star formation is treated in a very similar way. Hence, any difference in the predicted star formation histories reflects a difference in the amount of gas that cools in the model and in the simulation. The ‘bursty’ behaviour of the star formation histories predicted in the SAM and SAM2 runs is therefore due to differences in the predicted cooling rates, and not to bursts induced by mergers. As explained in Section 3, the amount of gas that cools () in the semi-analytic model is proportional to the mass of gas enclosed within the cooling radius (). The hot gas is assumed to follow an isothermal profile, so the density of gas at a radius scales as . Therefore, the total mass of gas within a certain radius is . In absence of any feedback, gas particles in the SPH simulation assume a radial profile that is not well described by an isothermal distribution (see Borgani et al. 2006). Figure 7 shows the DM, star and gas mass enclosed within a given radius as a function of cluster-centric distance. The innermost regions of the cluster () are dominated by the stellar component (dashed red line), while the outer regions are dominated by DM (black solid line). Satellite galaxies and the diffuse intra-cluster light associated with the BCG make the stellar component contributing more than the gas component at . At larger radii, the gas component represents the dominant baryonic component. The dotted blue line in Figure 7 represents the resulting gas profile assumed to compute the gas cooling rate in the SAM runs. At the virial radius , the gas mass measured from the SPH simulation agrees very well with the gas mass predicted by the SAM run. For radii smaller than , the gas distribution assumed in the semi-analytic model differs significantly from the actual gas distribution in the simulation. Here, cooling at high redshift has already removed low entropy gas, leaving only a small amount of gas able to cool at lower redshift. At , our semi-analytic code computes a cooling radius for the main cluster of . Figure 7 shows that, within this radius (marked by a vertical dotted line), the total gas mass assumed by the semi-analytic model is about a factor four larger than the gas mass present in the SPH simulation. The predicted cooling rate at , and therefore the predicted star formation rate in the SAM run, will be about a factor four larger than in the SPH run, as shown in the upper right panel of Fig. 6. We note that not all semi-analytic models (e.g. Cole et al. 2000 and derivative papers) use this approximation. The different behaviour between semi-analytic models and hydrodynamical simulations, however, is exacerbated in runs without feedback, like those considered in our analyses. When a model for efficient supernovae and/or AGN feedback is included, a larger amount of gas is allowed to remain in the hot phase in the central regions, thus possibly alleviating the disagreement shown in Figure 7.
The lower left panel of Figure 6 shows the total mass in all BCG progenitors, in the three runs considered in our study. In the SPH simulation, there is a first phase (at lookback time larger than 9 Gyrs) characterized by a steep increase in mass, which corresponds to the initial intense burst of star formation shown in the top right panel. The stellar mass stays almost constant between 8 and 6 Gyrs ago, and then increases rapidly down to present time. This behaviour is in quite good agreement with predictions from the SAM run. In contrast, the SAM2 run exhibits an approximately linear accretion history, consistent with the approximately constant star formation history shown in the top right panel. These accretion histories are shown again in the lower right panel, together with the integrals of the star formation histories shown in the top right panel. For the SAM and SAM2 runs, the total mass in progenitors matches the integrals of the star formation histories (dotted and solid lines overlap perfectly). Indeed, all the stars that are associated with the BCG at present in these runs, were formed in BCG progenitors. This is not the case in the SPH simulation, where the two curves start diverging below lookback time Gyrs. By , the integral of the star formation rate of all BCG progenitors is responsible for only about half of the final stellar mass. Interestingly, even if the star formation histories of BCGs predicted by the simulation and the semi-analytic runs differ significantly, their integrals agree within per cent for the SPH and SAM2 run. For the SAM run, the integral of the star formation history is about a factor two larger than that measured from the SPH simulation and from the SAM2 run. At , the integrated total mass of the BCG is , and for the SPH, SAM, and SAM2, respectively.
Part of the excess mass associated with the SPH BCG and not formed in its progenitors, comes from diffuse star formation occurring in unresolved galaxies which eventually merge with the BCG by redshift (see also Saro et al. 2009). To compute the star formation rate associated with each SPH galaxy, we have summed all the star particles in the galaxy under consideration with formation time lower than the time-interval between two adjacent snapshots. Galaxies that are formally unresolved and that form outside the FOF group of the main halo, will not appear in the galaxy merger tree. Therefore, their contribution is not taken into account when computing the star formation history shown in the top right panel of Figure 6. Their stellar mass, however, contributes to the total masses shown in the bottom left panel, once these galaxies merge with the BCG.
The largest contribution to the excess stellar mass not formed in the SPH BCG progenitors, however, comes from stars that formed in Type-1 satellites and that were tidally stripped and added to the diffuse ICL associated with the main cluster. We note that SUBFIND does not separate the stars bound to the BCG from the diffuse stellar component (e.g., Murante et al., 2007), so that the BCG ‘stellar mass’ will include this component. To quantify the contribution due to the diffuse stars, we have identified all satellite galaxies of the SPH BCG and traced them back in time until their stellar mass reaches a maximum. This time corresponds approximately to the last time the galaxy was a central galaxy of its own halo. We then sum up the differences between their maximum masses and their masses at , and obtain a total mass of . Interestingly, this amount corresponds almost exactly to the difference between the final stellar mass associated with the SPH BCG at and the integral of its star formation history. We caution, however, that SPH galaxies may be too fragile (Saro et al., 2006), boosting the significance of this effect. In particular, the larger fraction of stellar mass formed at early times in absence of any regulating feedback mechanism, is enhancing this effect, thus over-predicting the amount of ICL.
5.3 Evolution of satellite galaxies
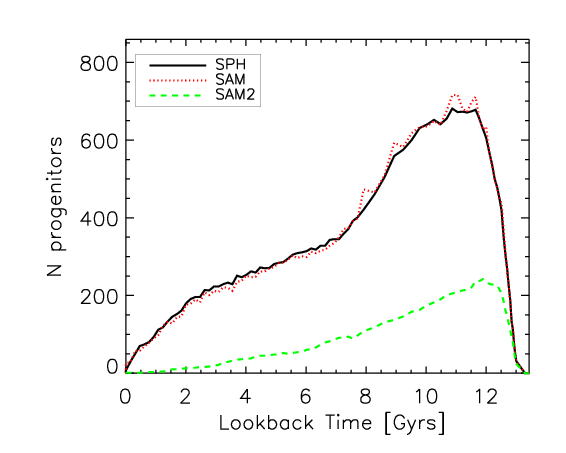
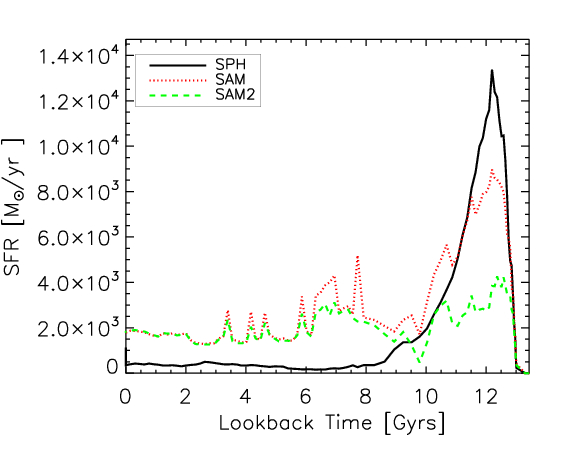
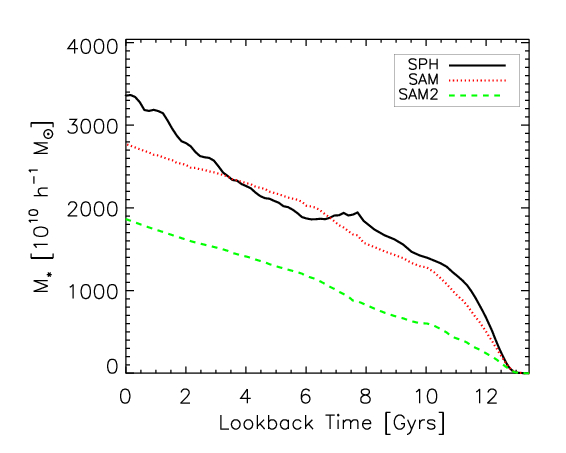
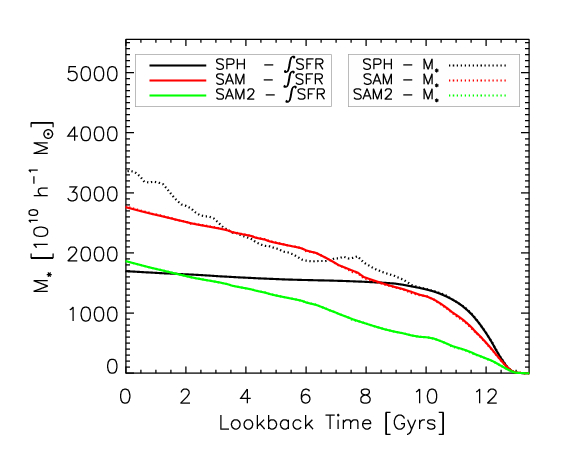
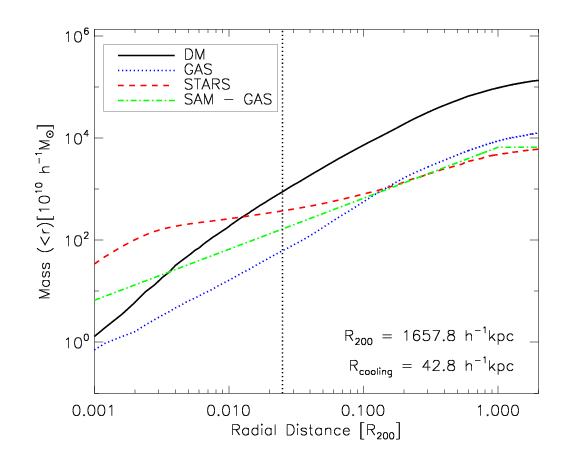
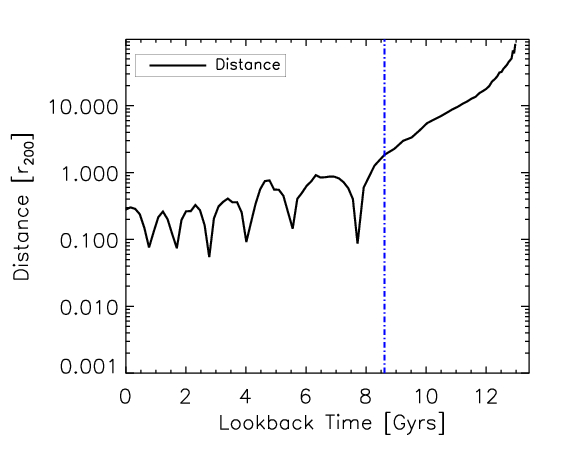
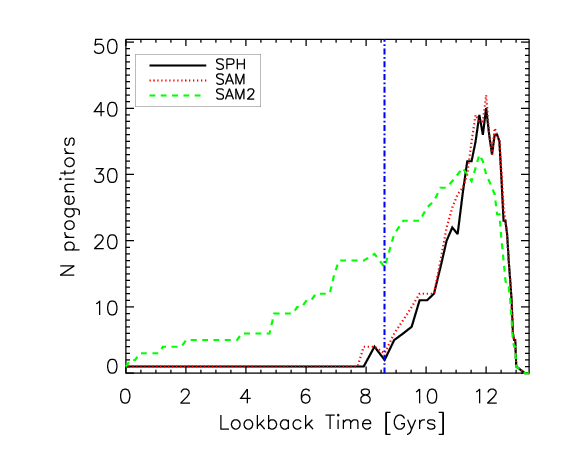
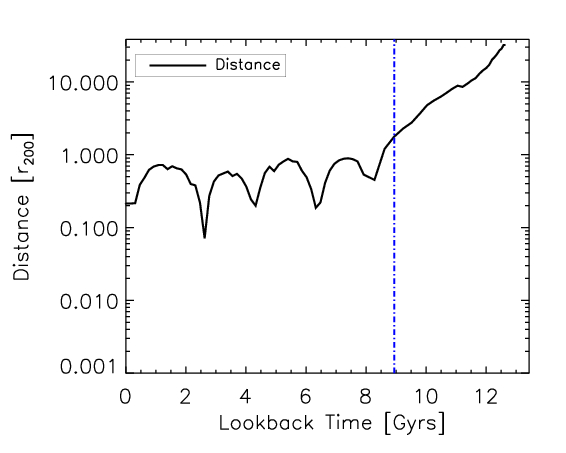
Figure 8 shows the evolution of the sixth most massive satellite galaxy found in the SPH simulation at , within . The merger trees of this same galaxy in the three runs analysed in this paper were shown in Figure 1. The upper left panel shows how the distance between the main progenitor of the galaxy and the cluster centre varies as a function of lookback time. The vertical line in this (and in all the other panels) marks the time when the galaxy becomes a satellite. This particular galaxy has been orbiting around the cluster centre in the last Gyrs and is currently located at a distance of from the cluster centre. By , the galaxy has completed six orbits and both its apocentric distance and orbital period have decreased as a consequence of dynamical friction. The upper right panel of Figure 8 shows the number of progenitors in the three runs analysed in our study (as we did in Figure 6, for the BCG). The figure shows that both in the SPH and in the SAM run, there is only one merging episode after the galaxy has become a satellite: it happens only Gyrs after the satellite galaxy crossed . In the SAM2 run, the number of progenitors decreases more gradually than in the other two runs, as a consequence of the continuous accretion of Type-2 galaxies.
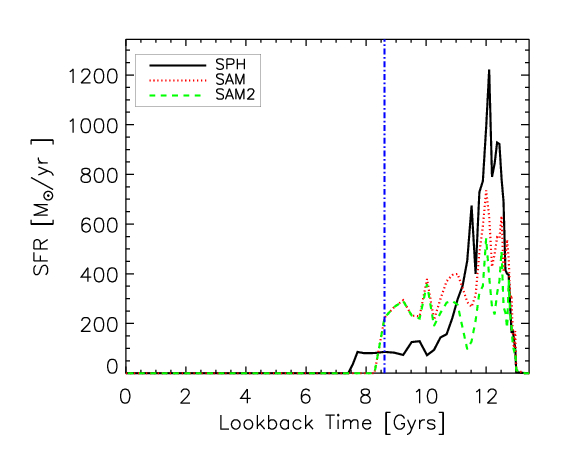
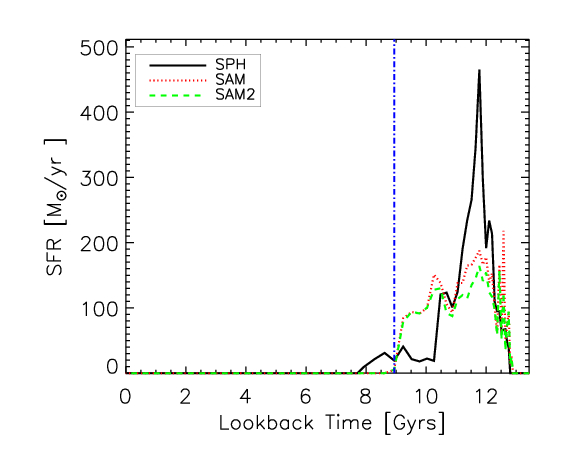
The mid-left panel of Figure 8 shows the star formation history of the galaxy under consideration. All three runs are characterised by an intense burst of star formation at early times, and no star formation in the last Gyrs. As for the BCGs, however, the SAM2 galaxy is characterized by a less intense and broader initial burst, compared to its SPH and SAM counterparts. Interestingly, the star formation associated with the SPH simulated galaxy, lasts for Gyrs after the galaxy has became a satellite. Since all available cold gas is instantaneously turned into stars, new fresh material for star formation must come from cooling on satellite galaxies occurring in the SPH simulation. In the SAM and SAM2 runs, no cooling is allowed on satellite galaxies and all gas available is instantaneously turned into stars. So, by construction, no star formation occurs after the galaxy is accreted onto a larger structure.
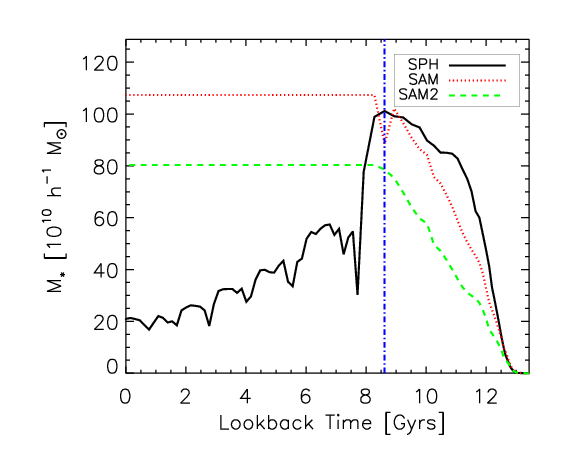
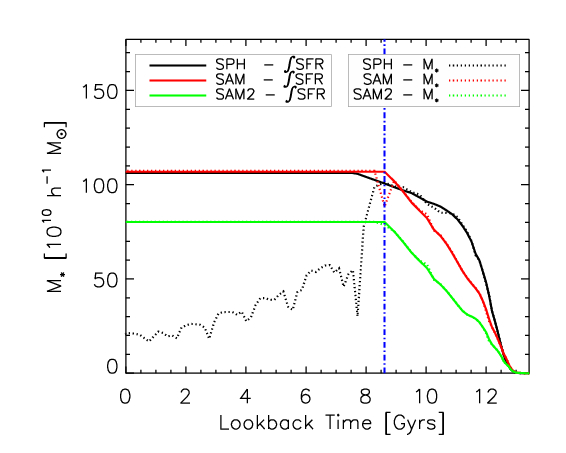
The mid-right panel of Figure 8 shows the total mass in all the progenitors of the galaxy under consideration, as a function of lookback time. The dip in the total stellar mass of the SAM galaxy at the position of the vertical line is due to the adopted merger tree construction algorithm. As explained in Section 4, the algorithm looks for a descendant of each halo in the two following snapshots so that in the dark matter merger trees, haloes are allowed to skip a snapshot. This also happens for the galaxy that is sitting at the centre of this structure, as in Figure 8. In the lower left panel, the total mass in all progenitors is compared to the integrals of the star formation histories, as we did for the BCGs in the lower right panel of Figure 6. As for the BCGs, the total mass for the SAM and SAM2 galaxies overlap perfectly the integral of the corresponding star formation history, confirming that all stars in the final galaxy have been formed in its progenitors. The behaviour of the SPH galaxy is more complicated, and we can identify two different regimes:
-
•
at early times, before the galaxy is accreted onto a larger structure, its stellar mass follows closely the integral of the star formation history.
-
•
as the galaxy crosses the virial radius and becomes a satellite, it starts loosing stellar mass because of tidal interactions with the cluster halo.
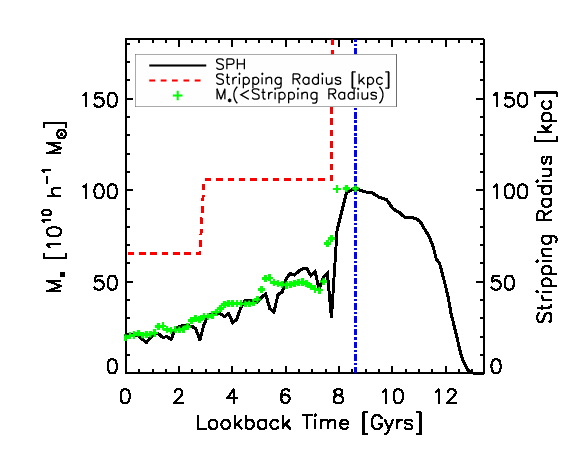
To better understand the mechanism which causes the measured loss of stellar material from the SPH satellite galaxy, we define at each snapshot a representative ‘stripping radius’. This quantity is defined, at each snapshot, as the minimum cluster-centric distance reached by the orbiting satellite galaxy by the time corresponding to the analysed snapshot. This simple estimate of the stripping radius is shown by a red dashed line in the lower right panel of Figure 8, together with the predicted enclosed mass, as a function of lookback time. The figure shows that the galaxy suffers a significant loss of stellar mass during the first orbit, followed by smoother but constant stripping down to . Our estimate of the stripping radius is clearly simplified, but it captures well the evolution of the bound stellar mass as measured from the SPH simulation. At pericentres, SUBFIND tends to under-predict the bound stellar mass with respect to the estimate obtained using the stripping radius defined above. This bias is intrinsic in the SUBFIND algorithm, but cannot account for the total amount of stellar mass loss at the apocentre, as discussed in Natarajan et al. (2007) and Maciejewski et al. (2009) and produces an artificial decrease in mass when a galaxy orbits close to the cluster centre. This artificial loss of stellar material is recovered when the galaxy travels to larger distances.
It is woth noticing that tidal stripping does not represent the main contribution to the formation of the intra-cluster component, whose production is mainly contributed by mergers associated with the formation of BCGs in groups of galaxies (e.g., Rudick et al., 2006; Murante et al., 2007). As noted earlier, SUBFIND is not able to separate the bound galaxy stellar mass from the associated diffuse component. Therefore, at the time the galaxy is accreted onto a larger structure, the galaxy’s stellar mass is a combination of its genuine stellar mass and of its own diffuse light. Tidal interactions are more efficient in stripping the galaxy’s diffuse component, as this material resides at larger radii and is less bound. For the galaxy shown in Figure 8, the minimum stripping radius ( kpc) is larger than the galaxy’s radius, which suggests that the majority of the stellar material lost by the SPH satellite galaxy while orbiting in the cluster potential well is diffuse light of the group that contained the galaxy before it was accreted onto the cluster.
We stress that our simplified estimate of the stripping radius is not meant to provide a ‘model’ to include in semi-analytic models of galaxy formation. Indeed, tidal stripping of stars in SPH simulations might be affected by numerical issues, and it has been demonstrated that no numerical convergence has been achieved over the range of resolutions examined (Murante et al., 2007)
5.4 Effect of the environment
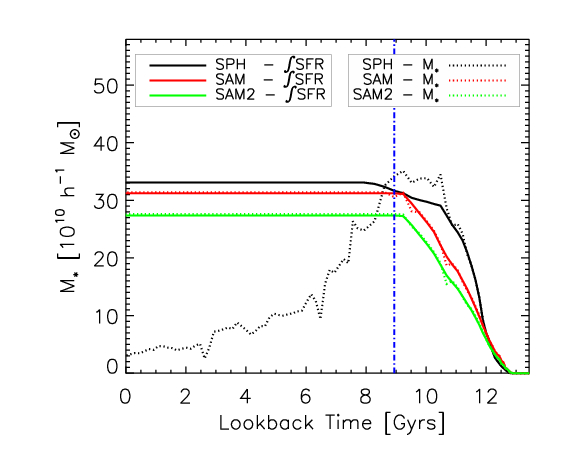
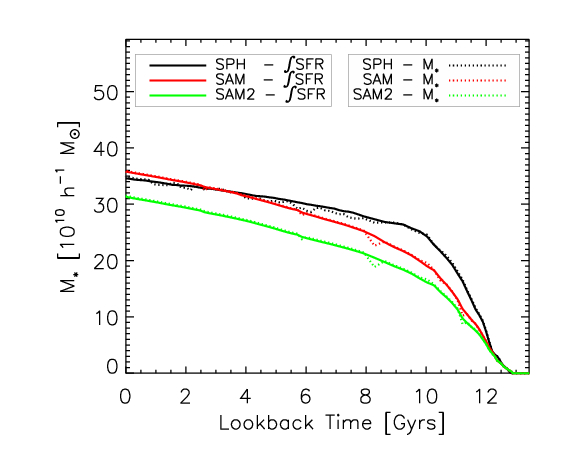
In this section, we study the effect of environment on predictions by the SPH and the semi-analytic model used in our study, by comparing a Type-0 central galaxy with a Type-1 satellite galaxy. In order to carry-out this comparison, we choose two galaxies with similar stellar mass at of about .
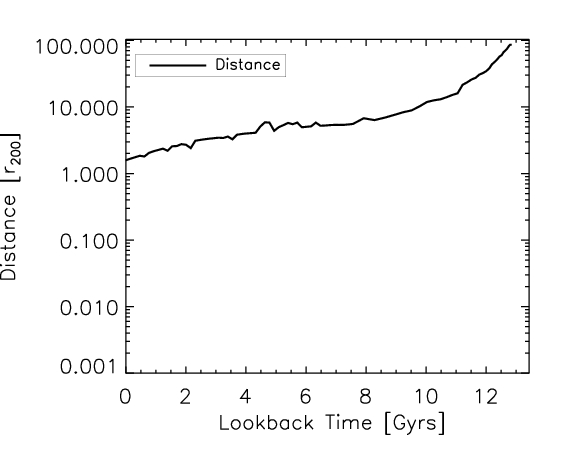
The evolution of the central Type-0 galaxy is shown in the right panels of Figure 9, while the left panels show the corresponding evolution of the satellite Type-1 galaxy. As in Figure 8, the vertical line in the left panels marks the lookback times corresponding to the transition from central to satellite. The upper panels of Figure 9 show the cluster-centric distance of the galaxy’s main progenitor as a function of lookback time. At , the central galaxy is located at a distance of from the cluster centre. The satellite galaxy crosses the cluster virial radius at lookback time Gyrs, completes 5 orbits around the cluster centre with an average period of Gyrs, and lies at from the cluster centre at present.
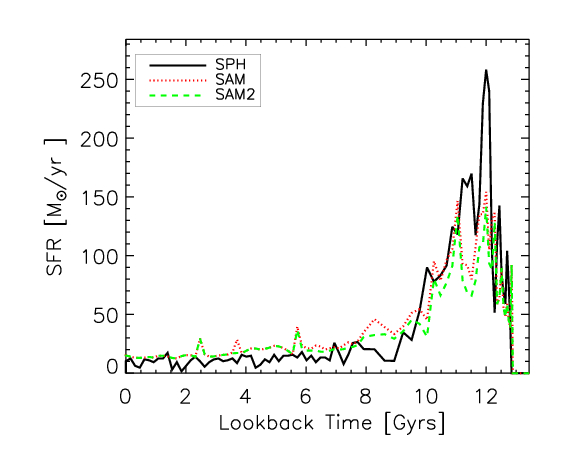
The central panels of Figure 9 show the star formation histories for the two galaxies under consideration in each of the three runs analysed in this study. In all cases, the SPH galaxies exhibit a sharper and more intense initial burst of star formation with respect to the SAM and SAM2 corresponding galaxies, as found for the BCGs. The three runs are in quite good agreement (much better than for the BCG shown in Figure 6) for the Type-0 central galaxy analysed here. All three runs predict a more intense and shorter episode of star formation for the satellite galaxy than for the central galaxy. This is a consequence of our choice to select galaxies with the same final stellar mass. For the central galaxy, the level of star formation is low and approximately constant (around ) during the past 8 Gyrs, while no stars are formed in the satellite galaxy over the same time-interval. As for the satellite galaxy shown in Figure 8, the star formation in the SPH satellite lasts for about one Gyr after the galaxy has been accreted onto the main halo. The closer agreement between the SAM and SAM2 predictions for the central galaxy (right panel) is due to the fact that they lie in a ‘low density’ environment, in which the contribution from the Type-2 galaxy population is less significant than in the main cluster. In addition, in these low-density regions, tidal stripping plays a less important role, leading to a better agreement between the SPH and the SAM results for the central Type-0 galaxies.
The lower panels of Figure 9 show the total stellar mass in all progenitors of the two galaxies and the integral of the corresponding star formation history, as done in Figures 6 and 8. For the central Type-0 galaxy, the mass increases most rapidly in the SPH simulation. The mass growth is somewhat slower in the SAM run, but the predicted final stellar mass is very close to the SPH prediction. In the SAM2 run, the stellar mass grows more slowly and the final stellar mass reaches a lower value than those predicted by the SAM run and by the SPH simulation. For the Type-1 satellite galaxy, the evolution is similar to that shown in the lower right panel (for the central Type-0 galaxy) before the time of accretion. After that time, the stellar mass of the SAM and SAM2 galaxies remains almost constant, while the stellar mass of the SPH satellite decreases continuously down to present time, with a first important drop in stellar mass associated with the first pericentric passage, and a smoother decrease of stellar mass during the following orbits. By , this particular galaxy has lost more than per cent of its stellar mass at the time of accretion.
Summarising, we find a good agreement between the SPH and SAM predictions for central galaxies lying in low-density environments, whereas a different behaviour is found for the satellite galaxies. In particular, tidal stripping of stellar material (a process which is not implemented in the adopted semi-analytic model) is playing a crucial role in determining the final mass of satellite galaxies.
6 Discussion
Our results demonstrate that predictions of a stripped-down version of the semi-analytic model used in our study are in quite nice agreement with results from SPH simulations including the same physics, in ‘average’ density environments. In higher density regions, like galaxy clusters, predictions from simulations and semi-analytic models differ significantly, for physical reasons that are not specific of the model and the simulation used in this work.
At first sight, these considerations appear to be in conflict with conclusions found in previous work (Benson et al. 2001, Yoshida et al. 2002, Helly et al. 2003, Cattaneo et al. 2007). All these studies have carried out comparisons between simulations and stripped-down versions of different semi-analytic models. In particular, Benson et al. (2001) compared the statistical properties of galaxies found in the semi-analytic model developed by the Durham group (they used the model presented by Cole et al. 2000) with SPH simulations. The semi-analytic model used in their study adopted a Monte Carlo technique for building dark matter merger trees. Therefore, it was not possible to carry-out a one-to-one comparison between model and simulation results. A comparison on an object-by-object basis between the same semi-analytic model and simulations was later carried out by Helly et al. (2003). Yoshida et al. (2002) compared predictions from a SPH simulation of a galaxy cluster with those from the Munich semi-analytic model (the implementation described in Kauffmann et al. 1999). More recently, Cattaneo et al. (2007) compared the galaxy population from a SPH simulation with predictions from a stripped-down version of the GalICS model (Hatton et al., 2003). All these studies agree that the two techniques provide results that are statistically consistent.
It is important to stress that our results are not in contradiction with the above mentioned studies. When focusing on a statistical comparison between model and simulation predictions, we also get results that are broadly consistent (see e.g. Figures 5 and 4). Although this is the message that has been generally accepted by the community, we stress that the tension between models and simulations discussed in our paper is also present in previous studies when focusing on an object-by-object comparison. Yoshida et al. (2002) already pointed out that when merging times are computed using the classical dynamical friction formula, semi-analytic models tend to over-predict the number of galaxies with respect to hydrodynamical simulations. A similar conclusion can be inferred by Fig. 4 in Cattaneo et al. (2007). Fig. 8 of the same paper shows that the semi-analytic model predicts larger star formation rates than SPH simulations at low redshift, as we have shown above. Yoshida et al (2002) also noted that some gas is continuing to cool onto the galaxies after they are accreted in a larger halo, in the hydrodynamical simulation. Finally, we note that Benson et al. (2001) already pointed out that the main reason for the differences they found between their stripped-down semi-analytic model and the SPH simulation was that gas cools more efficiently in massive haloes at early times in the SPH simulation, as we have discussed in Section 5.2.
Hydrodynamical simulations of galaxy formation are becoming increasingly sophisticated. The continuous increase of computational power will also allow us to run simulations with higher and higher resolution. It will, however, remain the necessity to use ‘sub-grid’ physics, at least until we will not be able to build a complete theory for the various physical processes that drive galaxy formation and evolution. Semi-analytic models can access a large dynamic range of mass and spatial resolution and allow a fast exploration of the parameter space and of the influence of different physical assumptions. They will therefore remain a valid method to study galaxy formation for the foreseeable future. Given the complementarity between the two techniques, it is important to analyse in more detail any disagreement between model and simulation predictions, so as to test the robustness of numerical predictions and possibly improve semi-analytic calculations.
Quoting Benson et al. (2001), the main conclusion of this paper is that the agreement between the SPH simulation and the stripped-down version of the semi-analytic model is better than a pessimist might have expected. A detailed comparison on an object-by-object basis, however, clarifies that there are important discrepancies between predictions from the two techniques, identifying areas where further work is necessary in order to improve our galaxy formation models.
7 Summary
In this paper, we have carried out a comparison between the cluster galaxy population predicted by hydrodynamical SPH simulations and that predicted by a stripped-down version of a semi-analytic model. Our semi-analytical model and our simulation consider only cooling and a simple prescriptions of star formation, which consists in transforming instantaneously any cold gas available into stars. In addition, we have considered both the case when satellite galaxies merge instantaneously after the mass of the parent subhalo falls below the resolution limit of the simulation, and the case when these galaxies are assigned a residual dynamical friction merging time. By construction, the former implementation can be compared directly with merger trees extracted from the hydrodynamical simulation used in our study. We stress that our results are not meant to be compared with observational data. Rather, the aim of our study is to carry out a detailed comparison between two techniques that are widely used to study galaxy formation and evolution in a cosmological framework, at the stripped-down level considered in this study. It is important to note that, given the limitations of these techniques, neither of them is likely providing the ‘correct’ answer. By exploring the reasons for disagreements, however, we are able to identify areas where further work is needed. The main results of our study can be summarised as follows:
-
1.
For central galaxies, the agreement between predictions from the simulation and the semi-analytic model is quite good outside the cluster environment. For the BCG, the final stellar mass and mass accretion history predicted by the two techniques are also comparable. The predicted star formation histories, however, differ significantly. In particular, the SPH BCG exhibits a lower level of star formation activity at low redshift, and a more intense and shorter initial burst of star formation with respect to the SAM prediction.
-
2.
The higher level of star formation activity predicted by the semi-analytic model at low redshift, is due to the assumption of an isothermal gas distribution, which leads to much larger cooling rates in the semi-analytic model at late times. When neglecting feedback, as we are doing in this study, gas particles in SPH simulations distribute according to a profile that is not well described by an isothermal distribution because cooling at high redshift efficiently removes gas from the inner regions of a galaxy cluster, and leaves small amounts of gas available for cooling at lower redshift. We stress that it is not useful to ‘tune’ the SAM model to reproduce the SPH results because in a more realistic simulation including feedback, the gas profile would be again modified.
-
3.
Only about half of the final stellar mass of the SPH BCG was formed in its progenitors. The other half is contributed material associated with galaxies that were accreted onto the cluster halo. These star particles will later represent the largest fraction of the diffuse stellar component associated with the SPH BCG itself.
-
4.
SPH satellites can loose large fractions of their stellar mass (up to 90 per cent of the stellar mass at the time of accretion), due to tidal stripping. This process is not included in the semi-analytic model adopted in this study, leading to satellite masses which are systematically larger than the corresponding values found in the simulation.
-
5.
In the simulation, some cooling occurs on satellite galaxies. This can last for up to 1 Gyr after accretion but is, however, important only for the most massive satellites. Gas cooling on satellite galaxies is not included in the model used in our study, and in most of the semi-analytic models discussed in the recent literature (for a first attempt to include this process, see Font et al. 2008). More work is, however, needed to clarify how this would be affected by the inclusion of a regulating feedback process in hydrodynamical simulations.
As discussed above, the discrepancies found between semi-analytic predictions and simulation results, identify specific areas where further work is needed in order to improve our galaxy formation models. This will ultimately help us to construct better tools that can assist us in understanding the physical processes driving galaxy formation and evolution.
Acknowledgements
We thank Volker Springel for making available the substructure finder and merger tree construction software that was originally developed for the Millennium Simulation project. We thank Jérémy Blaizot and Pierluigi Monaco for useful discussions. AS acknowledges the receipt of a Marie Curie Host Fellowships from the EARA-EST programme, and the hospitality of the Max-Planck-Institut für Astrophysik where this project was initiated. GDL acknowledges financial support from the European Research Council under the European Community’s Seventh Framework Programme (FP7/2007-2013)/ERC grant agreement n. 202781. This work has been partially supported by the INFN-PD51 grant, by a PRIN-INAF Grant, by the ASI-COFIS Grant and by the PRIN-MIUR Grant “The Cosmic Cycle of Baryons”. Numerical computations have been performed performed at CINECA (“Centro Interuniversitario del Nord Est per il Calcolo Elettronico”), with CPU time assigned thanks to an INAF-CINECA grant.
References
- Baugh (2006) Baugh C. M., 2006, Reports on Progress in Physics, 69, 3101
- Benson et al. (2000) Benson A. J., Cole S., Frenk C. S., Baugh C. M., Lacey C. G., 2000, MNRAS, 311, 793
- Benson et al. (2005) Benson A. J., Kamionkowski M., Hassani S. H., 2005, MNRAS, 357, 847
- Benson et al. (2001) Benson A. J., Pearce F. R., Frenk C. S., Baugh C. M., Jenkins A., 2001, MNRAS, 320, 261
- Bond et al. (1991) Bond J. R., Cole S., Efstathiou G., Kaiser N., 1991, ApJ, 379, 440
- Borgani et al. (2006) Borgani S., Dolag K., Murante G., Cheng L.-M., Springel V., Diaferio A., Moscardini L., Tormen G., Tornatore L., Tozzi P., 2006, MNRAS, 367, 1641
- Boylan-Kolchin et al. (2009) Boylan-Kolchin M., Springel V., White S. D. M., Jenkins A., Lemson G., 2009, ArXiv e-prints
- Cattaneo et al. (2007) Cattaneo A., Blaizot J., Weinberg D. H., Kereš D., Colombi S., Davé R., Devriendt J., Guiderdoni B., Katz N., 2007, MNRAS, 377, 63
- Chandrasekhar (1943) Chandrasekhar S., 1943, ApJ, 97, 255
- Cole et al. (2008) Cole S., Helly J., Frenk C. S., Parkinson H., 2008, MNRAS, 383, 546
- Cole et al. (2000) Cole S., Lacey C. G., Baugh C. M., Frenk C. S., 2000, Mon. Not. R. Astron. Soc., 319, 168
- De Lucia & Blaizot (2007) De Lucia G., Blaizot J., 2007, MNRAS, 375, 2
- De Lucia et al. (2004) De Lucia G., Kauffmann G., Springel V., White S. D. M., Lanzoni B., Stoehr F., Tormen G., Yoshida N., 2004, MNRAS, 348, 333
- De Lucia et al. (2004) De Lucia G., Kauffmann G., White S. D. M., 2004, MNRAS, 349, 1101
- Dekel et al. (2008) Dekel A., Birnboim Y., Engel G., Freundlich J., Goerdt T., Mumcuoglu M., Neistein E., Pichon C., Teyssier R., Zinger E., 2008, ArXiv e-prints
- Dolag et al. (2009) Dolag K., Borgani S., Murante G., Springel V., 2009, MNRAS, 399, 497
- Font et al. (2008) Font A. S., Bower R. G., McCarthy I. G., Benson A. J., Frenk C. S., Helly J. C., Lacey C. G., Baugh C. M., Cole S., 2008, MNRAS, 389, 1619
- Frenk et al. (1996) Frenk C. S., Evrard A. E., White S. D. M., Summers F. J., 1996, ApJ, 472, 460
- Gao et al. (2004) Gao L., De Lucia G., White S. D. M., Jenkins A., 2004, MNRAS, 352, L1
- Gao et al. (2004) Gao L., White S. D. M., Jenkins A., Stoehr F., Springel V., 2004, MNRAS, 355, 819
- Hatton et al. (2003) Hatton S., Devriendt J. E. G., Ninin S., Bouchet F. R., Guiderdoni B., Vibert D., 2003, MNRAS, 343, 75
- Helly et al. (2003) Helly J. C., Cole S., Frenk C. S., Baugh C. M., Benson A., Lacey C., Pearce F. R., 2003, MNRAS, 338, 913
- Katz et al. (1996) Katz N., Weinberg D. H., Hernquist L., 1996, Astrophys. J. Supp., 105, 19
- Kauffmann et al. (1999) Kauffmann G., Colberg J. M., Diaferio A., White S. D. M., 1999, MNRAS, 303, 188
- Lacey & Cole (1993) Lacey C., Cole S., 1993, MNRAS, 262, 627
- Li et al. (2007) Li Y., Mo H. J., van den Bosch F. C., Lin W. P., 2007, MNRAS, 379, 689
- Maciejewski et al. (2009) Maciejewski M., Colombi S., Springel V., Alard C., Bouchet F. R., 2009, MNRAS, 396, 1329
- Mayer et al. (2008) Mayer L., Governato F., Kaufmann T., 2008, Advanced Science Letters, 1, 7
- Murante et al. (2007) Murante G., Giovalli M., Gerhard O., Arnaboldi M., Borgani S., Dolag K., 2007, MNRAS, 377, 2
- Nagai & Kravtsov (2005) Nagai D., Kravtsov A. V., 2005, ApJ, 618, 557
- Nagamine et al. (2005) Nagamine K., Cen R., Hernquist L., Ostriker J. P., Springel V., 2005, ApJ, 618, 23
- Natarajan et al. (2007) Natarajan P., De Lucia G., Springel V., 2007, MNRAS, 376, 180
- Oppenheimer & Davé (2006) Oppenheimer B. D., Davé R., 2006, MNRAS, 373, 1265
- Pearce et al. (1999) Pearce F. R., Jenkins A., Frenk C. S., Colberg J. M., White S. D. M., Thomas P. A., Couchman H. M. P., Peacock J. A., Efstathiou G., The Virgo Consortium 1999, ApJ, 521, L99
- Pearce et al. (2001) Pearce F. R., Jenkins A., Frenk C. S., White S. D. M., Thomas P. A., Couchman H. M. P., Peacock J. A., Efstathiou G., 2001, MNRAS, 326, 649
- Press & Schechter (1974) Press W. H., Schechter P., 1974, Astrophys. J., 187, 425
- Romeo et al. (2005) Romeo A. D., Portinari L., Sommer-Larsen J., 2005, MNRAS, 361, 983
- Rudick et al. (2006) Rudick C. S., Mihos J. C., McBride C., 2006, ApJ, 648, 936
- Saro et al. (2009) Saro A., Borgani S., Tornatore L., De Lucia G., Dolag K., Murante G., 2009, MNRAS, 392, 795
- Saro et al. (2006) Saro A., Borgani S., Tornatore L., Dolag K., Murante G., Biviano A., Calura F., Charlot S., 2006, MNRAS, 373, 397
- Saro et al. (2008) Saro A., De Lucia G., Dolag K., Borgani S., 2008, MNRAS, pp 1229–+
- Scannapieco et al. (2009) Scannapieco C., White S. D. M., Springel V., Tissera P. B., 2009, MNRAS, pp 643–+
- Simha et al. (2008) Simha V., Weinberg D. H., Dave R., Gnedin O. Y., Katz N., Keres D., 2008, ArXiv e-prints
- Springel (2005) Springel V., 2005, MNRAS, 364, 1105
- Springel et al. (2005) Springel V., White S. D. M., Jenkins A., Frenk C. S., Yoshida N., Gao L., Navarro J., Thacker R., Croton D., Helly J., Peacock J. A., Cole S., Thomas P., Couchman H., Evrard A., Colberg J., Pearce F., 2005, Nature, 435, 629
- Springel et al. (2001) Springel V., White S. D. M., Tormen G., Kauffmann G., 2001, MNRAS, 328, 726
- Springel et al. (2001) Springel V., Yoshida N., White S. D. M., 2001, New Astron., 6, 79
- Tormen et al. (1997) Tormen G., Bouchet F., White S., 1997, MNRAS, 286, 865
- Viola et al. (2008) Viola M., Monaco P., Borgani S., Murante G., Tornatore L., 2008, MNRAS, 383, 777
- White et al. (2001) White M., Hernquist L., Springel V., 2001, ApJ, 550, L129
- White & Frenk (1991) White S. D. M., Frenk C. S., 1991, ApJ, 379, 52
- Yoshida et al. (2001) Yoshida N., Sheth R. K., Diaferio A., 2001, MNRAS, 328, 669
- Yoshida et al. (2002) Yoshida N., Stoehr F., Springel V., White S. D. M., 2002, MNRAS, 335, 762