Atomic displacements in the “charge-ice” pyrochlore Bi2Ti2O6O′ studied by neutron total scattering
Abstract
The oxide pyrochlore Bi2Ti2O6O′ is known to be associated with large displacements of Bi and O′ atoms from their ideal crystallographic positions. Neutron total scattering, analyzed in both reciprocal and real space, is employed here to understand the nature of these displacements. Rietveld analysis and maximum entropy methods are used to produce an average picture of the structural non-ideality. Local structure is modeled via large-box reverse Monte Carlo simulations constrained simultaneously by the Bragg profile and real-space pair distribution function. Direct visualization and statistical analyses of these models show the precise nature of the static Bi and O′ displacements. Correlations between neighboring Bi displacements are analyzed using coordinates from the large-box simulations. The framework of continuous symmetry measures has been applied to distributions of O′Bi4 tetrahedra to examine deviations from ideality. Bi displacements from ideal positions appear correlated over local length scales. The results are consistent with the idea that these nonmagnetic lone-pair containing pyrochlore compounds can be regarded as highly structurally frustrated systems.
pacs:
61.05.fm, 61.43.Bn, 75.10.JmI Introduction
Magnetic oxides with the O7 pyrochlore structure have been the subject of intense study. The lattice of corner-connected tetrahedra of atoms hinders cooperative magnetic ordering, and when the atom spins are Ising, an ice-like ground state is produced, for example in Dy2Ti2O7 and Ho2Ti2O7.Ramirez (1994); Ramirez et al. (1999); Morris et al. (2009); Kadowaki et al. (2009) Other recent developments in oxide pyrochlores include superconductivity in osmium compounds,Yonezawa et al. (2004) the formation of polar metallic states with unusual phonon modes,Kendziora et al. (2005), and the suggestion of chiral magnetic ground states.Onoda and Nagaosa (2003) The analogy between Ising spins and vector displacements of cations within their coordination polyhedra has led to the suggestion that polar ordering may be similarly frustrated on the pyrochlore lattice.Seshadri (2006) Thus in pyrochlore Bi2Ti2O6O′, it is known that the Bi3+ atoms, usually predisposed to off-centering within their coordination polyhedra, display incoherent displacements permitting the average structure to remain cubic.Hector and Wiggin (2004) This is in sharp contrast to the Bi3+-containing perovskites BiMnO3 and BiFeO3 where the lone-pair active A-site produces polar, non-cubic ground states.Hill (2002) Some signatures of these incoherent displacements are seen in measurements of heat capacity of Bi2Ti2O6O′ and related compounds at low temperatures.Melot et al. (2009)
Significant advances in describing frustrated, ice-like behavior in magnetic pyrochlores have been made when atomistic models are utilized to describe the interactions between individual sites. For example, atomistic simulation of magnetic spin ordering in Dy2Ti2O7 leads to a picture of localized, uncompensated spins connected by strings of ordered spins.Kadowaki et al. (2009); Morris et al. (2009) This picture is local: spin behavior is driven by connectivity, geometry, and pairwise exchange interactions. However, it also agrees with bulk thermodynamic measurements: the heat capacity of the ensemble average agrees with experimental observations. We show here that experimental modeling over multiple length scales, both atomistic and averaged, affords a view of the pyrochlore Bi2Ti2O6O′ where Bi displacements, rather than spins, form a frustrated network on the sublattice.
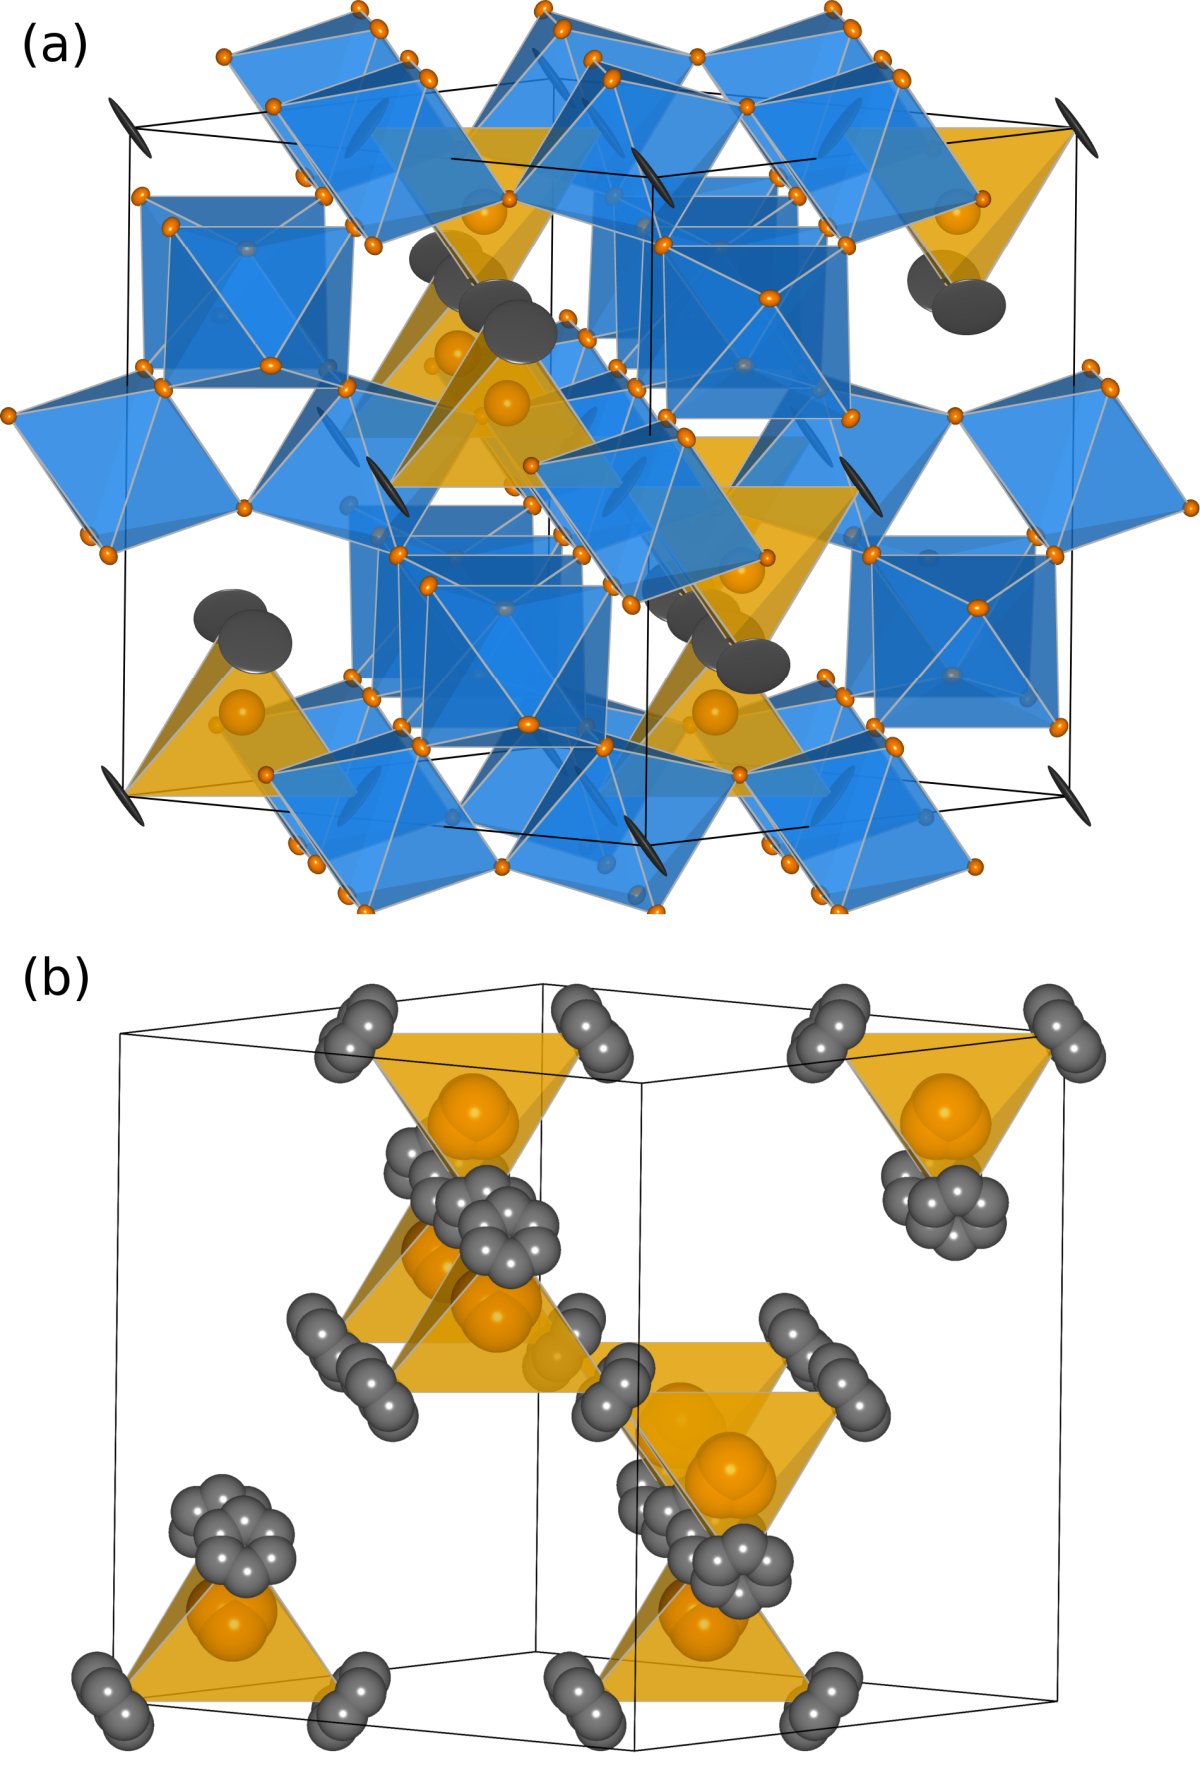
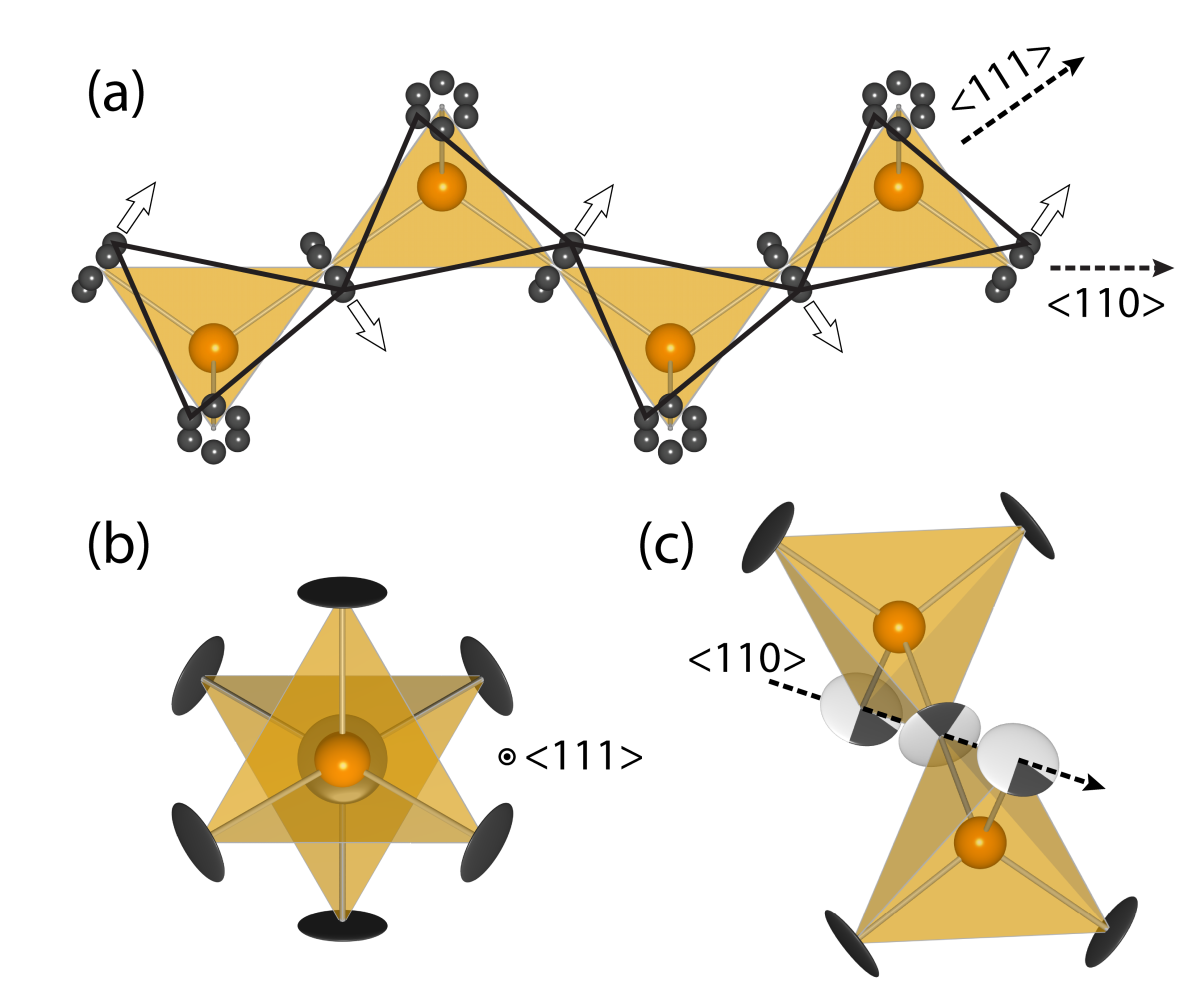
Bi2Ti2O6O′ [structure in Fig. 1(a)] is written thus to emphasize the two sublattices: one of corner-sharing TiO6 octahedra, and the other of corner-sharing O′Bi4 tetrahedra. While the TiO6 sublattice is rigid in models of the average structure, Bi atoms are suggested to displace 0.4 Å normal to the linear O′–Bi–O′ bond in an uncorrelated manner.Hector and Wiggin (2004); Seshadri (2006) First-principles calculations on Bi2Ti2O6O′ predict Bi displacements but these are perforce associated with non-cubic symmetries.Fennie et al. (2007) Diffuse intensity in electron diffraction patterns of related compounds including Bi2Ru2O7, Bi2InNbO7, and Bi2ScNbO7 may indicate short-range correlations in the Bi displacements.Withers et al. (2004); Goodwin et al. (2007); Liu et al. (2009) If Bi displacements cooperatively order with each other, they must do so only over short ranges. Crystallographic analysis based on Bragg scattering leaves a void in the ability to probe such short-range order, as analyses are predicated on the existence of long-range order. Consequently, studies of displacive disorder on the site via Rietveld refinement or Fourier maps can produce a model of the average electron or nuclear distributions, but each site has an identical cloud of intensity.Tabira et al. (2001)
We investigate models where the correlated motion of atoms on the sites reproduces the atomistic, pairwise distances between individual atoms. This description is provided by an appropriate Fourier transform of the total scattering function to provide a normalized pair distribution function (PDF).Egami and Billinge (2003); Proffen (2000) In this study, the PDF and the Bragg profile are used as experimental constraints in a large-box (11,000 atom) model of Bi2Ti2O6O′ to obtain, using reverse Monte-Carlo (RMC) analysis, a consistent picture of the the coordination tendencies of all atoms. Many of these models are combined and used as a set of atomic positions for further analysis. RMC compares the experimental and computed (based on atom positions in the simulation box) and while randomly relaxing atomic positions. The method is similar to Metropolis Monte Carlo, except that the fit to data , instead of a potential energy function, is minimized.McGreevy and Pusztai (1988); McGreevy (2001); Tucker et al. (2001a)
There are many approaches to describing the behavior and correlations of atomic positions as obtained from large-box models of structure. Some examples include the use of quadrupolar moments of octahedra to describe LaMnO3,Sartbaeva et al. (2007) of contour plots of bond angles in cristobalite,Tucker et al. (2001b) and the use of bond valence analysis to obtain valence states from a statistical analysis of metal-oxygen positions.Adams and Swenson (2005); Shoemaker et al. (2009) Here we analyze the local geometry using simple metrics, then present the continuous symmetry measures (CSM)Zabrodsky et al. (1992); Pinsky and Avnir (1998); Keinan and Avnir (2001) of polyhedra from RMC simulations. The CSM model provides a quantitative measure of a polyhedron’s distortion, in the form of a “distance” from ideality. A key advantage of CSM is its ability to compare shapes in different compounds.Keinan and Avnir (2001) The CSM has been used to correlate deviations from ideal tetrahedra in silicates as a function of applied pressure,Yogev-Einot and Avnir (2004) and to analyze second-order Jahn-Teller systems across a variety of crystal structures.Ok et al. (2006) In these cases, the CSM was considered for the average crystallographic stucture, e.g. one where polyhedra possess a single CSM value. Here, we extend CSM to large-box modeling by calculating it for every O′Bi4 tetrahedron in the RMC supercell, obtaining distributions, rather than single values.
The key finding to emerge from this study is that displacements from ideal atomic positions in Bi2Ti2O6O′ and in particular, the nature of the O′Bi4 tetrahedra indicate a tendency for Bi to lie in a disordered ring around the ideal position, with some preference for near-neighbor Bi-Bi ordering. This reaffirms the case that, even when probed microscopically, Bi2Ti2O6O′ is ice-like in its disorder. We emphasize that in drawing the analogy with ice, we do not suggest the existence of ice-rules of the Bernal-FowlerBernal and Fowler (1933) type in these systems.
II Methods
Synthesis and a detailed average structural analysis of the sample used in this study (including verification of purity) has been reported by Hector and Wiggin.Hector and Wiggin (2004) Briefly, a basic solution of titanium metal with hydrogen peroxide and ammonia was added to an acidic solution of bismuth nitrate pentahydrate and nitric acid. The resulting precipitate was filtered, washed with a dilute ammonia solution, dried at 50∘C, and calcined in air for 16 h at 470∘C. Time-of-flight (TOF) neutron powder diffraction on samples held in vanadium cans was collected at the NPDF instrument at Los Alamos National Laboratory at 298 K and 14 K. NPDF is designed to collect high-resolution, high-momentum-transfer data suitable for production of the PDF, as well as traditional Rietveld refinement. We performed Rietveld refinement using GSAS.Larson and Von Dreele (2000). Extraction of the PDF with PDFGetNPeterson et al. (2000) used = 35 Å-1, and least-squares refinements of the PDF were performed with PDFgui.Farrow et al. (2007)
First-principles density functional methods were used to identify a possible ordered ground state. The local stability of Bi2Ti2O7 was investigated using projector augmented wave potentials within the local density approximation as implemented in the vasp programKresse and Hafner (1993); Kresse and Furthmüller (1996); Blöchl (1994); Kresse and Joubert (1999) and described previously.Fennie et al. (2007) We found three zone-center lattice instabilities–one ferroelectric and two antiferroelectric-like modes–which were used to guide a systematic search for low-symmetry phases. We performed a series of structural relaxations within each of the highest-symmetry isotropy subgroupsbil ; H. T. Stokes and Campbell (2007) consistent with the freezing-in of one or more of these lattice instabilities. We found that the lowest energy structure is ferroelectric (with a substantial polarization of 20 C cm-2), in the polar monoclinic space group , consistent with the freezing-in of all three modes.
Maximum entropy method (MEM) calculations of the nuclear scattering density were performed using PRIMA.Izumi and Dilanian (2002) RMC simulations were performed using RMCProfileTucker et al. (2007) version 6 on a supercell (cubic, Å per side) with 11000 atoms. These simulations were constrained by the PDF (in the form of )Keen (2001) up to = 12 Å and by the Bragg profile of NPDF bank 1, which contains the lowest- Bragg reflections. Crystal structures are visualized using VESTAMomma and Izumi (2008) and AtomEye. Li (2003) Quantitative analyses shown in this work are taken from averaging many simulations in order to obtain an unbiased interpretation of the fit to data. Hard-sphere cutoffs were employed in RMC simulations to ensure that atoms did not approach closer than the specified nearest-neighbor distances, but no bunching was observed at these cutoffs. CSM for O′Bi4 tetrahedra were calculated using a distance measure program provided by M. Pinsky and D. Avnir.
III Results and Discussion
III.1 Average structure from Rietveld refinement
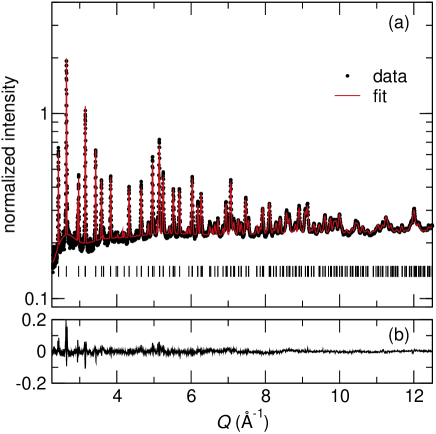
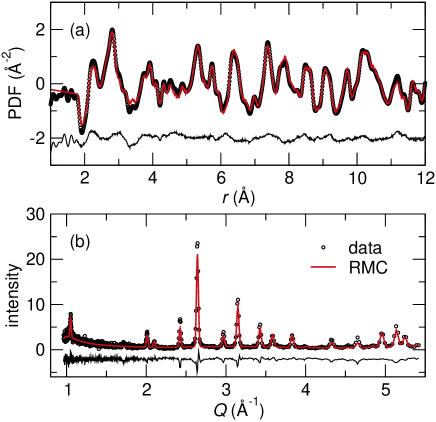
The profile resulting from TOF neutron Rietveld refinement is displayed (for a single bank of data) in Fig. 2. The goodness of fit parameter = 2.9%. The sample is the same as used in the Rietveld study of Hector and Wiggin,Hector and Wiggin (2004) and the fit converges to similar structural parameters (within error), so these will not be reproduced here.
In Bi2Ti2O6O′, preliminary Rietveld refinement using an ideal pyrochlore model can obtain a good fit to data, but large atomic displacement parameters (ADPs) indicate that significant atomic disorder is present, characterized by an elliptical spread around the ideal atomic positions. The ideal Bi position on the (0,0,0) site can be fit using a large component. These appear as large, flat discs in Fig. 1(a) with a radius of about 0.4 Å. The discs envelop the Bi displacive disorder which we seek to accurately describe. The O′ atoms at the () position have large, isotropic displacements as well, corresponding to Å2. The TiO6 sublattice, on the other hand, is described by small values and does not display any signs of displacive disorder. Here we investigate the precise nature of atomic displacements in the O′Bi4 sublattice.
Improved refinement of the average pyrochlore structure has been achieved by using a split-atom model for the sites, such as in studies of Bi2Ti2O6O′,Radosavljevic et al. (1998); Hector and Wiggin (2004) Bi2Sn2O7,Evans et al. (2003) or La2Zr2O7.Tabira et al. (2001) Hector and Wiggin modeled Bi using a six-fold ring in the position,Hector and Wiggin (2004) but acknowledged that their refinement does not clearly show a preference for versus (rotated 30∘ to each other). The split-atom configuration is shown in Fig. 1(b). Comparison to an ideal-position model in Fig. 1(a) shows that the Bi split-atom sites lie inside the anisotropic discs. Most O′ intensity is still centered on the site, but some occupancy is shifted away in 4 directions to form a tetrapod, modeled by partial occupancy of the sites. From Rietveld refinement, we find that the Bi displacement parameters at 14 K and 300 K are similar in orientation and magnitude. This suggests that Bi displacements are frozen at room (and higher) temperatures, and what is being monitored in the scattering is not a snapshot of dynamic motion, but rather a description of static positions. The suggestion of frozen displacements at room temperature is consistent with measurements of the temperature- and field-dependence of the dielectric constant in Bi2Ti2O6O′ thin films.Cagnon et al. (2007)
Kinks in the difference profiles of the Rietveld refinement in Fig. 2(b) can be attributed to shoulders of diffuse intensity around low- peaks. The diffuse scattering cannot be interpreted here because the Rietveld technique only models Bragg intensity. Crucial approximations are made to model a structure using only Bragg peaks: we must average any atomic correlations or distortions that do not possess long-range ordering. The Bi distortions are incoherent, and their description will require an examination of diffuse scattering. Total scattering analysis of the real-space PDF, discussed here subsequently, provides a real-space tool to model both Bragg and diffuse scattering simultaneously.
III.2 Maximum entropy method
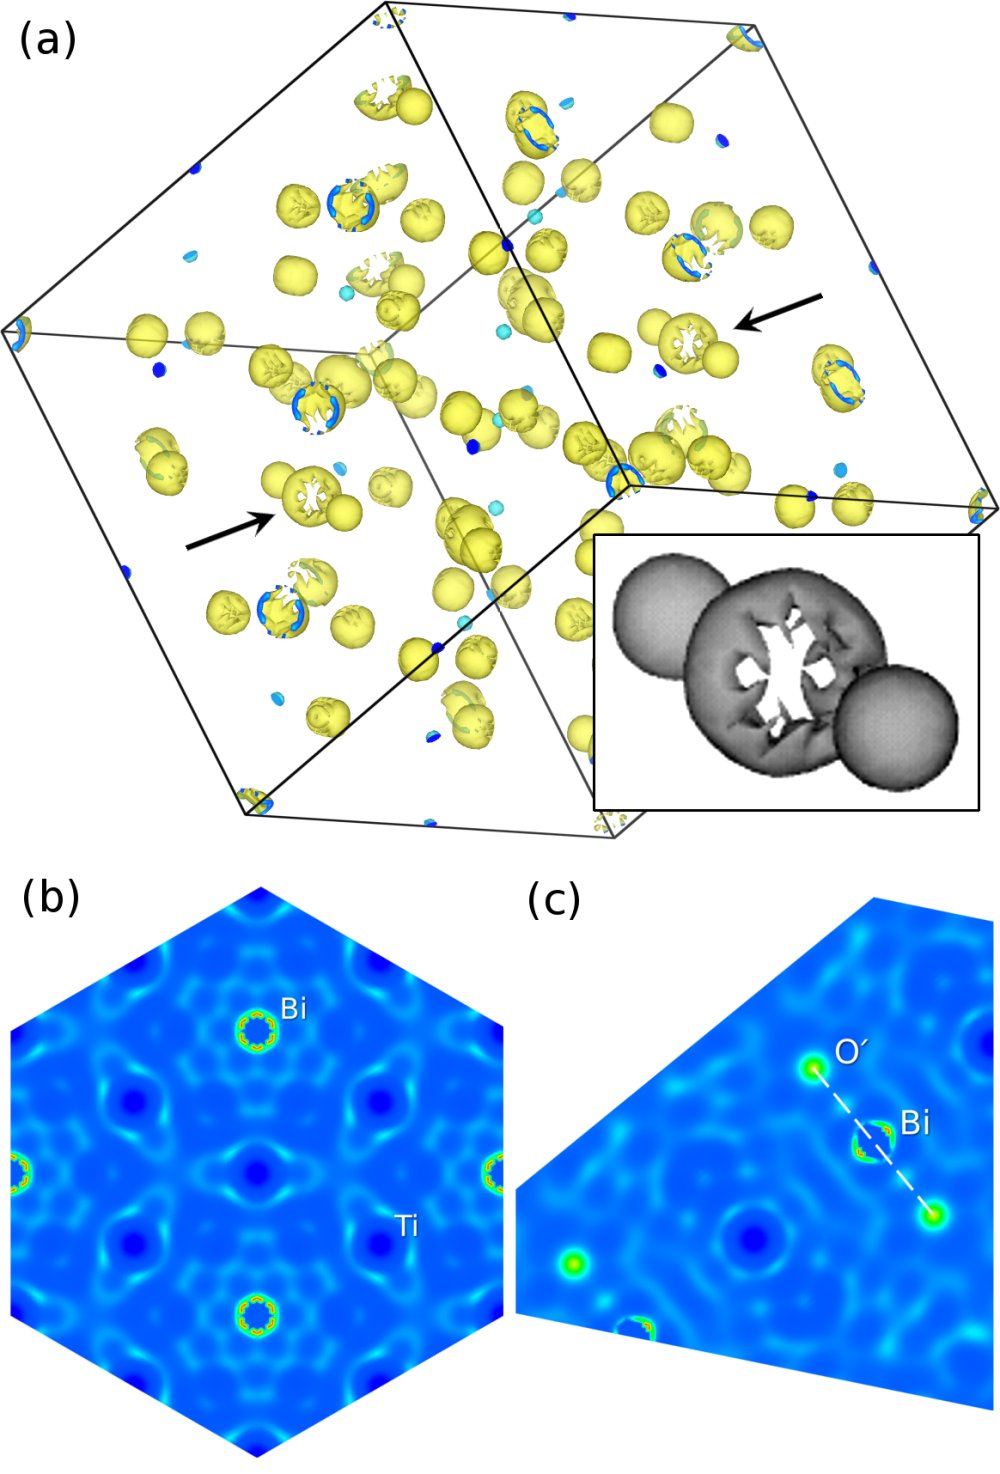
The maximum entropy method (MEM) is used here to produce a map of neutron scattering density in the unit cell. The method, proposed originally by Jaynes,Jaynes (1957a, b) uses some testable information (in this case, observed Bragg peak intensities in TOF neutron diffraction), and is based on the most probable distribution (nuclear scattering density) being the one with the largest information entropy. This method is described by SakataSakata and Sato (1990); Sakata et al. (1990) and in the context of the MEM software program MEED,Kumazawa et al. (1993) a precursor to the software code PRIMA used here. The MEM input consists of the observed Bragg structure factor (from a Le Bail fit, with phase information from the ideal structure) for a list of reflections, the unit cell dimensions, space group, and the sum of all scattering lengths in the cell. The MEM as employed here is largely model-free in the sense that atomic positions are not specified during the calculation, but phase information for is biased by the ideal structure. The final result is required to obey the symmetry of the space group. This is also an average structure probe–diffuse scattering intensity is ignored. Thus all Bi atomic positions in Bi2Ti2O6O′, for example, will be equivalent to each other as required by .
Despite these constrains, the MEM affords an excellent view of average Bi displacements. No prior description of Bi displacements, or even a knowledge of their existence, is used to produce them in the isosurface neutron density unit cell displayed in Fig. 3(a). Arrows point to the circular Bi density that forms a ring around the O′–Bi–O′ bond. Two-dimensional slices of the cell viewed along and normal to the O′–Bi–O′ bond in Figs. 3(b) and 3(c), respectively, show additional detail of the Bi nuclear density. The Bi ring appears hexagonal in Fig. 3(b), which is the required symmetry of the position in . The strongest intensity of Bi points toward the in-plane Ti in Fig. 3(b). This corresponds to a site for Bi, not .Avdeev et al. (2002) While the Bi shapes found by MEM agree with those from Rietveld refinements, there is no evidence of a tetrapod-shaped spread in the O′ density in MEM. This shape would be allowed by symmetry.
III.3 Least-squares PDF refinement
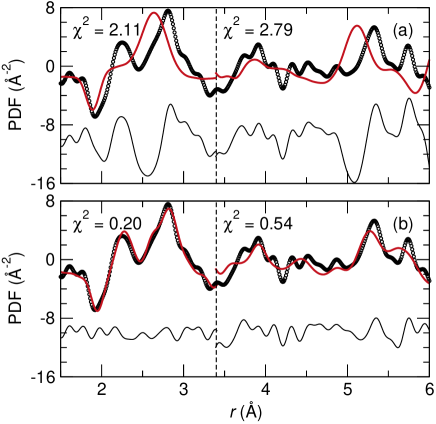
When displacements of atomic positions and their correlations have been proposed in the pyrochlore structure, it has been compared to the SiO4 tetrahedral network of -cristobalite, which is isostructural to the O′Bi4 sublattice.Tabira et al. (1999); Nguyen et al. (2007); Goodwin et al. (2007) This configuration would have long-range zig-zag ordering of Bi displacements shown in Fig. 5. These distortions may be ordered along any of the three Bi–Bi directions in the lattice, and the distortions in one direction need not be correlated with those in another.Withers et al. (1989); Tucker et al. (2001b) We use least-squares PDF refinement (a small-box technique) to compare the observed local structure to two models: the Rietveld-derived average model with large ADPs, and the ordered structure from first-principles calculations.
The average model fit to the experimental PDF is shown in Fig. 4(a). The large, disc-shaped ADPs on the Bi positions cause the peak at 2.2 Å to flatten and disappear, and the fit does not significantly improve as increases. The short-range fit up to Å and the medium-range fit from Å both give high values. The polar, ordered model fit in Fig. 4(b) describes the low- region very well. Here, a single Bi–O′ distance is well-defined, so the peak at 2.2 Å appears. The medium-range fit is poorer than the short-range fit, but still much better than the average model. From the Rietveld, MEM, and least-squares PDF analyses we know that the structure of Bi2Ti2O6O′ shares some attributes of the average structure (lattice parameters, averaged positions) and the local model (bond distances and angles at low ). Analysis by least-squares refinement of the PDF is limited because we must construct a model that resembles both and . Due to the complex disorder present in Bi2Ti2O6O′, we conduct reverse Monte Carlo simulations, where large-box models are generated by fits to the data (starting from the ideal structure), and extract statistical measures of these models.
III.4 Reverse Monte Carlo simulations
RMC simulations utilize large-box modeling with periodic boundary conditions and are not constrained by symmetry.Proffen and Welberry (1997); Tucker et al. (2001a, 2007) This provides two principal advantages when simulating crystalline materials: the ability to model nuclear positions with arbitrary shapes, and the ability to investigate correlations between atoms on the Å length-scale. We profit from both when modeling Bi2Ti2O6O′. First, the true shapes of Bi and O′ displacements must be elucidated. Second, Bi–Bi nearest-neighbor correlations may lead to cooperative distortions of the O′Bi4 sublattice. This type of short-range order would be a signature of local regions where the lone-pair-active Bi displacements effect polar domains.
III.4.1 Average atomic displacements
The real-space local structure (coordination environments, short-range correlations, etc.) of the RMC supercell are driven by the fit to the PDF, while the Bragg fit constrains the long-range periodicity of the structure (or lack thereof) and ensures reliable displacement parameters. In the case of Bi2Ti2O6O′, we monitor the agreement of Rietveld and RMC ADPs (calculated as the mean-square displacement from ideal positions). RMC simulations were started with the ideal pyrochlore lattice with all Bi atoms on positions. As the simulation progresses, Bi atoms are always observed to move off the central position to form a ring that resembles the Rietveld split-atom model. The fits to the 14 K PDF and Bragg profile are shown in Fig. 6(a,b).
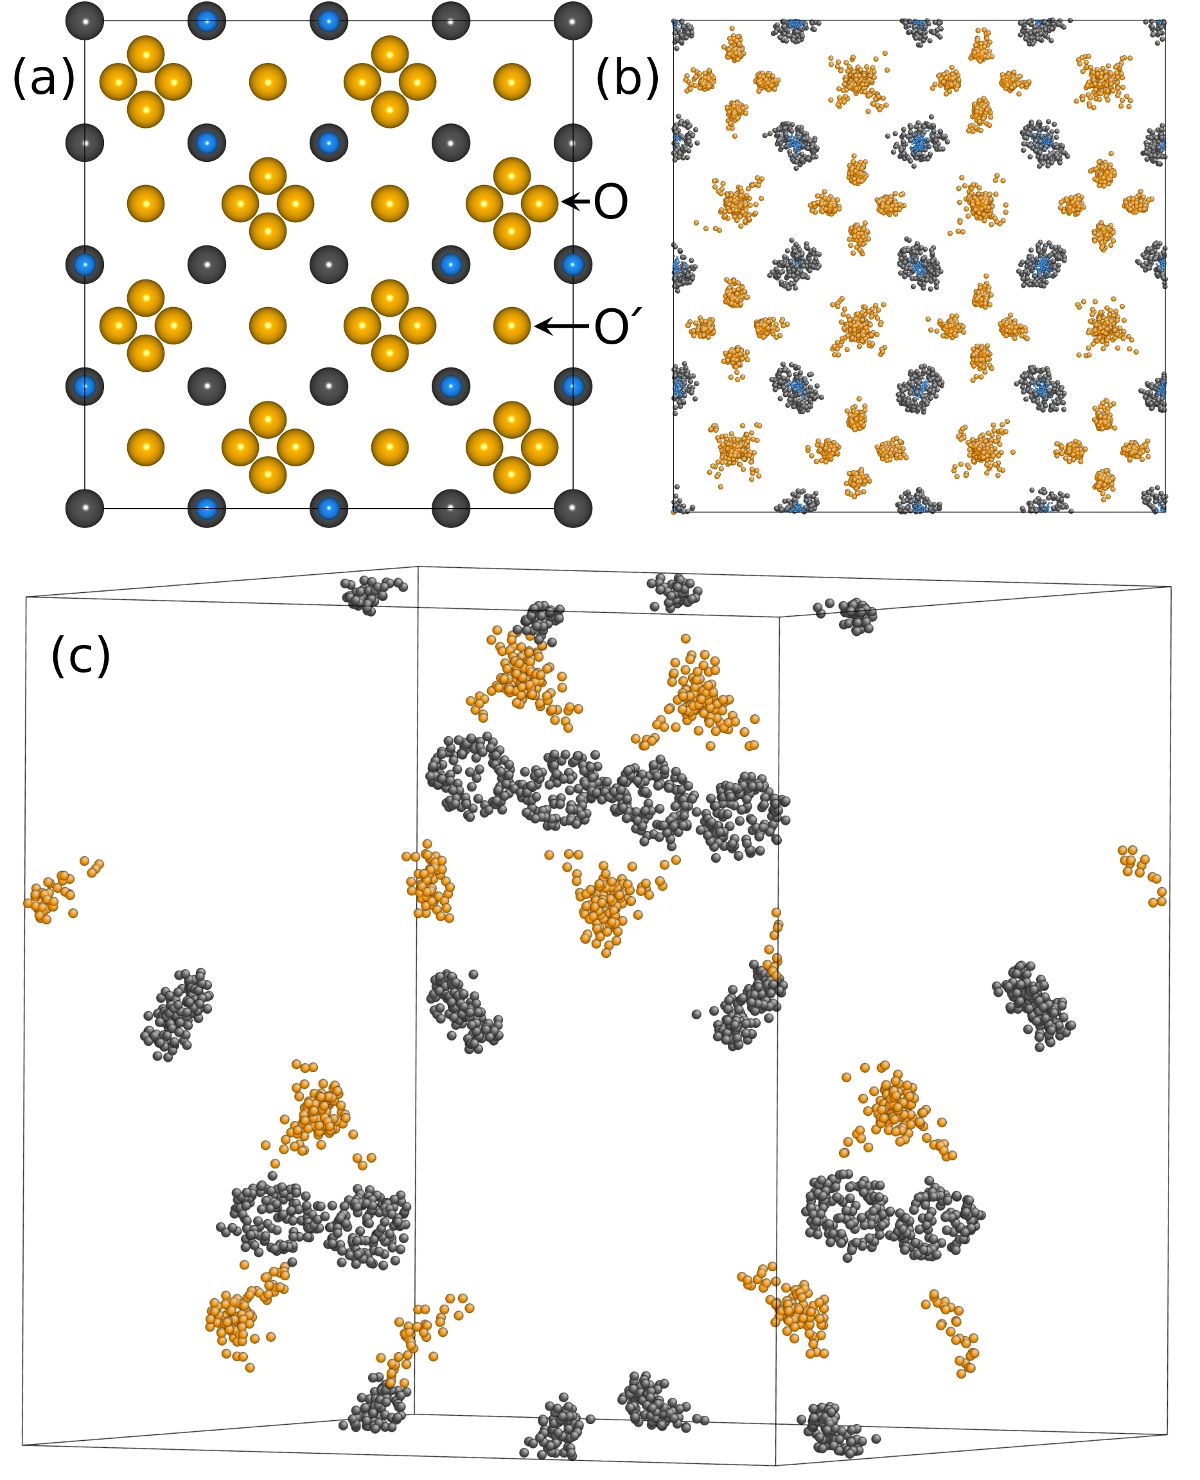
A comparison of the ideal unit cell with a folded RMC supercell is shown in Fig. 7. In Fig. 7(b) we fold the 125 unit cells of a supercell into a single unit cell. The result is a cell with “point clouds” on each atomic position that represent a map of the nuclear scattering density on each site in Bi2Ti2O6O′. Of particular note is the large spread of Bi and O′ point clouds in Fig. 7(b) in comparison to those of Ti and O. These distributions agree quantitatively with the ADPs from Rietveld refinement.
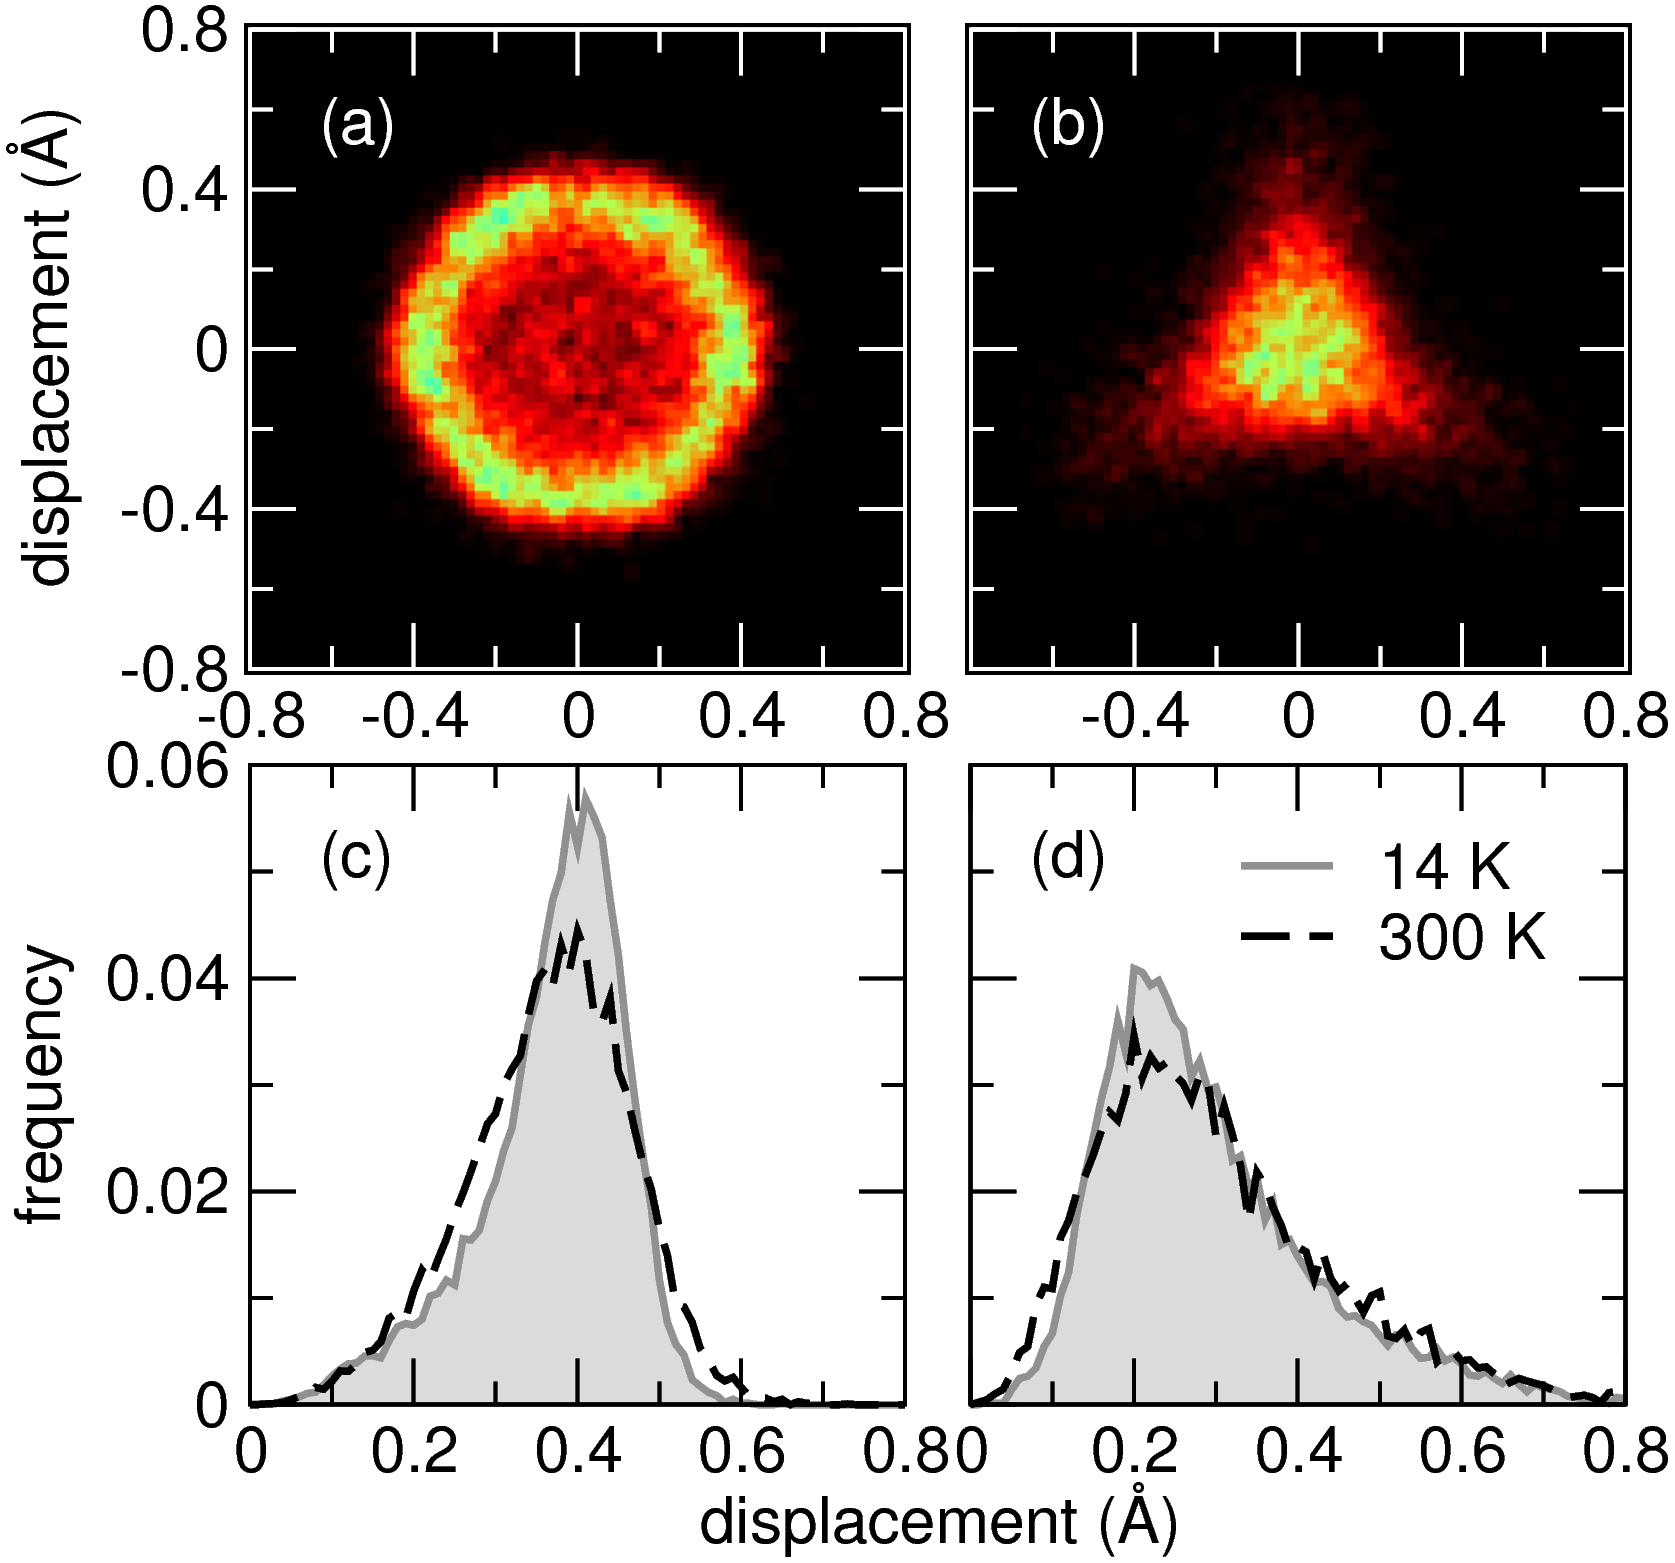
The O′Bi4 sublattice from a 14 K RMC simulation is shown in Fig. 7(c), viewed close to the direction. From this viewpoint, Bi rings are evident. These rings open normal to the O′–Bi–O′ bonds, as expected from Rietveld ADPs and MEM. The average shape of a Bi ring is seen in Fig. 8(a). Viewed along the O′–Bi–O′ direction, it appears circular with a radius of about 0.4 Å. A histogram of Bi distances from the ideal site is given in Fig. 8(c), with a clear maximum at the ring radius. The same procedure applied to O′ yields a tetrapodal object. Seen in Fig. 8(b), the arms of this tetrapod point away from the four neighboring Bi atoms. One arm of the tetrapod is in the center of the plot, pointing normal to the page. A key distinction between O′ and Bi is that the dense cluster of O′ positions is still centered on the ideal position, seen as a bright cluster in the center of Fig. 8(b). In contrast, Bi intensity is low at the center and most intensity lies on the ring perimeter. The displacement histograms in Figs. 8(c,d) reveal similar shapes in RMC simulations of 14 K and 300 K data, with a slight broadening at high temperature. This supports the idea that these displacements are frozen at high temperatures and do not fundamentally change with cooling.
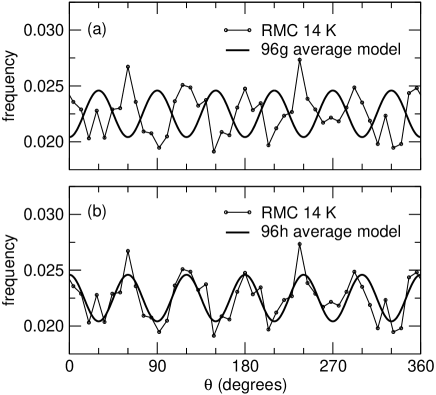
The RMC model corroborates with Rietveld and MEM while providing further evidence for a tendency toward a sixfold Bi ring. In Fig. 9(a), a histogram of the the rotation angle of Bi around the axis is fit to a sixfold cosine curve. This curve, with a minimum at , corresponds to the sites and does not fit the data. Instead, Fig. 9(b) shows excellent agreement between the RMC result and the six-fold curve, which is shifted by 30∘ from . Note however that the intensity at minima in the curves is not zero; there is still some tendency for Bi to lie at any . It is not known whether increased preference for the site would push the minima to be nearly zero. It is therefore possible that stronger ordering exists, but is obscured by the resolution of the data.
III.4.2 Correlated distortions: double-tetrahedral model
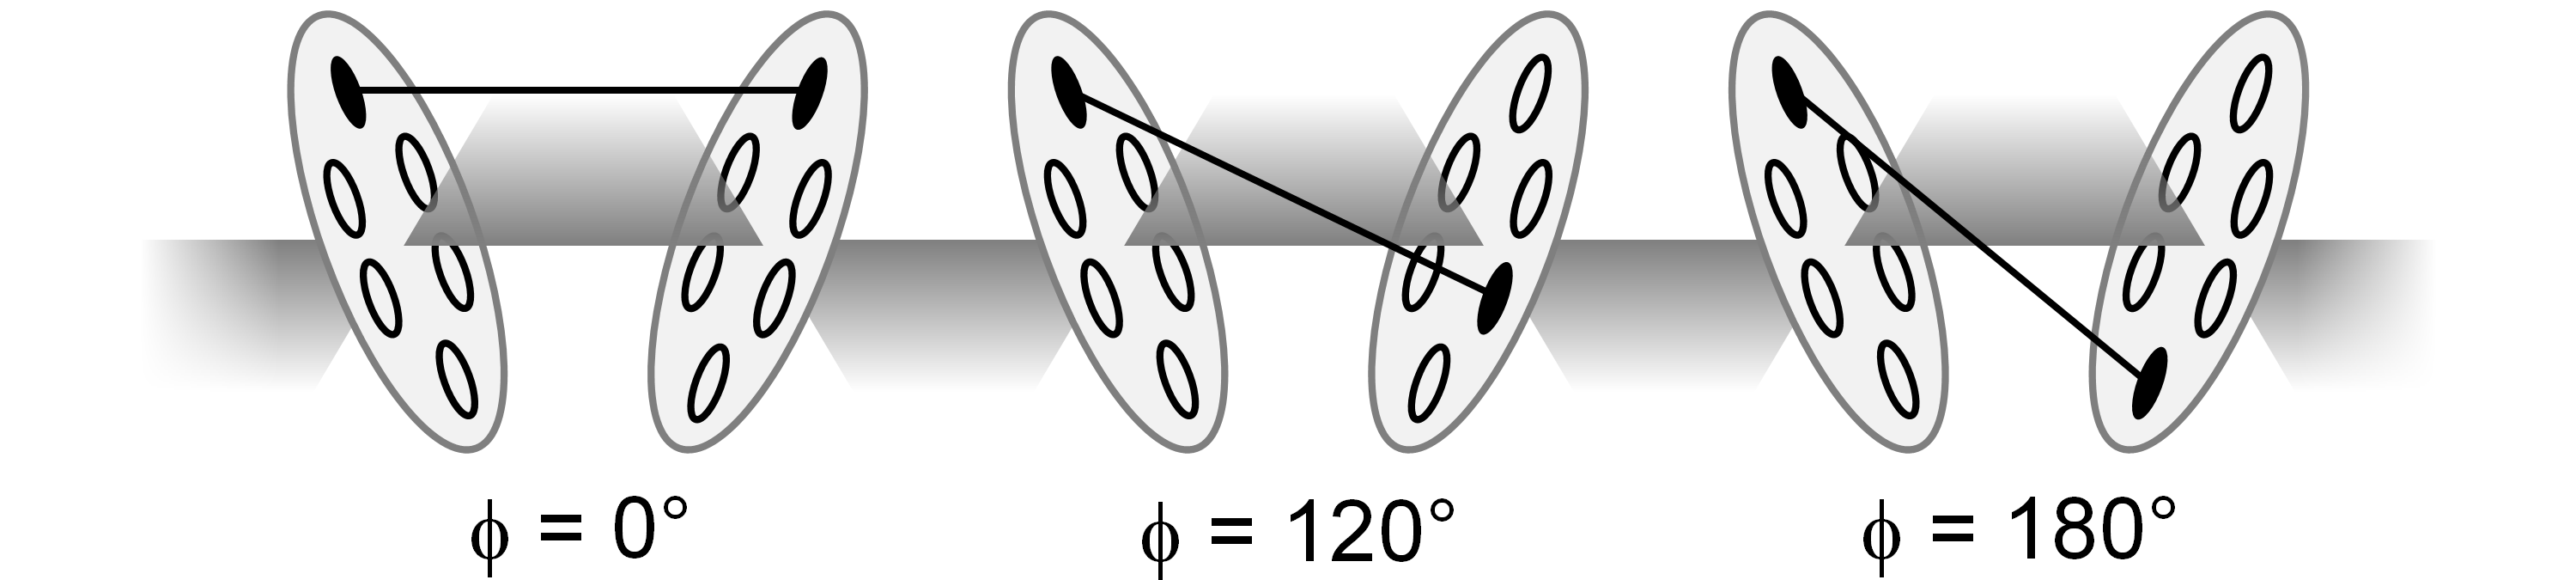
Cooperative -cristobalite correlations can be visualized in the polyhedral configuration given in Fig. 5. The motif of two corner-linked O′Bi4 tetrahedra is the basis of our analysis. The zig-zag pattern is comprised of Bi that are all in the same plane (denoted with arrows). This plane is defined by the displacement of any Bi atom in the chain, so the central Bi atom can only participate in zig-zag ordering in one direction at a time. The two inline nearest neighbors of the central atom should have a tendency to displace opposite from the central Bi displacement vector. We can therefore quantify the correlation by examining the angle between the displacement vector of the central Bi versus the displacement vectors of the two relevant nearest neighbors. Each double-tetrahedral shape in the supercell is examined in this manner. A schematic showing selected orientations of neighboring Bi displacements and their corresponding values of is given in Fig. 10.
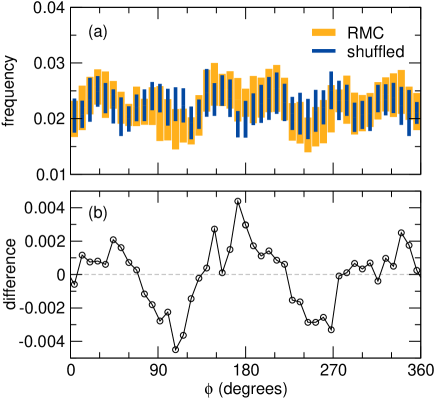
In Fig. 11(a), the relative angle histogram is plotted for the RMC simulations. It does not have the same six-fold modulation as the averaged Bi angles in Fig. 9(b) because is defined relative to its neighbors, while is defined relative to the crystal axes. We investigate the tendency for ordering by shuffling Bi displacements: the set of all individual Bi displacements from their ideal sites is preserved, but redistributed randomly among the Bi atoms. As a result, their orientations with respect to each other are disrupted. Note that, as a result of the removal of this local correlation, the shuffled curve is simply a six-fold cosine curve with modulation analogous to in Fig. 9(b). The difference between the RMC and shuffled , plotted in Fig. 11(b), shows a peak at , indicating a preference for zig-zag ordering. Correlations where are not preferred. While these results point to anti-alignment of Bi displacements, Bi2Ti2O6O′ should not be considered to follow the -cristobalite model strictly, since Bi would need to prefer the site rather than .
III.4.3 Correlated distortions: continuous symmetry measures
The CSM provides a quantitative measure of a polyhedron’s distortion, in the form of a “distance” from ideality.Zabrodsky et al. (1992); Pinsky and Avnir (1998); Keinan and Avnir (2001) In our case, a perfect tetrahedron would have tetrahedricity = 0, while distortions from ideality increase this value toward 1. As a point of reference, the Jahn-Teller distorted CuO4 tetrahedron in CuMn2O4Shoemaker et al. (2009) has while a square plane has .
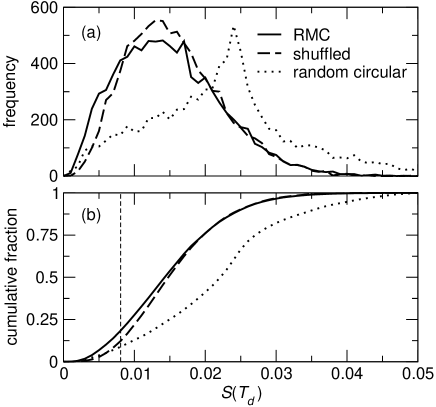
Application of CSM to the O′Bi4 sublattice is useful because describes the correlations between four neighboring Bi atoms. Comparison between models and RMC simulations are shown in Fig. 12. For a model with ordered -cristobalite-type ordering with a similar displacement magnitude, . This is plotted as a vertical line in Fig. 12(b). In contrast, uncorrelated and evenly circular (with radius 0.4 Å) Bi displacements produce a wide distribution of , shown as a dotted line in Fig. 12(a), and again as a cumulative fraction in Fig. 12(b).
In a case where zig-zag (or otherwise correlated) distortions are present on most O′Bi4 tetrahedra in the supercell, we expect Bi displacements to be correlated with their nearest neighbors, and a polyhedral rigidity reminiscent of SiO4 tetrahedra might exist. If these displacements from ideal positions were randomly swapped among Bi atoms, the ordering would be destroyed and would increase toward the random circular model. In a case where there is no short-range Bi–Bi ordering, randomly swapping the displacements should have no effect on the distribution.
In Fig. 12 we compare the distributions for the RMC supercell and the same supercell with Bi displacements randomly swapped. The distributions are shown as histograms of in (a) and cumulative fractions in (b). The random swapping slightly increases for the RMC supercell, seen as a shift to the right in Fig. 12(b). This curve is still quite separated from the random circular model.
Two aspects of the Bi distribution can be gleaned from this comparison. First, the Bi displacements of the RMC supercell are more strongly tetrahedral than the random circular model. This could be due to rigidity of the O′Bi4 tetrahedra, or the fact that the RMC has a distribution of Bi displacements [Fig. 8(c)] whereas the circular model has strictly Å. The separation between RMC and shuffled CSM points to rigidity that may be explained by correlated Bi displacements. Just as shuffling Bi displacements disrupts the ordering between pairs of Bi as viewed by in Fig. 11(b), it also disrupts ordering between sets of four Bi displacements as viewed by CSM in Fig. 12(b).
IV Conclusions
We have shown that a structural investigation of the strongly disordered pyrochlore Bi2Ti2O6O′ benefits from modeling real- and reciprocal space structure simultaneously. The combination of Rietveld refinement, MEM, least-squares PDF refinement, and RMC simulations provide a description of the structure over many length scales. Of particular interest is the behavior of the displaced lone-pair active Bi3+ cation. Average structure models indicate a preference for static displacements. MEM and RMC show that Bi prefers the (pointing between nearby O from the TiO6 sublattice) rather than sites (pointing toward neighboring O). Statistical measures of these displacements are extracted from RMC supercells.
RMC simulations show that Bi displacements lie at all angles in a ring normal to the O′–Bi–O′ bond with radius Å, but there is a preference for corresponding to positions. O′ atoms are centered on the ideal site, but in a tetrapodal shape with arms pointing away from neighboring Bi. Comparing the RMC result with an identical supercell with shuffled Bi displacements reveals that neighboring Bi displacements show some correlation with each other, with a preference for alignment. This corresponds to a zig-zag type ordering that merits further investigation. Measures of the tetrahedricity of the O′Bi4 sublattice indicate that neighboring displacements are weakly correlated, thus the sublattice may exhibit some rigidity.
V Acknowledgments
We thank M. Pinsky and D. Avnir for providing the CSM script, and we thank K. L. Page, R. L. Withers, M. G. Tucker, and A. L. Goodwin for helpful discussions. This work was supported by the Institute for Multiscale Materials Studies and the National Science Foundation through a Career Award (DMR 0449354) to RS and MRSEC facilities (DMR 0520415). Neutron scattering was performed on NPDF at the Lujan Center at the Los Alamos Neutron Science Center, funded by the DOE Office of Basic Energy Sciences. Los Alamos National Laboratory is operated by Los Alamos National Security, LLC under DOE Contract DE-AC52-06NA25396.
References
- Ramirez (1994) A. P. Ramirez, Ann. Rev. Mater. Sci. 24, 453 (1994).
- Ramirez et al. (1999) A. P. Ramirez, A. Hayashi, R. J. Cava, R. Siddharthan, and B. S. Shastry, Nature 399, 333 (1999).
- Morris et al. (2009) D. J. P. Morris, D. A. Tennant, S. A. Grigera, B. Klemke, C. Castelnovo, R. Moessner, C. Czternasty, M. Meissner, K. C. Rule, J. Hoffmann, et al., Science 326, 411 (2009).
- Kadowaki et al. (2009) H. Kadowaki, N. Doi, Y. Aoki, Y. Tabata, T. J. Sato, J. W. Lynn, K. Matsuhira, and Z. Hiroi, J. Phys. Soc. Japan 78, 103706 (2009).
- Yonezawa et al. (2004) S. Yonezawa, Y. Muraoka, and Z. Hiroi, J. Phys. Soc. Japan 73, 1655 (2004).
- Kendziora et al. (2005) C. A. Kendziora, I. A. Sergienko, R. Jin, J. He, V. Keppens, B. C. Sales, and D. Mandrus, Phys. Rev. Lett. 95, 125503 (2005).
- Onoda and Nagaosa (2003) S. Onoda and N. Nagaosa, Phys. Rev. Lett. 90, 196602 (2003).
- Seshadri (2006) R. Seshadri, Solid State Sci. 8, 259 (2006).
- Hector and Wiggin (2004) A. L. Hector and S. B. Wiggin, J. Solid State Chem. 177, 139 (2004), ISSN 0022-4596.
- Hill (2002) N. A. Hill, Ann. Rev. Mater. Res. 32, 1 (2002).
- Melot et al. (2009) B. C. Melot, R. Tackett, J. O’Brien, A. L. Hector, G. Lawes, R. Seshadri, and A. P. Ramirez, Phys. Rev. B 79, 224111 (2009).
- Fennie et al. (2007) C. J. Fennie, R. Seshadri, and K. M. Rabe, 0712.1846 (2007), URL http://arxiv.org/abs/0712.1846.
- Withers et al. (2004) R. L. Withers, T. R. Welberry, A. K. Larsson, Y. Liu, L. Norén, H. Rundlöf, and F. J. Brink, J. Solid State Chem. 177, 231 (2004), ISSN 0022-4596.
- Goodwin et al. (2007) A. L. Goodwin, R. L. Withers, and H. Nguyen, J. Phys. Cond. Mat. 19, 335216 (2007).
- Liu et al. (2009) Y. Liu, R. L. Withers, H. B. Nguyen, K. Elliott, Q. Ren, and Z. Chen, J. Solid State Chem. 182, 2748 (2009).
- Tabira et al. (2001) Y. Tabira, R. L. Withers, T. Yamada, and N. Ishizawa, Z. Kristallogr. 216, 92 (2001).
- Egami and Billinge (2003) T. Egami and S. J. L. Billinge, Underneath the Bragg Peaks, Volume 7: Structural Analysis of Complex Materials (Pergamon, 2003), ISBN 0080426980.
- Proffen (2000) T. Proffen, cond-mat/0002388 (2000), URL http://arxiv.org/abs/cond-mat/0002388.
- McGreevy and Pusztai (1988) R. L. McGreevy and L. Pusztai, Mol. Simulat. 1, 359 (1988).
- McGreevy (2001) R. L. McGreevy, J. Phys. Cond. Matt. 13, R877 (2001).
- Tucker et al. (2001a) M. G. Tucker, M. T. Dove, and D. A. Keen, J. Appl. Cryst. 34, 630 (2001a).
- Sartbaeva et al. (2007) A. Sartbaeva, S. A. Wells, M. F. Thorpe, E. S. Bozin, and S. J. L. Billinge, Phys. Rev. Lett. 99, 155503 (2007).
- Tucker et al. (2001b) M. G. Tucker, M. P. Squires, M. T. Dove, and D. A. Keen, J. Phys. Cond. Mat. 13, 403 (2001b).
- Adams and Swenson (2005) S. Adams and J. Swenson, J. Phys. Cond. Matt. 17, S87 (2005).
- Shoemaker et al. (2009) D. P. Shoemaker, J. Li, and R. Seshadri, J. Am. Chem. Soc. 131, 11450 (2009).
- Zabrodsky et al. (1992) H. Zabrodsky, S. Peleg, and D. Avnir, J. Am. Chem. Soc. 114, 7843 (1992).
- Pinsky and Avnir (1998) M. Pinsky and D. Avnir, Inorg. Chem. 37, 5575 (1998).
- Keinan and Avnir (2001) S. Keinan and D. Avnir, J. Che. Soc., Dalton Trans. pp. 941–947 (2001).
- Yogev-Einot and Avnir (2004) D. Yogev-Einot and D. Avnir, Acta Cryst. B 60, 163 (2004), ISSN 0108-7681.
- Ok et al. (2006) K. M. Ok, P. S. Halasyamani, D. Casanova, M. Llunell, P. Alemany, and S. Alvarez, Chem. Mater. 18, 3176 (2006).
- Bernal and Fowler (1933) J. D. Bernal and R. H. Fowler, J. Chem. Phys. 1, 515 (1933).
- Larson and Von Dreele (2000) A. Larson and R. Von Dreele, Los Alamos National Laboratory Report LAUR 86, 748 (2000).
- Peterson et al. (2000) P. F. Peterson, M. Gutmann, T. Proffen, and S. J. L. Billinge, J. Appl. Cryst. 33, 1192 (2000).
- Farrow et al. (2007) C. L. Farrow, P. Juhas, J. W. Liu, D. Bryndin, E. S. Bozin, J. Bloch, T. Proffen, and S. J. L. Billinge, J. Phys. Cond. Mat. 19, 335219 (2007).
- Kresse and Hafner (1993) G. Kresse and J. Hafner, Phys. Rev. B 47, 558 (1993).
- Kresse and Furthmüller (1996) G. Kresse and J. Furthmüller, Phys. Rev. B 54, 11169 (1996).
- Blöchl (1994) P. Blöchl, Phys. Rev. B 50, 17953 (1994).
- Kresse and Joubert (1999) G. Kresse and D. Joubert, Phys. Rev. B 59, 1758 (1999).
- (39) Bilbao crystallographic server, http://www.cryst.ehu.es.
- H. T. Stokes and Campbell (2007) D. M. H. H. T. Stokes and B. J. Campbell, Isotropy (2007), http://stokes.byu.edu/isotropy.html.
- Izumi and Dilanian (2002) F. Izumi and A. Dilanian, Recent Research Developments in Physics, vol. 3 (Transworld Research Network, Trivandrum, India, 2002), ISBN 81-7895-046-4.
- Tucker et al. (2007) M. G. Tucker, D. A. Keen, M. T. Dove, A. L. Goodwin, and Q. Hui, J. Phys. Cond. Mat. 19, 335218 (2007).
- Keen (2001) D. A. Keen, J. Appl. Cryst. 34, 172 (2001).
- Momma and Izumi (2008) K. Momma and F. Izumi, J. Appl. Cryst. 41, 653 (2008).
- Li (2003) J. Li, Modelling and Simul. Mater. Sci. Eng. 11, 173 (2003).
- Radosavljevic et al. (1998) I. Radosavljevic, J. S. O. Evans, and A. W. Sleight, J. Solid State Chem. 136, 63 (1998).
- Evans et al. (2003) I. R. Evans, J. A. K. Howard, and J. S. O. Evans, J. Mater. Chem. 13, 2098 (2003).
- Cagnon et al. (2007) J. Cagnon, D. S. Boesch, N. H. Finstrom, S. Z. Nergiz, S. P. Keane, and S. Stemmer, J. Appl. Phys. 102, 044102 (2007).
- Jaynes (1957a) E. T. Jaynes, Phys. Rev. 106, 620 (1957a).
- Jaynes (1957b) E. T. Jaynes, Phys. Rev. 108, 171 (1957b).
- Sakata and Sato (1990) M. Sakata and M. Sato, Acta Cryst. A 46, 263 (1990).
- Sakata et al. (1990) M. Sakata, R. Mori, S. Kumazawza, M. Takata, and H. Toraya, J. Appl. Cryst. 23, 526 (1990).
- Kumazawa et al. (1993) S. Kumazawa, Y. Kubota, M. Takata, M. Sakata, and Y. Ishibashi, J. Appl. Cryst. 26, 453 (1993).
- Avdeev et al. (2002) M. Avdeev, M. K. Haas, J. D. Jorgensen, and R. J. Cava, J. Solid State Chem. 169, 24 (2002).
- Tabira et al. (1999) Y. Tabira, R. Withers, J. Thompson, and S. Schmid, J. Solid State Chem. 142, 393 (1999).
- Nguyen et al. (2007) B. Nguyen, Y. Liu, and R. L. Withers, J. Solid State Chem. 180, 549 (2007).
- Withers et al. (1989) R. Withers, J. Thompson, and T. Welberry, Phys. Chem. Miner. 16, 517 (1989).
- Proffen and Welberry (1997) T. Proffen and T. R. Welberry, Acta Cryst. A 53, 202 (1997).