The Great Observatories Origins Deep Survey
Abstract
Context. We present the full data set of the VIsible Multi-Object Spectrograph (VIMOS) spectroscopic campaign of the ESO/GOODS program in the Chandra Deep Field South (CDFS), which complements the FORS2 ESO/GOODS spectroscopic campaign.
Aims. The ESO/GOODS spectroscopic programs are aimed at reaching signal-to-noise ratios adequate to measure redshifts for galaxies with AB magnitudes in the range in the and band using VIMOS, and in the band using FORS2.
Methods. The GOODS/VIMOS spectroscopic campaign is structured in two separate surveys using two different VIMOS grisms. The VIMOS Low Resolution Blue (LR-Blue) and Medium Resolution (MR) orange grisms have been used to cover different redshift ranges. The LR-Blue campaign is aimed at observing galaxies mainly at , while the MR campaign mainly aims at galaxies at and Lyman Break Galaxies (LBGs) at .
Results. The full GOODS/VIMOS spectroscopic campaign consists of 20 VIMOS masks. This release adds 8 new masks to the previous release (12 masks, Popesso et al. 2009). In total we obtained 5052 spectra, 3634 from the 10 LR-Blue masks and 1418 from the 10 MR masks. A significant fraction of the extracted spectra comes from serendipitously observed sources: in the LR-Blue and in the MR masks. We obtained 2242 redshifts in the LR-Blue campaign and 976 in the MR campaign for a total success rate of and respectively, which increases to and if only primary targets are considered. The typical redshift uncertainty is estimated to be () for the LR-Blue grism and () for the MR grism. By complementing our VIMOS spectroscopic catalog with all existing spectroscopic redshifts publicly available in the CDFS, we compiled a redshift master catalog with 7332 entries, which we used to investigate large scale structures out to . We produced stacked spectra of LBGs in a few bins of equivalent width (EW) of the Ly- and found evidence for a lack of bright LBGs with high EW of the Ly-. Finally, we obtained new redshifts for 12 X-ray sources of the CDFS and extended-CDFS.
Conclusions. After the completion of the two complementary ESO/GOODS spectroscopic campaigns with VIMOS and FORS2 at VLT, the number of spectroscopic redshifts in CDFS/GOODS field increased dramatically, in particular at . These data provide the redshift information indispensable to achieve the scientific goals of GOODS, such as tracing the evolution of galaxy masses, morphologies, clustering, and star formation.
Key Words.:
Cosmology: observations – Cosmology: deep redshift survey – Cosmology: large scale structure of the universe – Galaxies: evolution1 Introduction
The Great Observatories Origins Deep Survey (GOODS) is a public, multi-facility project aimed at gathering the best and deepest multi-wavelenght data to investigate some of the most profound cosmological issues, such as the formation and evolution of galaxies and active galactic nuclei, the distribution of luminous and dark matter at high redshift, the cosmological parameters from distant supernovae, and the extragalctic background light (for an overview of GOODS, see Dickinson et al. 2003; Renzini et al. 2003; Giavalisco et al. 2004). The program has targeted two carefully selected fields, the Hubble Deep Field North (HDFN) and the Chandra Deep Field South (CDFS), with three NASA Great Observatories (HST, Spitzer and Chandra), ESA’s XMM-Newton, and a wide variety of ground-based facilities. The area common to all the observing programs is 320 arcmin2, equally divided between the North and South fields.
Spectroscopy is crucial to reach the scientific goals of GOODS. In order to reconstruct the evolutionary history of galaxy masses, morphologies, clustering, or star formation, reliable redshifts are essential. Consequently, the CDFS has been target of several spectroscopic campaigns over the last decade (Cristiani et al. 2000; Croom et al. 2001; Cimatti et al. 2002; Bunker et al. 2003; Stanway et al. 2004; Strolger et al. 2004; van der Wel et al. 2004; Dickinson et al. 2004; Szokoly et al. 2004; Le Fèvre et al. 2005; Mignoli et al. 2005; Vanzella et al. 2005, 2006; Ravikumar et al. 2007; Vanzella et al. 2008; Popesso et al. 2009).
The ESO/GOODS spectroscopic program was designed to observe galaxies for which VLT optical spectroscopy was likely to obtain useful data. The program was organized into two large campaigns, carried out with the FOcal Reducer and low dispersion Spectrograph (FORS2) at VLT/UT1 and with the VIsible Multi-Object Spectrograph (VIMOS) at VLT/UT3. The ESO/GOODS spectroscopic program made full use of the VLT instrument capabilities, matching targets to instrument and disperser combinations in order to maximize the effectiveness of the observations.
The FORS2 campaign is completed (Vanzella et al. 2005, 2006, 2008). As a result, 1715 spectra of 1225 individual targets were observed and 887 redshifts were determined with a typical uncertainty of . Galaxies were selected adopting three different color criteria and using photometric redshifts. The resulting redshift distribution spans two redshift domains: from to 2 and from to 6.5. The reduced spectra and the derived redshifts were released to the community through the ESO web pages http://archive.eso.org/cms/eso-data/ data-packages.
The GOODS/VIMOS spectroscopic survey complements the FORS2 survey in terms of completeness and sky coverage. The FORS2 campaign was designed to take advantage of the instrument’s very high throughput at red wavelengths, which allows detecting rest-frame optical and near-ultraviolet spectral features (such as the [OII]3727 emission line) out to , and rest-frame UV emission and absorption lines at . On the other hand, the VIMOS campaign takes advantage of VIMOS’s very large field of view, multiplexing capability, and good instrumental throughput at roughly 3600-9000 , which enable measuring large numbers of redshifts at from the [OII]3727 emission line and other optical and near-UV features, as well as redshifts between 1.5 and 3.5 from Lyman- emission and rest-frame UV absorption lines. The cumulative source counts on the CDFS taken from the deep public FORS1 data (Szokoly et al. 2004), show that down to mag there are objects over the 160 arcmin2 of the GOODS-S field. Only the high multiplexing capabilities of VIMOS at VLT could ensure to reach the required completeness in a reasonable amount of time.
The GOODS/VIMOS program used two different observational configurations, with different object selection criteria. Observations with the Medium Resolution (MR) orange grism target galaxies in the redshift ranges (primarily from [OII]) and (from Ly-). Observations with the Low Resolution Blue (LR-Blue) grism cover the wavelengths of Ly- and UV rest-frame absorption lines at , a range not covered by the FORS2 spectroscopy. On average, 330 objects per mask have been observed with the low resolution () blue grism and 140 with the medium resolution ( orange grism. The overall goal of the GOODS spectroscopic campaign was to reach signal-to-noise (S/N) ratios adequate to measure redshifts for galaxies with AB magnitudes in the range , in the band for objects observed with the VIMOS LR-Blue grism, in the band for objects observed with the VIMOS MR grism, and in the band for objects observed with FORS2.
The first part of the GOODS/VIMOS spectroscopic survey has been recently released (Popesso et al. 2009, hereafter P09). The first release includes 2344 spectra from 6 LR-Blue masks and 968 from 6 MR masks. The number of redshifts obtained is 1481 and 656 for the LR-Blue and the MR campaign, respectively.
In this paper we report on the full data set of the VIMOS spectroscopic follow-up campaign in the CDFS, carried out with the VIMOS instrument at the VLT from ESO observing periods P74 through P78 (mid 2004 through early 2007). This final release includes a total of 10 masks for the LR-Blue grism and 10 masks for the MR grism.
The plan of the paper is as follows. In Sect. 2 we describe the GOODS/VIMOS survey and the target selection criteria used. In Sect. 3 we describe the observations and the data reduction. The redshift determination and the full data set is presented in Sect. 4 and discussed in Sect. 5. In Sect. 6 we summarize the results of the GOODS/VIMOS spectroscopic campaign and our conclusions.
Throughout this paper the magnitudes are given in the AB system (AB ), and the ACS F435W, F606W, F775W, and F850LP filters are denoted hereafter as , , and , respectively. We assume a cosmology with and km s-1 Mpc-1.
2 Target selection
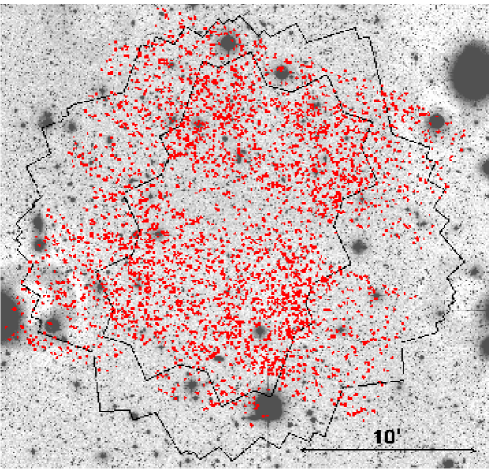
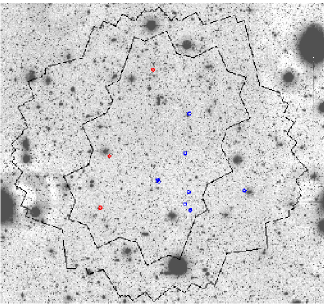
VIMOS (LeFevre et al. 2003) is a 4-channel imaging spectrograph, each channel (“quandrant”) covering arcmin2 for a total field of view (“pointing”) of arcmin2. Because of its geometry (a field of view, with a cross gap of between the quadrants) only of VIMOS field of view overlaps with the area roughly defining the GOODS-S field. The spectroscopic campaign was designed to cover the whole GOODS area. At least 3 VIMOS pointing are required to cover the GOODS area, filling the gaps between the quadrants, with some fraction of the VIMOS coverage extending outside the GOODS-S field into the CDFS and the “Extended” CDFS (ECDFS). Figure 1 shows the spatial distribution of the sources observed in the two VIMOS surveys (both LR-Blue and MR objects), which outlines the VIMOS coverage of the GOODS/CDFS field.
The survey strategy and target-selection criteria are the same as in P09, where a detailed description can be found. Here, we recall the imaging data, the source catalogs, and the main criteria used for target selection in the GOODS/VIMOS spectroscopic campaign. The imaging data and source catalogs used are:
-
•
CTIO m MOSAIC -band imaging and ESO m WFI - and -band imaging, covering the ECDFS, with AB magnitude 5 depths 26, 26.2 and 25.8 mag, respectively (Giavalisco et al. 2004), used for Lyman break U-dropout and “sub-U-dropout” color selection, both inside and outside the nominal GOODS-S area;
-
•
HST-ACS and imaging, covering the GOODS-South field ( arcmin2) with depth 27.8 and 27.4 mag (Giavalisco et al. 2004), used for the color-selection technique within the GOODS-S field;
-
•
VLT-ISAAC -band imaging covering the GOODS-S field with depth 25.1 mag (Retzlaff et al. in preparation), for applying the selection technique in GOODS-S field;
- •
The wavelength range covered by the VIMOS LR-Blue grism (3500-6900 ) is suitable for the detection of ultraviolet absorption and emission features of objects in the redshift range . Targets for the VIMOS LR-Blue grism were selected using the following criteria:
-
•
U-dropouts, i.e. Lyman-break color-selection of galaxies, using the CTIO and WFI and photometry, designed to select blue, star-forming galaxies at ;
-
•
so-called “sub-U-dropouts”, i.e. color-selected objects with colors somewhat bluer than those of the ‘normal’ U-dropout Lyman break selection criteria, designed to select star-forming galaxies at somewhat lower redshifts than those of the regular U-dropouts, nominally to 2.5;
-
•
color-selection (Daddi et al. 2004), designed to select galaxies at . Late in the VIMOS campaign, additional Spitzer/IRAC color criteria were applied to try to refine the method (see P09);
- •
No low redshift galaxies were intentionally targeted for the LR-Blue masks, although as discussed in P09, some foreground interlopers do “contaminate” the color-selected samples, particularly the sub-U-dropouts. A magnitude cut at mag was applied to all target catalogs listed above.
The wavelength range of the VIMOS MR grism is 4000-10000 , similar to that of FORS2. However, because of the stronger fringing at red wavelength ( ) and the lower red throughput of VIMOS compared to FORS2, optical rest-frame spectral features for galaxies at and ultraviolet rest-frame spectral features of Lyman break galaxies (LBGs) at are harder to detect with VIMOS than with FORS2. Therefore, the target selection for the VIMOS MR grism was limited to brighter galaxies (mainly expected to be at ), and to color-selected LBGs in the redshift range . Target selection for the MR grism used the available imaging data and photometry catalogs according to the following criteria:
-
•
galaxies with , with no other color pre-selection, excluding VIMOS LR-Blue targets and objects already observed in other spectroscopic programs. In the later VIMOS campaigns, some preference was given to galaxies detected at 24 m from the GOODS Spitzer MIPS data (Dickinson et al. in preparation; Chary et al. in preparation), meeting the same mag limit.
- •
No photometric redshifts were used, nor a surface brightness selection was applied when selecting galaxies for observations. GOODS/VIMOS masks were designed to avoid as much as possible objects already observed in previous redshift surveys (e.g. Cimatti et al. 2002; Szokoly et al. 2004; Le Fèvre et al. 2005; Vanzella et al. 2005, 2006, 2008).
3 Observations and data reduction
The VLT/VIMOS spectroscopic observations were carried out in service mode during ESO observing periods P74-P78. A log of all the GOODS/VIMOS observations is presented in Table 1. The total exposure time per mask is 4 h. Each LR-Blue mask consists of 10 exposures of 24 min, while each MR mask consists of 12 exposures of 20 min. This work adds 8 new masks to the previous release (12 masks, P09), for a total of 20 VIMOS masks. All the masks were designed with slits. The spatial scale for VIMOS is /pixel.
In the LR-Blue campaign, the LR-Blue grism was used together with the Order Sorting OS_Blue cutoff filter. In this configuration the useful wavelength range is , the nominal resolution is , corresponding to a spectral resolution of , and the dispersion is pixel.
The MR grism and the GG475 filter were used in the MR campaign. In this configuration the useful wavelength range is , the nominal resolution is , which corresponds to a spectral resolution of , and the dispersion is pixel.
For a detailed description of the preparation of VIMOS observations and the procedure used for data reduction we refer the reader to P09.
| Mask ID | Date | Exp. time (s) |
| (1) | (2) | (3) |
| LR-Blue masks (P09) | ||
| GOODS_LRb_001 | Sept.-Oct. 2004 | |
| GOODS_LRb_001_1 | Nov. 2004 | |
| GOODS_LRb_002 | Oct.-Nov. 2004 | |
| GOODS_LRb_003_new | Oct. 2005 | |
| GOODS_LRb_003_new_1 | Oct.-Nov. 2005 | |
| GOODS_LRb_003_new_2 | Nov.-Dec. 2005 | |
| MR masks (P09) | ||
| GOODS_MR_001 | Nov. 2004 | |
| GOODS_MR_002_1 | Jan. 2005 | |
| GOODS_MR_new_1 | Dec. 2005 | |
| GOODS_MR_new_2 | Jan. 2006 | |
| GOODS_MR_new_2_1 | Jan. 2006 | |
| GOODS_MR_new_3_c | Sept.-Oct. 2006 | |
| LR-Blue masks (this work) | ||
| GOODS_LRb_002_1 | Dec. 2004 | |
| GOODS_LRb_dec06_1 | Nov. 2006 | |
| GOODS_LRb_dec06_2 | Nov. 2006 | |
| GOODS_LRb_dec06_3 | Nov.-Dec. 2006 | |
| MR masks (this work) | ||
| GOODS_MR_dec06_1 | Oct. 2006 | |
| GOODS_MR_dec06_2 | Oct.-Nov. 2006 | |
| GOODS_MR_dec06_3 | Oct. 2006 | |
| GOODS_MR_dec06_4 | Jan. 2007 | |
3.1 Target coordinates
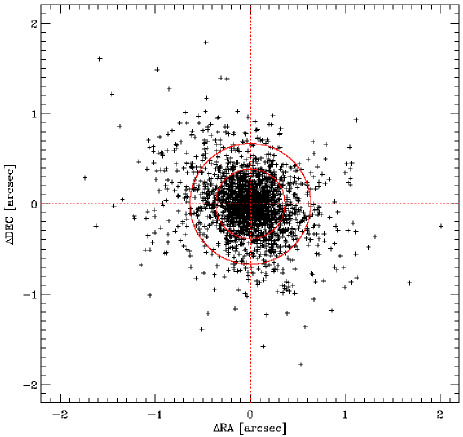
The pipeline processing of the GOODS/VIMOS data was carried out using the VIMOS Interactive Pipeline Graphical Interface (VIPGI, Scodeggio et al. 2005). As it was pointed out in the previuos release (P09), since the rotation angle of the GOODS/VIMOS pointings ( deg) is different from the default values accepted by VIPGI ( or deg), the software does not provide the astrometry for the extracted spectra. We followed the same procedure described in P09 to retrieve target coordinates. In addition, we cross-correlated the “reconstructed” coordinates, obtained as in P09, with the WFI -band catalog. In our final released catalogs we provide for each object both the “reconstructed” VIMOS coordinates and the coordinates of the matching (within a positional tolerance of ) WFI -band object. If no match is found, we repeat the “reconstructed” VIMOS coordinates. Fig. 2 shows the distribution of RA and DEC computed between VIMOS “reconstructed” coordinates and the coordinates of the matching WFI -band object for the VIMOS LR-Blue spectroscopic catalog. The rms dispersion is smaller than on both coordinates ensuring accurate target identification.
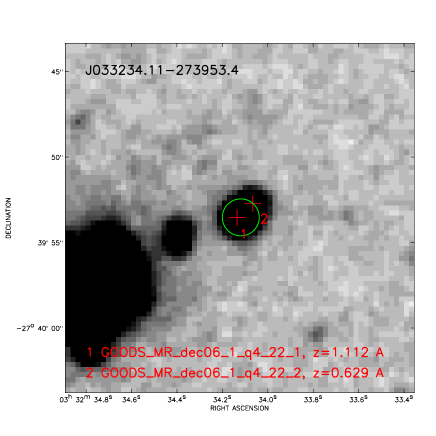
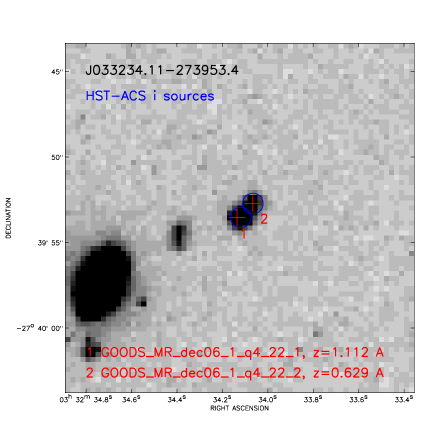
It is worth noticing that 48 cases (39 in the LR-Blue and 9 in the MR grism) could be identified, where two closely separated () spectra are extracted in the same slit for two objects that are blended in WFI images and, therefore, match a single WFI object. In all these cases, the WFI coordinates and the coordinate-based names assigned to each pair are the same. However, the information on the “correct” position may still be retrieved from their reconstructed VIMOS coordinates. In Fig. 3 we show one such case. The comparison between the WFI -band and the ACS -band images clearly reveals the close pair of sources and the good accuracy of their VIMOS reconstructed position.
As mentioned in P09, due to a bug, VIPGI assigns wrong focal plane coordinates to a small number of objects in slits with more than 2 spectra. In most cases the extracted spectra of these objects lie very close to the edge of the 2D spectrum. Targets with uncertain coordinates were 81 in the LR-Blue campaign (out of which 80% had no redshift determination) and 34 in the MR campaign (50% without redshift), all of which are serendipitously observed objects. Among them, we selected objects having a redshift determination (18 in the LR-Blue catalog and 16 in the MR catalog), in order to attempt to retrieve their coordinates manually. From a visual inspection of the 2D spectrum and using the coordinates of primary targets and, if present, other objects in the same slit as a reference, we could unambigously identify and retrieve coordinates for all of the 34 objects selected. Their new coordinates are included in the final released catalogs.
The remaining 63 and 18 (from the LR-Blue and the MR catalog respectively) serendipitous objects having uncertain coordinates and no redshift estimate were removed from the final released catalogs.
4 Redshift determination
The total number of GOODS/VIMOS spectra extracted is 3634 in the LR-Blue and 1418 in the MR campaign. We were able to determine 2242 and 976 redshifts in the LR-Blue and the MR campaign, respectively. Serendipitous objects constitute % of the LR-Blue and % of the MR objects. We have identified 3305 single LR-Blue objects and 1297 single MR objects. Out of those, we were able to determine 2074 and 885 redshifts in the LR-Blue and the MR campaign, respectively.
The redshifts were estimated following a different procedure compared to P09. We avoid the use of the rvsao package in IRAF to cross-correlate individually observed spectra with template spectra. Instead, we proceed via visual inspection first, assigning redshifts only to the most obvious cases, where more than 2 spectral features could be unambigously identified. VIPGI’s software EZ was subsequently used for the cross-correlation with template spectra (i.e. ordinary S0, Sa, Sb, Sc, and elliptical galaxies at low redshift, Lyman break galaxies and quasars at high redshift) in dubious cases only.
Redshift were determined through the identification of prominent features of galaxy spectra:
-
•
at low redshift the absorption features: the break, Ca H and K, H and H in absorption, G-band, MgII 2798
-
•
and the emission features: [O ii]3727, [O iii]5007, H, H
-
•
at high redshift: Ly, in emission and absorption, ultraviolet absorption features such as [Si ii]1260, [O i]1302, [C ii]1335, [Si iv]1393,1402, [S ii]1526, [C iv]1548,1550, [Fe ii]1608 and [Al iii]1670
In analogy to the complementary GOODS/FORS2 redshift campaign (Vanzella et al. 2005, 2006, 2008), we use four quality flags to indicate the quality of a redshift estimate. Quality flags are assigned with the following criteria:
-
•
flag A, high quality, i.e. several emission lines and strong absorption features are well identified;
-
•
flag B, intermediate quality, i.e. at least two spectral features are well identified, for instance one emission line plus few absorption features;
-
•
flag C, low quality, i.e. spectral features, either in emission or in absorption, are less clearly identified;
-
•
flag X, no redshift estimated. No features identified.
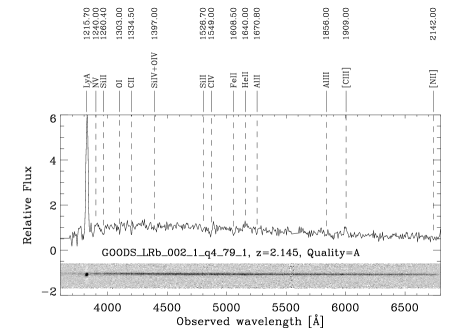
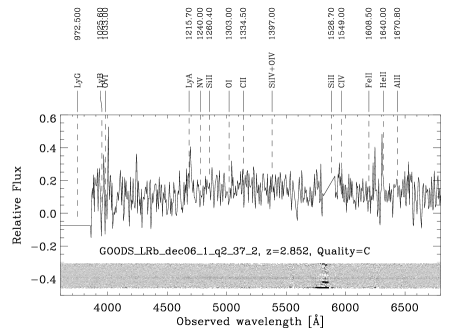
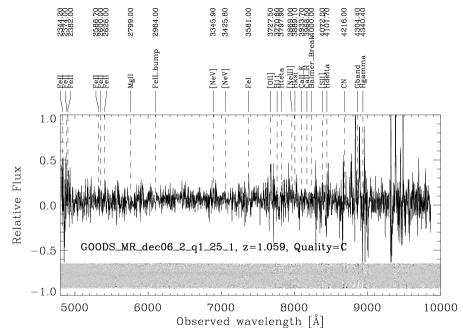
Each spectrum with the superposed main spectral features, is visually inspected independently by different people and the redshift determination and the quality flag assignment are eventually further refined. On average, each spectrum is checked more than three times. Fig. 4 shows the quality of VIMOS spectra ranked by S/N: typical LR-Blue and MR spectra for quality-A, -B, and -C redshift etimates are shown for comparison.


In of the cases the redshift is based only on one emission line, usually identified with [O ii]3727 or Ly-. In these cases the continuum shape, the presence of breaks, the absence of other spectral features in the observed spectral range and the broad band photometry are particularly important in the evaluation. In general these solo-emission line redshifts are classified as “likely” (B) or “tentative” (C) if no other information is provided by the continuum.
In order to investigate possible differences in the redshift estimates that could be introduced by the different methods utilized in the two releases, we compared the reshift resulting from the two different methods for two quadrants of one of the new LR-Blue masks. We verified that our procedure produced equivalent results to that used in the previous release, with the only noticeable exception of the absence of an overabundance of low-quality estimates in the range , that was affecting the previous release (see P09; see also Sect.4.1 and Figure 7) and which was probably due to the different method used in determining redshifts.
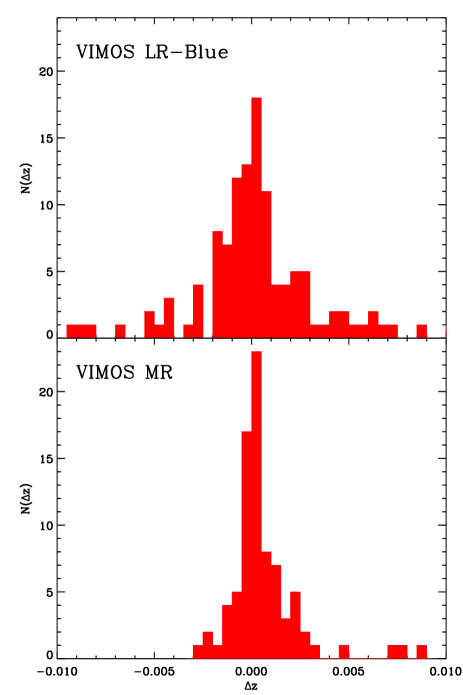
We estimated the internal redshift accuracy by comparing the redshift measurements of all the objects observed twice in independent VIMOS masks. We found 118 such objects in the LR-Blue masks and 83 in the MR masks with redshift quality flag A or B. In Figure 5 we plot histograms of the difference in redshift measurements () separately for the LR-Blue and MR grisms. The difference of redshift measurements in the LR-Blue campaign has a Gaussian distribution with and , therefore the accuracy of single redshift measurements is (). For the MR redshifts the Gaussian distribution has a mean and a dispersion , therefore the accuracy on a single measurement is ().
4.1 Reliabilty of redshifts
In order to assess the reliability of our redshift estimates we compared them with independent measurements from other publicly available spectroscopic surveys in the CDFS: the GOODS-FORS2 campaign (Vanzella et al. 2005, 2006, 2008), the K20 survey (Mignoli et al. 2005), the Szokoly et al. (2004) survey, the VVDS survey (Le Fèvre et al. 2005), and the IMAGES survey (Ravikumar et al. 2007). As in P09, we combined the redshift information from all these surveys into a “master catalog111This compilation of redshifts from all the public spectroscopic surveys is available in electronic form at: http://www.eso.org/sci/activities/projects/goods/”, cleaned from duplicate observations (in case of double or multiple observations we kept the mean value of the redshift estimates). However, to refine the test on redshift reliability performed in P09, we created a “secure” redshift reference sample by selecting only the best-quality (all reliable at c.l.) redshift determinations for each survey (i.e. GOODS-FORS2 quality A, K20 quality 1, VVDS quality 4, Szokoly et al. (2004) quality 3, and IMAGES quality 2 redshifts).
We found 95 VIMOS LR-Blue targets matching with objects of the high-quality reference sample within a spatial accuracy of 0.3 arcsec or better. Out of them, 21 have VIMOS quality flag A, 19 have flag B, 27 have flag C and 28 do not have a redshift estimate (flag X). Most of the objects without redshift lie in a redshift range not accessible to the LR-Blue grism (i.e. ). “Catastrophic” discrepancies () are found only for VIMOS lower-quality redshifts (i.e. flag B and C), which are always less convincing than the corresponding estimates from other surveys. The resulting confidence level is for quality-A (all of the 21 redshifts compared with the reference catalog are correct), for quality-B (7 discrepancies out of 19 compared redshifts), and for quality-C (22 discrepancies out of 27) redshift determinations.
In the VIMOS MR survey we found 78 objects in common with the high-quality reference sample, matching within a spatial accuracy of 0.3 arcsec. Out of them, 10 have VIMOS quality flag A, 35 have quality flag B, 13 have quality flag C, and 20 have no redshift estimate (flag X). We only find 7 catastrophic discrepancies (): 2 have flag B and 5 have flag C. Hence, we estimate a confidence level of for quality-A (all of the 10 redshifts compared with the reference catalog are correct), for quality B (2 discrepancies out of 35), and for quality C (5 discrepancies out of 13) redshift determinations.
Our new estimates of confidence levels for the reliability of different quality flags are consistent with those obtained in the previous release (see P09) with the only exception of LR-Blue quality-C redshift, which are found to be less reliable then previously estimated.
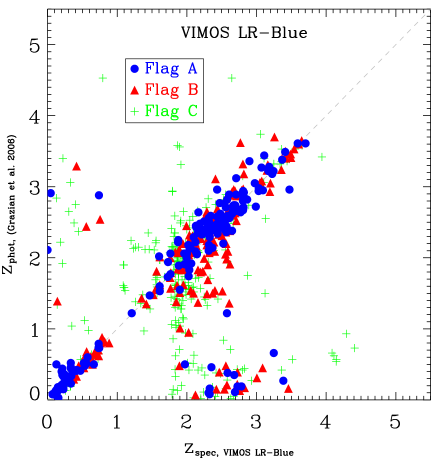
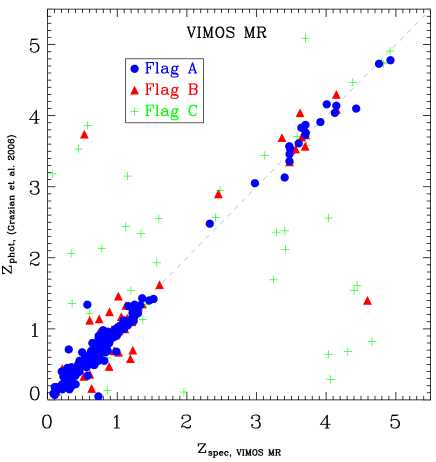
P09 used also another test to quantify the reliability of the redshifts based on the simultaneous use of two independent photometric catalogs (i.e. Grazian et al. 2006, Daddi et al., private communication). However, results were in line with those obtained from the comparison with high-quality spectroscopic redshift from other surveys. Here, we plot in Figure 6 the comparison between the GOODS/VIMOS spectroscopic redshifts and the GOODS-MUSIC photometric redshifts, which includes all the objects matching within an angular tolerance of . In the case of LR-Blue objects, we notice that a few objects, including 16 objects with secure spectroscopic redshifts (i.e. flag A), have large discrepancies compared to their photometric estimates (see also Figure 6 in P09). We checked the spectra of the 13 objects at with quality-A spectroscopic redshifts and large discrepancies () compared to the photometric redshifts. The average WFI magnitude of these objects is 24.4 and all the spectra have a relatively good S/N, enabling the clear identification of Ly- in emission or absorption and several UV absorption lines. The spectra of these galaxies have also been used to produce the stacked spectra described in Sect. 5.3.
4.2 Success rate for VIMOS LR-Blue targets
A summary of the final results of the VIMOS LR-Blue spectroscopic campaign is presented in Table 2. We measured redshifts for 66% (62% including also the secondary serendipitous objects) of the observed LR-Blue spectra. If only high-quality redshift determinations (i.e. A or B) are considered, the success rate of the LR-Blue survey is 43% for the original target sample and 38%, if also secondary targets are considered. Serendipitous sources, which account for 21% of the sample, are usually faint neighbor of the primary targets and lie often at the edge of the 2D spectrum. Moreover, they are not color-selected as the primary LR-Blue targets, therefore, they may often lie at redshifts that are not accessible to the wavelength range covered by the chosen grism. The success rate for these objects is indeed relatively low ().
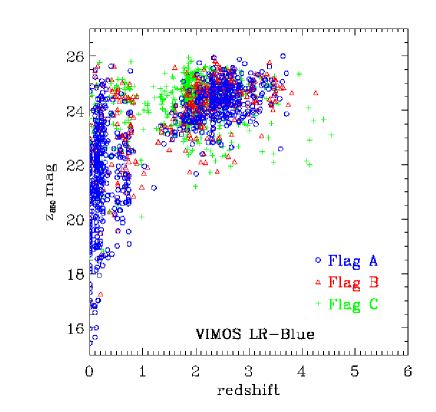
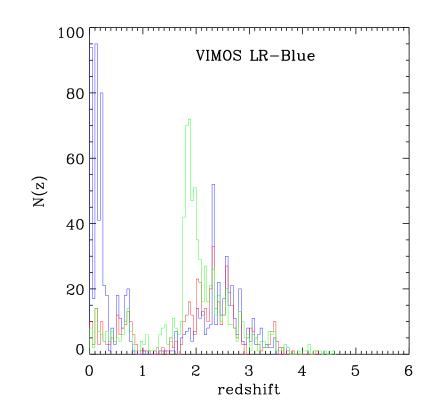
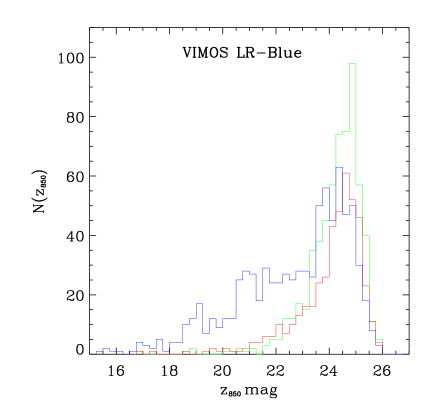
Figure 7 shows the magnitudes as a funtion of redshift together with the histograms of redshift and magnitude distribution. These plots show that objects with lower quality redshifts (C) tend to be very faint () and have estimated redshifts in the range . As already discussed in P09, objects with lower quality redshifts tend to have very faint magnitudes and have in general lower S/N spectra. Moreover, the higher failure rate observed for galaxies and galaxies at may be explained by the fact that the Ly- is often outside the spectral range covered by the LR-Blue grism (i.e. ) and by the fact that the VIMOS efficiency drops very quickly below (see also P09).
| LR-Blue | |||||
|---|---|---|---|---|---|
| P09∗ (6 masks) | A | B | C | X | Total |
| Num. of entries | 617 | 302 | 550 | 810 | 2279 |
| Primary targets | 544 | 265 | 415 | 526 | 1750 |
| Secondary targets | 73 | 37 | 135 | 284 | 529 |
| This work (4 masks) | |||||
| Num. of entries | 236 | 240 | 297 | 582 | 1355 |
| Primary targets | 213 | 208 | 244 | 466 | 1131 |
| Secondary targets | 23 | 32 | 53 | 116 | 224 |
| Total (10 masks) | |||||
| Num. of entries | 853 | 542 | 847 | 1392 | 3634 |
| Primary targets | 757 | 473 | 659 | 992 | 2881 |
| Secondary targets | 96 | 69 | 188 | 400 | 753 |
4.3 Success rate for VIMOS MR targets
We measured redshifts for 73% (69% including also the secondary serendipitous objects) of the observed MR spectra. In the VIMOS MR spectral campaign the overall success rate (i.e. redshift with quality A or B) is 58% and reaches 63% if only primary targets are considered. In Table 3 we summarize the final results of the VIMOS MR spectroscopic campaign.
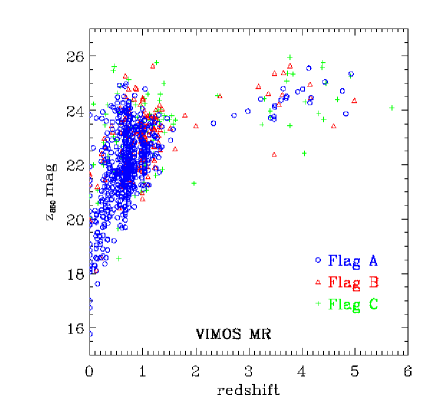
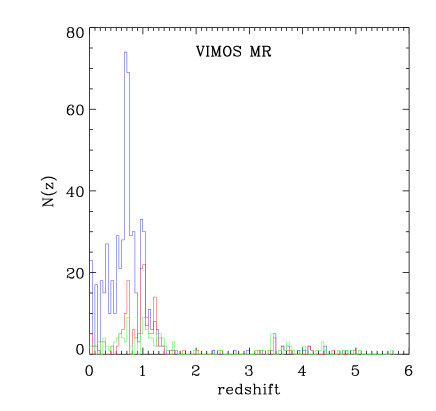
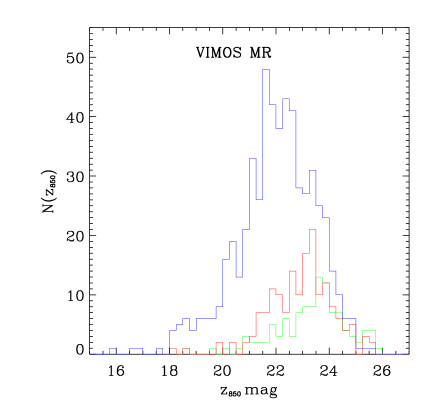
Figure 8 shows the magnitudes as a funtion of redshift for different redshift quality together with a histogram of the redshift distribution and a histogram of the distribution of magnitudes for different redshift quality. Here we notice that the C flags are more frequent at , most probably due to the fact that above this redshift the main spectral features enter a wavelength range where both the OH sky emission lines and the CCD fringing are strong (i.e. at ), making line identification more difficult. We may also notice a slight trend with magnitude. As expected, lower quality flags peak at fainter magnitudes, due to the lower S/N of their spectra.
| MR | |||||
|---|---|---|---|---|---|
| P09∗ (6 masks) | A | B | C | X | Total |
| Num. of entries | 458 | 112 | 85 | 295 | 950 |
| Primary targets | 433 | 98 | 70 | 215 | 816 |
| Secondary targets | 25 | 14 | 15 | 80 | 134 |
| This work (4 masks) | |||||
| Num. of entries | 170 | 88 | 63 | 147 | 468 |
| Primary targets | 148 | 75 | 43 | 115 | 381 |
| Secondary targets | 22 | 13 | 20 | 32 | 87 |
| Total (10 masks) | |||||
| Num. of entries | 628 | 200 | 148 | 442 | 1418 |
| Primary targets | 581 | 173 | 113 | 330 | 1197 |
| Secondary targets | 47 | 27 | 35 | 112 | 221 |
4.4 Data products and redshift catalogs
The data products of the GOODS/VIMOS spectroscopic campaign released to the community222http://archive.eso.org/cms/eso-data/data- packages include, for each spectrum, the 1-dimensional flux-calibrated (in units of erg cm-2 s-1 ) spectrum in FITS format and the corresponding plot in postscript format.
We created two separated redshift catalogs: one for the VIMOS LR-Blue and one for the VIMOS MR campaign. In the two catalogs (see Table 4) we provide for each object: (column 1) the coordinate-based GOODS identification number, where the coordinates used are those of the matching WFI object, (column 2) the VIMOS identification number, (columns 3-4) the coordinates of the matching WFI object, (columns 5-6) the original VIMOS coordinates, (columns 7-10) and band WFI magnitudes with the corresponding errors, (columns 11-12) GEMS magnitudes and corresponding errors, (column 13) redshift, (column 14) quality flag, (column 15) comments and identified spectral features, (column 16) a label for primary or secondary (i.e. serendipitous) objects, and (column 17) a label to distiguish between the first (P09) and second VIMOS release (this work).
| ID GOODS | ID VIMOS | RAWFI | DECWFI | RAVIMOS | DECVIMOS | mag |
|---|---|---|---|---|---|---|
| (1) | (2) | (3) | (4) | (5) | (6) | (7) |
| J033133.01-274243.9 | GOODS_LRb_002_1_q2_4_1 | 52.8875408 | -27.7121947 | 52.8875408 | -27.7121947 | 23.034 |
| J033133.08-274301.0 | GOODS_LRb_003_new_1_q2_3_1 | 52.8878231 | -27.7169564 | 52.8878330 | -27.7169530 | 25.590 |
| J033133.44-274350.7 | GOODS_LRb_001_1_q2_3_1 | 52.8893390 | -27.7307466 | 52.8893390 | -27.7307470 | 19.698 |
| J033133.54-274303.6 | GOODS_LRb_001_1_q2_6_1 | 52.8897394 | -27.7176759 | 52.8897400 | -27.7176700 | 21.711 |
| J033133.91-274349.5 | GOODS_LRb_001_1_q2_3_2 | 52.8913004 | -27.7304179 | 52.8912850 | -27.7304150 | 22.733 |
| J033135.07-274256.4 | GOODS_LRb_002_1_q2_8_1 | 52.8961455 | -27.7156782 | 52.8961455 | -27.7156782 | 21.322 |
| J033135.85-274312.2 | GOODS_LRb_003_new_1_q2_7_1 | 52.8993653 | -27.7200705 | 52.8993610 | -27.7200740 | 21.715 |
| J033136.03-274328.9 | GOODS_LRb_001_1_q2_11_1 | 52.9001304 | -27.7246852 | 52.9001310 | -27.7246880 | 20.268 |
| J033136.08-274408.7 | GOODS_LRb_002_1_q2_5_1 | 52.9003479 | -27.7357574 | 52.9003479 | -27.7357574 | 24.448 |
| J033136.09-274240.3 | GOODS_LRb_003_new_1_q2_10_1 | 52.9003640 | -27.7111941 | 52.9003600 | -27.7112160 | 24.406 |
| J033136.18-274217.5 | GOODS_LRb_001_1_q2_16_1 | 52.9007486 | -27.7048485 | 52.9008030 | -27.7048170 | 20.468 |
| J033136.44-274421.9 | GOODS_LRb_001_1_q2_8_1 | 52.9018278 | -27.7394201 | 52.9018100 | -27.7394120 | 25.134 |
| J033136.53-274415.4 | GOODS_LRb_003_new_1_q2_4_1 | 52.9022064 | -27.7376119 | 52.9022140 | -27.7376100 | 22.879 |
| J033137.26-274220.6 | GOODS_LRb_003_new_1_q2_13_1 | 52.9052472 | -27.7057199 | 52.9052810 | -27.7057650 | 24.442 |
| J033137.27-274553.8 | GOODS_LRb_002_1_q2_2_2 | 52.9053051 | -27.7649414 | 52.9053051 | -27.7649414 | 24.747 |
† Only a portion of the table is shown here for guidance regarding the form and content of the catalog. The entire table is available in electronic form at http://archive.eso.org/cms/eso-data/data-packages. The full table contains 17 columns of information on 3634 spectra.
For each grism we released two catalogs: one cleaned for duplicate observations of the same object, in which case we kept the best redshift estimate (with the only exception of objects having two quality-C redshifts, in which case we kept both estimates), and another containing the complete set of observations including duplicates. The final VIMOS LR-Blue catalog contains 3634 entries for 3271 individual targets and the final VIMOS MR catalog contains 1418 entries for 1294 individual targets.
5 Discussion
5.1 Redshift distribution and large scale structure
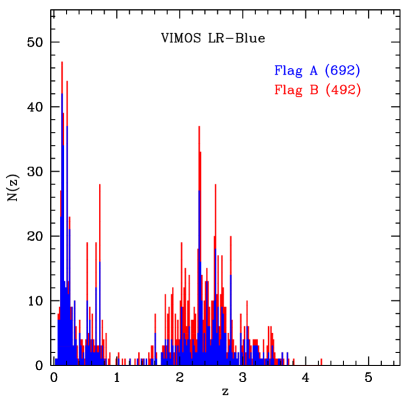
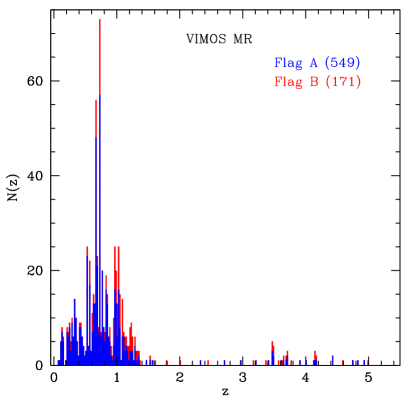
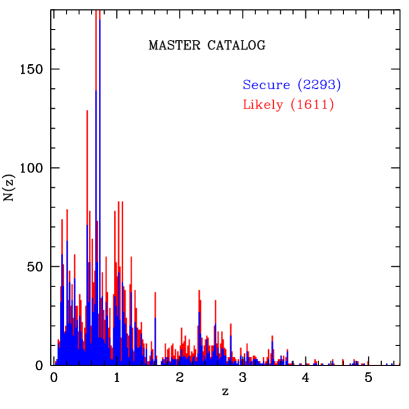
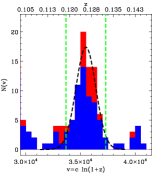
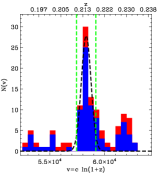
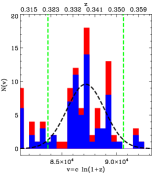
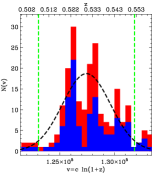
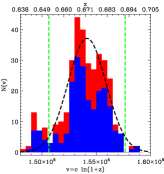
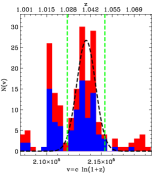
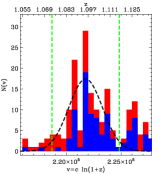
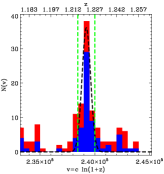
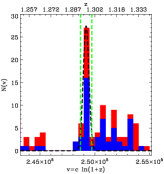
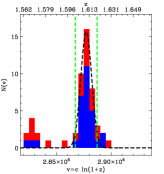
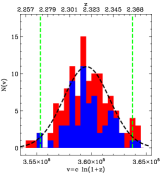
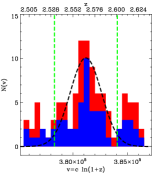
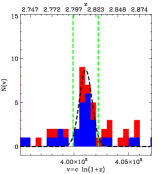
The fine-grain redshift distribution of galaxies in the VIMOS LR-Blue and MR catalogs is shown in Figure 9, where only objects with redshift quality A and B are plotted. We also plot the redshift distribution of the reference master catalog, described in Sect. 4.1, which collects 4227 objects (including stars) having high-quality redshift determinations (confidence level ) from all the publicly available spectroscopic surveys in the CDFS. In order to standardize as much as possible the quality flag used in different surveys, we subdivided the master catalog into two subsamples: one including only “secure” redshifts (reliable at c.l.) comparable to VIMOS quality-A redshifts and another one including “likely” redshift determinations (reliable at c.l.) comparable to VIMOS quality-B redshifts. A similar sample was used by P09 to assess the significance of the observed large scale structures. In P09 the significance of the observed peaks of the redshift distribution was investigated through a procedure similar to that used by Cohen et al. (1999) and Gilli et al. (2003): sources are distributed as a function of , rather than , where corresponds to the local velocity variation relative to the Hubble expansion. Simulations were used to assess the significance of the peaks in the redshift distribution. The procedure used in P09 allowed to confirm the presence of 14 peaks.
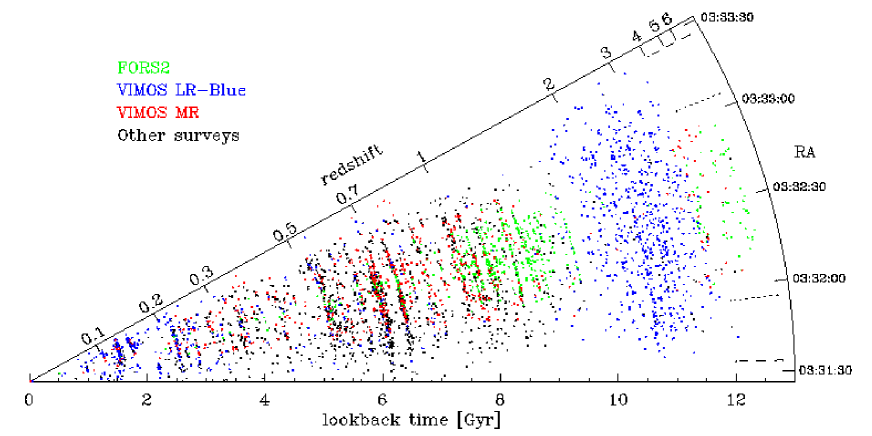
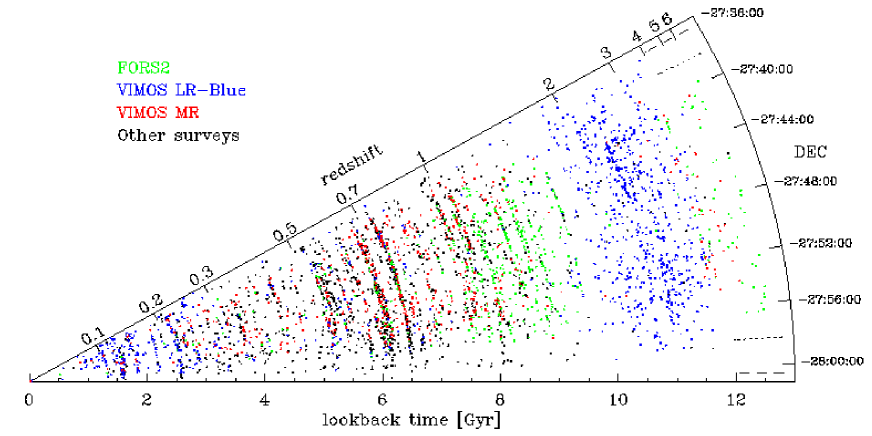
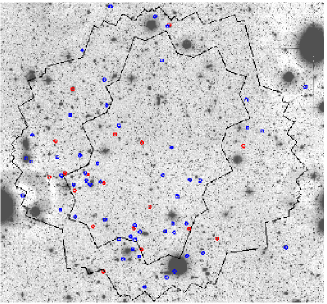
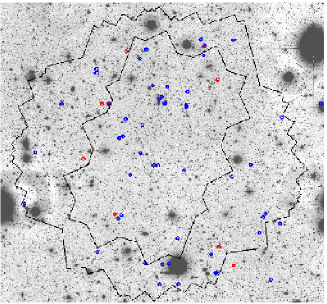
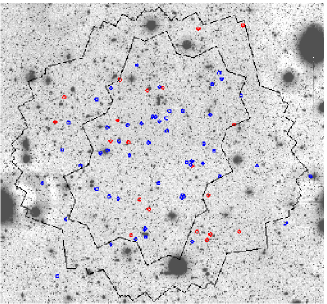
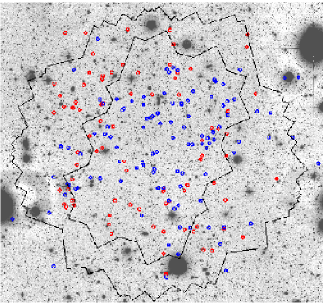
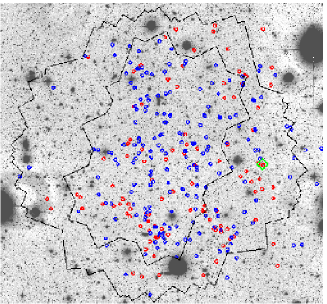
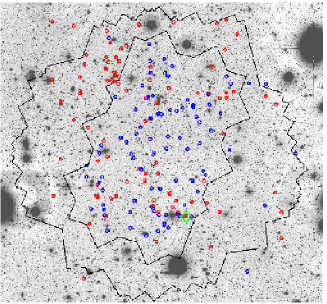
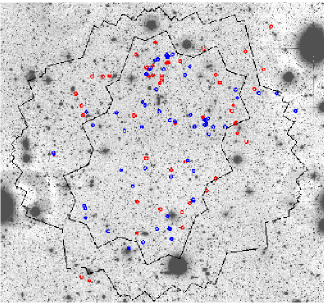
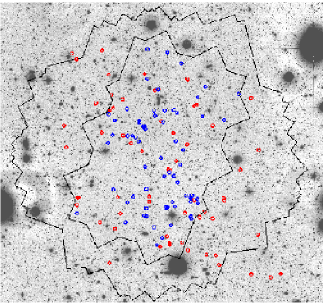
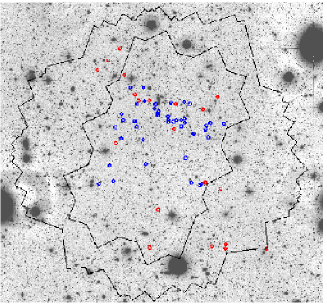
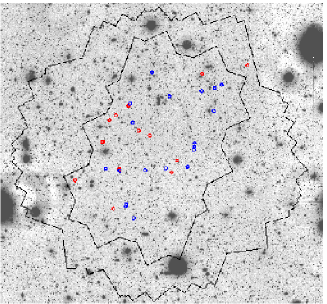
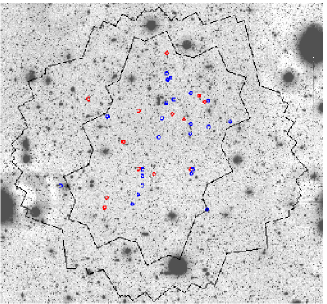
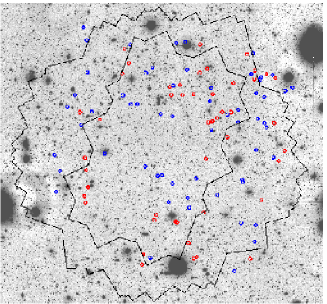
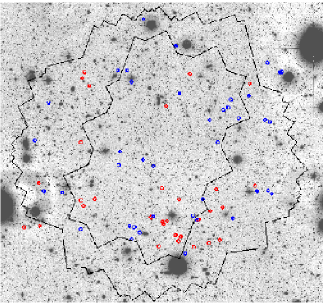
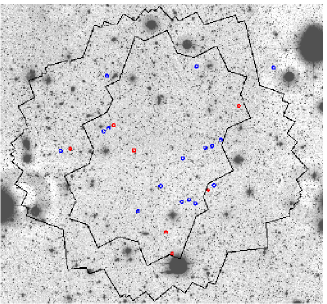
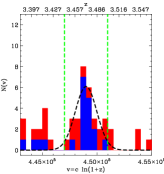
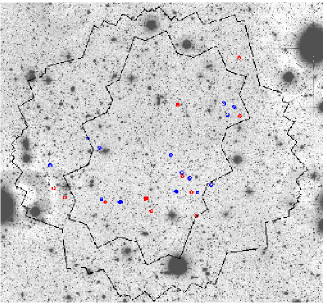
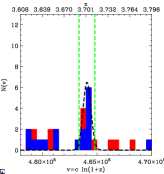
Here, we use the results of the previous analysis to investigate the spatial distribution of galaxies belonging to each of the 14 confirmed peaks, plus three additional tentative structures at , , and in our new, extended, reference master sample (see Fig. 10; see also Table 6 and Fig. 15–17 in the Appendix).
Three structures, having the size of small clusters/groups of galaxies, (i.e. at , , and .) have associated extended X-ray emission. All of them are well-known structures, also observed by other spectroscopic surveys (e.g. GOODS-FORS2, K20).
The galaxies belonging to the cluster-like structure at are rather uniformly distributed on the whole CDFS area. Unfortunately, the extended X-ray source XID 645, most likely corresponding to the cluster core, lies in a region not entirely covered by the available spectroscopic surveys.
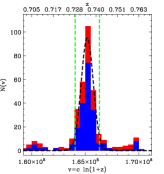
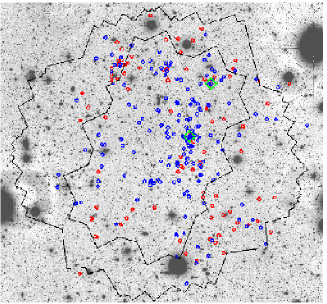
The second cluster-like structure, at , is mostly composed of early-type galaxies concentrated around the central cD galaxy. The two extended X-ray sources (XID 566, 594) associated with this structure are located approximately at the position of the central cD galaxy and to the north.
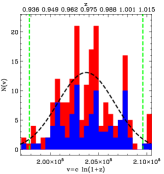
Another interesting cluster-like structure is the one at . The spatial distribution of the galaxies belonging to this structure is quite concentrated and elongated approximately along the east-west direction. Most of the galaxies in this sturcture are concentrated on an area of approximately radius, corresponding to Mpc at .
It is worth noticing that several structures, including those at and , extend over the entire surveyed area. This indicates that the size of these distant large structures must be of the order of Mpc.
At no over-densities were confirmed by the previous analysis in P09. However, Kang & Im (2009) detected an overdensity of galaxies at using photometric redshifts. In Figure 16 we plot the spatial distribution of galaxies belonging to the two furthest density peaks in the GOODS/CDFS, at and , also observed by Vanzella et al. (2009). Interestingly, the 29 galaxies at and the 11 galaxies at appear to be concentrated around the same area.
5.2 Photometric selection of LBGs at
Several photometric techniques have been used to select galaxies at in the various GOODS-S spectroscopic surveys. In P09 the reliability of the and “sub”-U-dropouts selection criteria have been checked against contamination due to foreground interlopers.
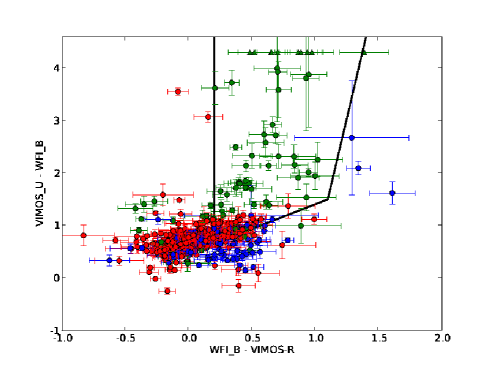
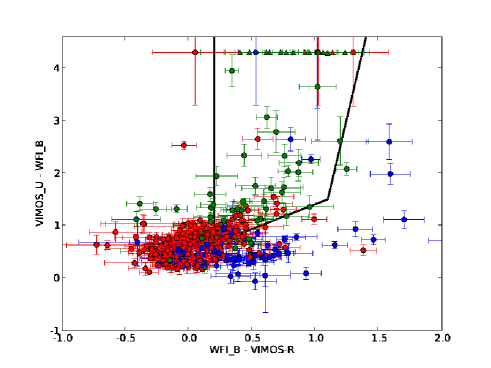
Recently, deep VIMOS -band photometry have been used to test another efficient criterion for the selection of Lyman Break Galaxies (Nonino et al. 2009). Here we use the and colors computed by Nonino et al. (2009) to test the reliability of the selection criterion on our VIMOS LR-Blue catalog of spectroscopic redshifts. Figure 11 shows the color–color diagram for VIMOS LR-Blue objects matching within an angular tolerance of with -band sources within the ACS image, having , and error . Error bars in the plots are as in Nonino et al. (2009). The selection box is analogous to that defined in Nonino et al. (2009) with the only difference that here the WFI -band filter is used instead of the ACS filter. The plot of quality-A redshift estimates confirms that the selection box is quite efficient in selecting galaxies at . However, a small contamination by objects at smaller is still present at . VIMOS LR-Blue quality-B redshifts are less reliable and show more mixing which may be due to mismatches in spectroscopic redshift measurements.
5.3 Ly- EW vs UV Luminosity
After the completion of the GOODS/VIMOS spectroscopic campaign we identified a large number of LBGs: 288 in the LR-Blue campaign have a secure (i.e. quality flag=A) redshift at and 22 in the MR campaign have a secure at redshift . Stacked spectra of all the LBGs available in the first release of the GOODS/VIMOS spectroscopic campaign were presented in P09.
Here, we extend and refine the previous analysis by collecting 288 LBGs with high-quality spectra in the LR-Blue campaign. In Fig. 12 we plot the composite spectra of two sub-samples: 151 LBGs exhibiting Ly- in emission (upper panel) and 137 with Ly- in absorption (lower panel). Low-ionization interstellar absorption lines appear more pronounced in the composite spectrum of LBGs with Ly- in absorption against a stronger UV continuum. The continuum has also a redder spectral slope for this population compared to the Ly- emitters, consistent with other studies of LBGs samples (e.g. Shapley et al. 2003; Pentericci et al. 2007). This becomes more evident when the spectra of Ly- “emitters” are stacked as a function of the Ly- equivalent width (EW), as described below.
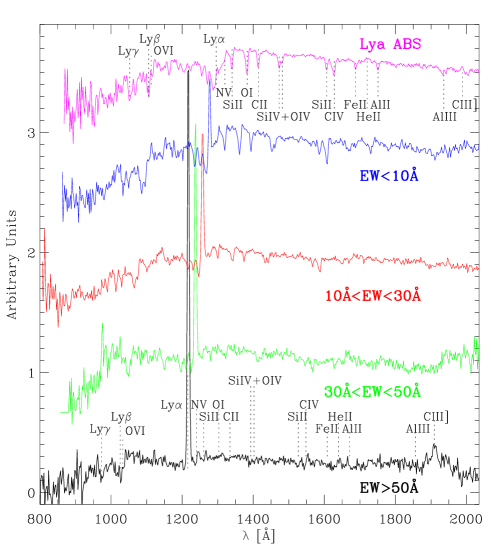
For the sub-sample of 151 Ly- emitters we calculated the EW of the Ly- and the absolute magnitude at (). The EW was measured from the spectra by estimating the average continuum level from a spectral band immediatly red-ward of the Ly-. Errors on the EWs were calculated by propagation of uncertainties, using the -error on the continuum. The absolute magnitude was derived from the -band, assuming a template of a star forming galaxy from Bruzual & Charlot (2003), with constant star formation and spectral slope . Fig. 13 shows a comparison between the composite spectra of Ly- emitters stacked in 4 bins of EW: 55 galaxies with EW, 62 with EW, 17 with EW, and 15 with EW. A trend of stronger absorption lines and redder spectral slopes with decreasing EW of the Ly- is clearly evident. For a comparison, we also plot the stacked spectrum of LBGs with Ly- in absorption, which extends the observed trends toward lower EWs.
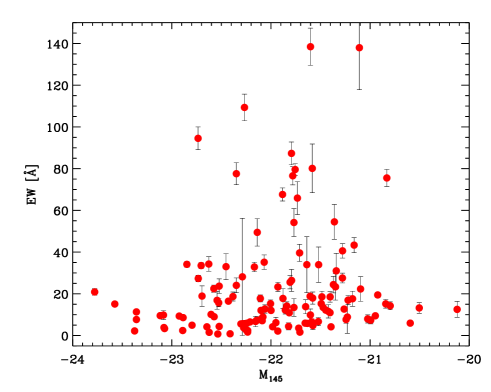
In the redshift range probed by our sample (), we find no clear evidence for a correlation between the EW of the Ly- and redshift. In Fig. 14 we plot the distribution of EWs versus the absolute magnitude at . The plot shows the absence of large EW of Ly- in bright galaxies, which confirms results based on different samples of Ly- emitters and LBGs at (e.g. Shapley et al. 2003; Ajiki et al. 2003; Ando et al. 2006, 2007; Tapken et al. 2007; Verhamme et al. 2008; Vanzella et al. 2009; Pentericci et al. 2009).
The EW of the Ly- line depends on the expansion velocity of the inter-stellar medium, the column density of neutral gas, the dust extinction, and the geometry (or the “clumpiness”) of the medium. A possible explanation for the absence of strong Ly- emission lines in the more luminous galaxies might be the presence of a more dusty and metal rich medium, residual of a recent, or still ongoing, burst of star formation and supernovae explosions in these galaxies.


5.4 New redshifts of X-ray sources
X-ray sources of the CDFS (Giacconi et al. 2002; Luo et al. 2008) and the ECDFS (Lehmer et al. 2005) have been targeted for follow-up optical spectroscopy (Szokoly et al. 2004, Silverman et al., in preparation). In this Section we present new (i.e. not yet published) redshifts for X-ray sources in the CDFS and ECDFS. We cross-correlated our VIMOS catalogs with both the 2Ms CDFS catalog of X-ray sources (Luo et al. 2008) and the catalog of the ECDFS (Lehmer et al. 2005). For the 2Ms CDFS catalog, we found 62 X-ray sources matching within an angular tolerance of objects having redshift determination in the VIMOS LR-Blue catalog and 42 in the VIMOS MR catalog. For the ECDFS catalog, we found 57 X-ray sources matching within a positional tolerance of objects having redshift determination in the VIMOS LR-Blue catalog and 17 in the VIMOS MR catalog.
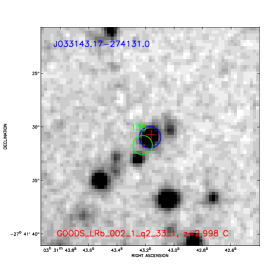
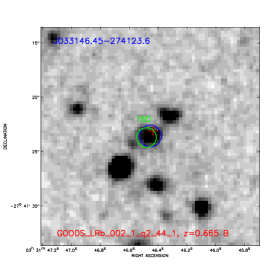
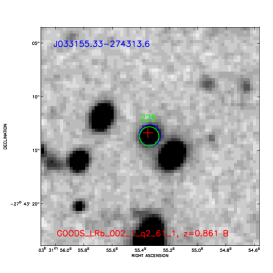
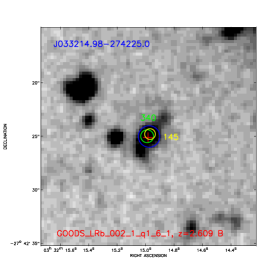
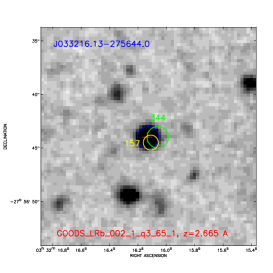
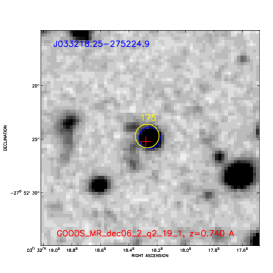
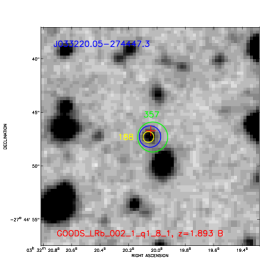
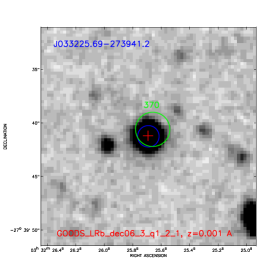
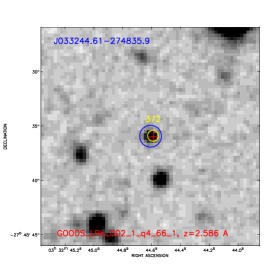
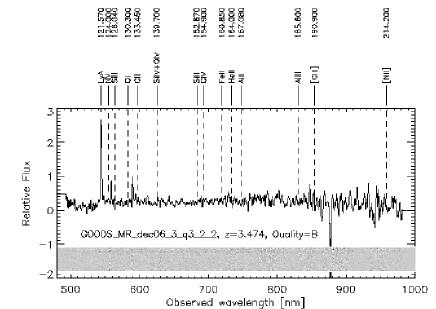
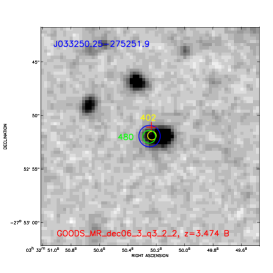
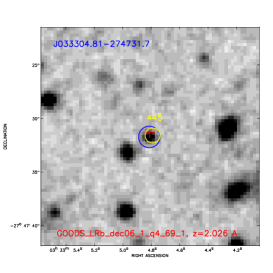
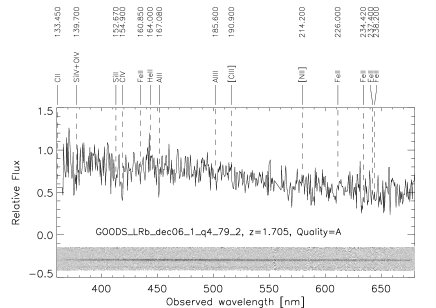
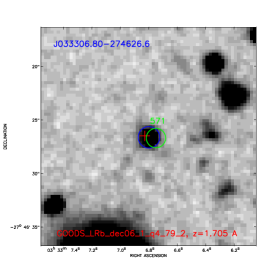
In total 114 X-ray sources have been observed in the GOODS/VIMOS spectroscopic campaign. In Table 5 we list 12 new (not yet published) redshifts, either unknown before or improving previous estimates, obtained from the last 8 VIMOS masks released in this paper. Spectra and finding charts of these sources can be found in the Appendix C.
| GOODS_ID | VIMOS_ID | RA | DEC | XID | z | Q | Comments | |
| (1) | (2) | (3) | (4) | (5) | (6) | (7) | (8) | (9) |
| J033143.17-274131.0 | GOODS_LRb_002_1_q2_33_1 | 52.929871 | -27.691935 | - | 135 | 2.9981 | C | Ly(em),CIV(em) |
| J033146.45-274123.6 | GOODS_LRb_002_1_q2_44_1 | 52.943559 | -27.689879 | - | 160 | 0.6646 | B | OII |
| J033155.33-274313.6 | GOODS_LRb_002_1_q2_61_1 | 52.980564 | -27.720448 | - | 225 | B | MgII,FeII | |
| J033214.98-274225.0 | GOODS_LRb_002_1_q1_6_1 | 53.062400 | -27.706952 | 145 | 340 | B | Ly(abs),OI,CII,AlIII | |
| J033216.13-275644.0 | GOODS_LRb_002_1_q3_65_1 | 53.067204 | -27.945558 | 157 | 344 | A | Ly(em),SiIV,CIV (BLAGN) | |
| J033218.25-275224.9 | GOODS_MR_dec06_2_q2_19_1 | 53.076059 | -27.873578 | 175 | - | 0.7396 | A | OII,H,OIII |
| J033220.05-274447.3 | GOODS_LRb_002_1_q1_8_1 | 53.083537 | -27.746460 | 188 | 357 | B | CIV,CIII] (BLAGN) | |
| J033225.69-273941.2 | GOODS_LRb_dec06_3_q1_2_1 | 53.107044 | -27.661458 | - | 370 | 0.0010 | A | Star |
| J033244.61-274835.9 | GOODS_LRb_002_1_q4_66_1 | 53.185862 | -27.809984 | 372 | - | A | Ly(em),OI,CIV,FeII | |
| J033250.25-275251.9 | GOODS_MR_dec06_3_q3_2_2 | 53.209362 | -27.881094 | 402 | 480 | 3.4742 | B | Ly(em) |
| J033304.81-274731.7 | GOODS_LRb_dec06_1_q4_69_1 | 53.270059 | -27.792149 | 445 | - | 2.0265 | A | Ly(em),CIV,HeII,CIII] (BLAGN) |
| J033306.80-274626.6 | GOODS_LRb_dec06_1_q4_79_2 | 53.278332 | -27.774065 | - | 571 | 1.7048 | A | SiIV,SiII,CIV,FeII,AlII |
∗ Redshift more reliable compared to previously published estimates.
a Redshift more reliable then the second available measurement:
GOODS_LRb_dec06_1_q2_15_2 flag C.
b Redshift resulting from average of two measurements:
GOODS_LRb_002_1_q3_65_1 flag A and
GOODS_LRb_dec06_1_q3_16_1 flag A.
6 Conclusions
After the completion of the two complementary ESO/GOODS spectroscopic campaigns carried out with FORS2 (Vanzella et al. 2005, 2006, 2008) and VIMOS (P09 and this work), a very large sample of galaxies in the CDFS has been spectroscopically targeted. In this paper we presented the final data release, including also data from the previous release (P09), of the GOODS/VIMOS spectroscopic campaign, which was organized in two separated campaign: one using the LR-Blue grism and one using the MR grism.
The main outcome for the LR-Blue campaign can be summarized as follows:
-
•
a total of 3634 spectra has been extracted, providing 2242 redshift measurements with a typical (). We obtained a redshift determination for 2040 out of the 3271 individual targets observed. We assigned a quality flag to the redshift measurements, which provides an estimate of their reliability. The reliability of VIMOS LR-Blue redshifts with quality flag A, B, and C is estimated to be approximately , , and confidence level, respectively. The number of redshifts determinations above the c.l. (i.e. flag A+B) amounts to 1395.
For the MR campaign the main results can be summarized as follows:
-
•
a total of 1418 spectra has been extracted, providing 976 redshift measurements with a typical (). We obtained a redshift determination for 882 out of the 1294 individual targets observed. VIMOS MR quality flag-A, -B, and -C redshifts are estimated to be reliable at approximately , , and confidence level, respectively.
We complemented our VIMOS spectroscopic catalog with all existing spectroscopic redshifts publicly available in the CDFS and obtained a redshift master catalog with 7332 entries. We used good-quality redshifts (c.l. ) to investigate the spatial distribution of galaxies in 16 peaks of the redshift distribution, tracing large scale structures out to .
Stacked spectra of LBGs were produced in a few bins of Ly- EW. We found evidence for a lack of bright objects with high EW of the Ly-, which confirms results based on different samples of Ly- emitters and LBGs at (e.g. Shapley et al. 2003; Ajiki et al. 2003; Ando et al. 2006, 2007; Tapken et al. 2007; Verhamme et al. 2008; Vanzella et al. 2009; Pentericci et al. 2009).
Additionally, we obtained new redshifts for 12 X-ray sources of the CDFS and ECDFS. These sources also appear in the new catalog of X-ray sources detected in the ECDFS, which includes the identification of optical and near-IR counterparts (Silverman et al., in preparation).
The reduced spectra and the redshift catalogs are released to the community and can be retrieved in electronic form at http://archive.eso.org/cms/eso-data/data-packages. These data, in combination with the other spectroscopic campaigns in the GOODS-S field, represent an essential contribution to achieve the scientific goals of GOODS, providing the lookback time across which the evolution of galaxy masses, morphologies, clustering, and star formation can be traced.
Acknowledgements.
We acknowledge the ESO staff in Paranal and Garching for the help in the development of this program (ESO program 171.A-3045 The Great Observatories Origins Deep Survey: ESO Public Observations of the SIRTF Legacy/HST Treasury/Chandra Deep Field South.). We wish to thank Marcella Brusa for many helpful suggestions and Remco Slijkhuis and Joerg Retzlaff for their work on the GOODS/VIMOS relesase. We thank the anonymous referee for the valuable comments and suggestions.References
- Ajiki et al. (2003) Ajiki, M., Taniguchi, Y., Fujita, S. S., et al. 2003, AJ, 126, 2091
- Ando et al. (2006) Ando, M., Ohta, K., Iwata, I., et al. 2006, ApJ, 645, L9
- Ando et al. (2007) Ando, M., Ohta, K., Iwata, I., et al. 2007, PASJ, 59, 717
- Bruzual & Charlot (2003) Bruzual, G. & Charlot, S. 2003, MNRAS, 344, 1000
- Bunker et al. (2003) Bunker, A. J., Stanway, E. R., Ellis, R. S., McMahon, R. G., & McCarthy, P. J. 2003, MNRAS, 342, L47
- Cimatti et al. (2002) Cimatti, A., Mignoli, M., Daddi, E., et al. 2002, A&A, 392, 395
- Cohen et al. (1999) Cohen, J. G., Blandford, R., Hogg, D. W., Pahre, M. A., & Shopbell, P. L. 1999, ApJ, 512, 30
- Cristiani et al. (2000) Cristiani, S., Appenzeller, I., Arnouts, S., et al. 2000, A&A, 359, 489
- Croom et al. (2001) Croom, S. M., Warren, S. J., & Glazebrook, K. 2001, MNRAS, 328, 150
- Daddi et al. (2004) Daddi, E., Cimatti, A., Renzini, A., et al. 2004, ApJ, 617, 746
- Dickinson et al. (2003) Dickinson, M., Giavalisco, M., & The Goods Team. 2003, in The Mass of Galaxies at Low and High Redshift, ed. R. Bender & A. Renzini, 324–+
- Dickinson et al. (2004) Dickinson, M., Stern, D., Giavalisco, M., et al. 2004, ApJ, 600, L99
- Giacconi et al. (2002) Giacconi, R., Zirm, A., Wang, J., et al. 2002, ApJS, 139, 369
- Giavalisco et al. (2004) Giavalisco, M., Ferguson, H. C., Koekemoer, A. M., et al. 2004, ApJ, 600, L93
- Gilli et al. (2003) Gilli, R., Cimatti, A., Daddi, E., et al. 2003, ApJ, 592, 721
- Grazian et al. (2006) Grazian, A., Fontana, A., de Santis, C., et al. 2006, A&A, 449, 951
- Kang & Im (2009) Kang, E. & Im, M. 2009, ApJ, 691, L33
- Le Fèvre et al. (2005) Le Fèvre, O., Vettolani, G., Garilli, B., et al. 2005, A&A, 439, 845
- LeFevre et al. (2003) LeFevre, O., Saisse, M., Mancini, D., et al. 2003, in Society of Photo-Optical Instrumentation Engineers (SPIE) Conference Series, Vol. 4841, Society of Photo-Optical Instrumentation Engineers (SPIE) Conference Series, ed. M. Iye & A. F. M. Moorwood, 1670–1681
- Lehmer et al. (2005) Lehmer, B. D., Brandt, W. N., Alexander, D. M., et al. 2005, ApJS, 161, 21
- Luo et al. (2008) Luo, B., Bauer, F. E., Brandt, W. N., et al. 2008, ApJS, 179, 19
- Mignoli et al. (2005) Mignoli, M., Cimatti, A., Zamorani, G., et al. 2005, A&A, 437, 883
- Nonino et al. (2009) Nonino, M., Dickinson, M., Rosati, P., et al. 2009, ApJS, 183, 244
- Pentericci et al. (2009) Pentericci, L., Grazian, A., Fontana, A., et al. 2009, A&A, 494, 553
- Pentericci et al. (2007) Pentericci, L., Grazian, A., Fontana, A., et al. 2007, A&A, 471, 433
- Popesso et al. (2009) Popesso, P., Dickinson, M., Nonino, M., et al. 2009, A&A, 494, 443
- Ravikumar et al. (2007) Ravikumar, C. D., Puech, M., Flores, H., et al. 2007, A&A, 465, 1099
- Renzini et al. (2003) Renzini, A., Cesarsky, C., Cristiani, S., et al. 2003, in The Mass of Galaxies at Low and High Redshift, ed. R. Bender & A. Renzini, 332–+
- Scodeggio et al. (2005) Scodeggio, M., Franzetti, P., Garilli, B., et al. 2005, PASP, 117, 1284
- Shapley et al. (2003) Shapley, A. E., Steidel, C. C., Pettini, M., & Adelberger, K. L. 2003, ApJ, 588, 65
- Stanway et al. (2004) Stanway, E. R., Bunker, A. J., McMahon, R. G., et al. 2004, ApJ, 607, 704
- Strolger et al. (2004) Strolger, L.-G., Riess, A. G., Dahlen, T., et al. 2004, ApJ, 613, 200
- Szokoly et al. (2004) Szokoly, G. P., Bergeron, J., Hasinger, G., et al. 2004, ApJS, 155, 271
- Tapken et al. (2007) Tapken, C., Appenzeller, I., Noll, S., et al. 2007, A&A, 467, 63
- van der Wel et al. (2004) van der Wel, A., Franx, M., van Dokkum, P. G., & Rix, H.-W. 2004, ApJ, 601, L5
- Vanzella et al. (2008) Vanzella, E., Cristiani, S., Dickinson, M., et al. 2008, A&A, 478, 83
- Vanzella et al. (2005) Vanzella, E., Cristiani, S., Dickinson, M., et al. 2005, A&A, 434, 53
- Vanzella et al. (2006) Vanzella, E., Cristiani, S., Dickinson, M., et al. 2006, A&A, 454, 423
- Vanzella et al. (2009) Vanzella, E., Giavalisco, M., Dickinson, M., et al. 2009, ApJ, 695, 1163
- Verhamme et al. (2008) Verhamme, A., Schaerer, D., Atek, H., & Tapken, C. 2008, A&A, 491, 89
Appendix A Corrections to previous release
We revised some of the redshifts from the first release of the GOODS/VIMOS survey for objects that were observed more than once in the GOODS/VIMOS survey or in other surveys. After comparing their spectra, 7 redshift determinations were modified as follows:
-
•
GOODS_LRb_001_1_q1_51_1 at (flag A) in the previous release, was observed also with FORS2 (GDS J033226.67-274013.4). The low-S/N UV absorption lines were misclassified in the VIMOS spectrum. Instead, thanks to the comparison with the FORS2 spectrum, CIII] in emission could be identified. The new redshift obtained, , with quality flag B, is in agreement with the FORS2 measurement (, flag A).
-
•
GOODS_LRb_003_new_q1_61_1 at (flag A) in the previous release. A possibly broad CIII] emission line was previously identified as [OII]. This object was also observed by Silverman et al. (in preparation), where the measured redshift is . Our new estimate of the redshift based on CIII] and FeII lines is in agreement with the more recent measurement. We find with quality flag B.
-
•
GOODS_LRb_003_new_q3_11_1 at (flag B) in the previous release. This object was also observed in another mask (GOODS_LRb_003_new_2_q3_30_1, , flag B). Both estimates are based on the detection of a Ly- in emission. However, we noticed that the former measurement required a slight adjustment (i.e. the Ly- was correctly identified, but slightly misaligned). The new resulting redshift, , with quality flag B, is in better agreement with the second VIMOS measurement.
-
•
GOODS_LRb_003_new_1_q3_68_1 at , flag C based on the identification of [OII]. The redshift is correct and it is confermed by a second observation in a MR mask (GOODS_MR_new_1_d_q2_32_1 at , flag A). We simply upgraded the quality flag from C to B in this case.
-
•
GOODS_LRb_003_new_2_q1_42_1 at (flag B) in the previous release. The broad MgII emission line was misclassified as Ly-. This object was also observed in one of the new reduced masks (GOODS_LRb_dec06_3_q1_46_2, , flag A). Two spectral features are clearly identified: a broad emission line from MgII and [OII]. Therefore, the new redshift assigned is with quality flag A.
-
•
GOODS_MR_new_1_d_q3_2_1 at (flag B) in the previous release. Two spectral features were misclassified: [OIII] and H. Thanks to the comparison with a second observation of this object (GOODS_MR_001_q4_3_1 , flag A), we identified [OII] and MgII instead. The new redshift estimate is with quality flag B.
The following redshifts were also revised:
-
•
GOODS_LRb_001_1_q2_66_1 at (flag B) in the previous release. The broad MgII emission line was misclassified as [OII]. After revising the spectrum we could identify some typical AGN features (e.g. a broad MgII emission line and broad Fe bump at 2960 ) plus [OII] and Ca H and K. The new redshift obtained is (flag A).
-
•
GOODS_LRb_001_1_q3_5_3 at (flag B) in the previous release. The spectrum shows only one visible emission line at , which was previously interpreted as [OII]. For this object we find more likely the identification as Ly- in emission, which gives a new tentative redshift of (flag C).
-
•
GOODS_LRb_001_q4_44_1 and GOODS_LRb_003_new_q4_28_1 at (flag B) in the previous release. We reviewed the redshifts of the two spectra for this object, which were based on the identification of two very broad emission lines (i.e. CIV and CIII]). In addition, we identified several absorption lines (e.g. FeII, AlIII) that helped further calibrating the redshifts. The new measurements are (flag A) and (flag A) for GOODS_LRb_001_q4_44_1 and GOODS_LRb_003_new_q4_28_1, respectively.
-
•
GOODS_LRb_003_new_1_q2_46_2 is the same object as GOODS_LRb_001_1_q2_66_1 (see above). The new redshift measurement is (flag A).
-
•
GOODS_LRb_003_new_1_q4_63_2 at (flag C) in the previous release. The spectrum is red, but quite noisy and may resemble that of an elliptical galaxy. However, after the inspection of the WFI -image and the ACS -image of this object, we found that a more likely explanation might be given in terms of a star. Therefore, we assign and flag B to this object.
-
•
GOODS_MR_new_2_b_q4_15_1 at (flag C) in the previous release. We could identify Ca H and K, Fe I and possibly [OII]. The new redshift assigned to this object is with quality flag B.
Appendix B Large scale structure
Table 6 and Fig. 15–17 show the results of the analysis of the spatial distribution of the 14 confirmed density peaks, plus three additional tentative structures at , , and , observed in the master catalog of redshifts of the CDFS, described in Sect. 5.1.
| [km/s] | XID | |||
|---|---|---|---|---|
| (1) | (2) | (3) | (4) | (5) |
| 0.126 | 906 | 73 | – | |
| 0.215 | 443 | 61 | – | |
| 0.338 | 1724 | 76 | – | |
| 0.530 | 2190 | 193 | – | |
| 0.672 | 1758 | 306 | 645 | |
| 0.735 | 565 | 257 | 566, 594 | |
| 0.973 | 2936 | 181 | 249 | |
| 1.039 | 859 | 110 | – | |
| 1.095 | 1536 | 129 | – | |
| 1.221 | 391 | 65 | – | |
| 1.296 | 261 | 35 | – | |
| 1.611 | 497 | 36 | – | |
| 2.318 | 2102 | 108 | – | |
| 2.566 | 1435 | 72 | – | |
| 2.811 | 575 | 23 | – | |
| 3.471 | 984 | 29 | – | |
| 3.702 | 360 | 11 | – |
Appendix C Spectra of X-ray sources with new redshift determinations
In Fig. 18, 19, and 20 we show 12 VIMOS spectra of X-ray sources with new redshift determinations (i.e. either unknown before or improving previous estimates), obtained from the last 8 VIMOS masks released in this paper. Together with each spectrum we provide a finding chart with the position of the corresponding X-ray sources. These sources also appear in the new catalog of X-ray sources detected in the ECDFS, which includes the identification of optical and near-IR counterparts (Silverman et al., in preparation).