Properties and short-time evolution of nearby galaxies
Abstract:
We analyze the results of processing of data of observations which had been carried out with the VLBA during 10 last years. All the data have been retrieved from archive of the National Radio Astronomy Observatory (USA NRAO, Socorro, New Mexico). Particularly, we examine data of VLBA observational sessions titled BK068, BL111, BL137, BL149, and BD086. Objects of our interest are near galaxies with z ¡ 0.02. The radio maps of compact structure around the active galactic nuclei (AGN) reconstructed for two such galaxies (NGC315 and 3C274) in U frequency band (15 GHz) are presented. Some parameters of these sources are shown in Table 1. We have to perform the careful amplitude and phase calibration for all the data. Particularly, a correction of the delay caused by the Earth atmosphere has been made because it is necessary in this frequency range. Bright quasars close to the target sources (for instance, J0136+4751 and 3C279 correspondingly) are used as atmosphere calibrators. Secondly, the Multi Frequency Synthesis (MFS) method (Likhachev, 2004) is used for final maps reconstruction as well as for estimation of spectral index values of core and jet of AGN of both objects. As a result, we can make some conclusions about the milliarcsecond structure of central regions of sources thanks to the using of these two methods of the VLBA data processing. Moreover, we can reveal some changes of this structure in 1999 - 2009, and estimate roughly the velocities and acceleration/deceleration values for brightest components of the nuclei of NGC315 and 3C274. Any polarization phenomena are not taken into account. We present results of processing of data of LL polarization for all the observational sessions
1 Results of data processing
The software project Astro Space Locator (ASL for Windows) (Chuprikov, 2002) has been used to process all the data. The data processing consists of the following stages :
Amplitude calibration of all the data using GC and TY tables
Single band fringe fitting (the primary phase calibration) of all the data. Estimation of the optimum value of solution interval
Averaging of all the data over each frequency band
Multi band fringe fitting of the atmosphere calibrator data. Estimation of gain values for every frequency and every time interval
Application of gains, compensation of atmosphere delay for all the data
Self-calibration
Imaging
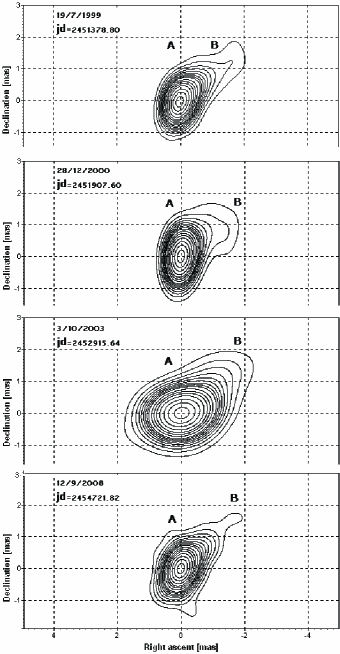
Figure 1 demonstrates the compact structure of nuclei of 3C274 and NGC315 reconstructed according to the scheme above. Evolution of this structure is obvious for both sources. Table 2 and Table 3 show the changes of coordinates of components. These changes have the following properties :
-
1.
For 3C274
Image consists of 3 components (A, B, and C)
There is not any visible proper motion of the brightest component (component A)
Velocity value of the B component is minimal between February 6, 2003 and February 5, 2007. This value is equal approximately to cm/s , and it increases after February 5, 2007 up to cm/s
Velocity value of the C component also has a minimum between February 6, 2003 and February 5, 2007. This minimum value is equal to approximately cm/s
Again, this value increases after February 5, 2007 up to cm/s -
2.
For NGC315
Image consists of 2 components (A, and B)
There is not any visible proper motion of the brightest component (component A)
Velocity of the B component decreases between July 19, 1999 and September 12, 2008 from cm/s down to cm/s
| IAU | Common | z | Distance | 1 mas corresponds to |
|---|---|---|---|---|
| Name | Name | [Mpc] | linear size [cm] | |
| J1230+1223 | 3C274 | 0.004 | 14.7 | |
| J0057+3021 | NGC315 | 0.017 | 62.5 |
2 Conclusions
We assumed that using the procedure of atmosphere delay calibration can essentially
improve the image of source in the 2 centimetre wavelength range. The monitoring of near galaxies
radio structure evolution for the period of approximately 10 years is possible thanks to such application
of such procedure to VLBA data. Analysis of evolution of structure of two galaxies (3C274, and NGC315)
demonstrates absence of superluminal motion of any component in both sources. The maximum value of component
velocity is equal approximately to cm/s (or ).
Thus, we could to propose that strong synchrotron self-absorption is significant in both sources.
Moreover, spectral index maps show a highly inverted core (spectral index is positive in core of both
sources). This could be another indicator of self-absorption.
All the results presented in this paper are preliminary. It is necessary to perform similar monitoring
of near galaxies in other frequency ranges to make final conclusions.
Procedures and techologies used during the VLBA data processing also could be very useful for
processing of data of future Space VLBI mission titled RADIOASTRON.
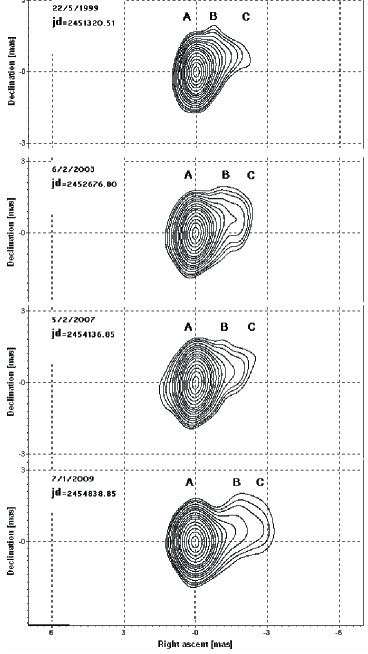
| Date | JD | VLBA | RA of | DEC of | RA of | DEC of | RA of | DEC of |
|---|---|---|---|---|---|---|---|---|
| 2450000 + | Session | A (mas) | A (mas) | B (mas) | B (mas) | C (mas) | C (mas) | |
| 22/05/1999 | 1320.51 | BK068 | 0 | 0 | -0.870 | 0.61 | -2.32 | 0.64 |
| 06/02/2003 | 2676.80 | BL111 | 0 | 0 | -1.552 | 0.59 | -2.52 | 1.01 |
| 05/02/2007 | 4136.85 | BL137 | 0 | 0 | -1.637 | 0.57 | -2.40 | 0.68 |
| 07/01/2009 | 4838.85 | BL149 | 0 | 0 | -1.900 | 0.40 | -3.35 | 0.98 |
| Date | JD | VLBA | RA of | DEC of | RA of | DEC of |
|---|---|---|---|---|---|---|
| 2450000 + | Session | A (mas) | A (mas) | B (mas) | B (mas) | |
| 19/07/1999 | 1378.97 | BK068 | 0 | 0 | -1.618 | 1.196 |
| 28/12/2000 | 1907.38 | BK068 | 0 | 0 | -1.437 | 0.930 |
| 03/10/2003 | 2915.65 | BD086 | 0 | 0 | -1.525 | 1.486 |
| 12/09/2008 | 4721.82 | BL149 | 0 | 0 | -1.500 | 1.500 |
References
- [1] A. Chuprikov 2002, Proc. of the 6th European VLBI Network Symposium, June 25th-28th 2002, Bonn, Germany, 27
- [2] E. B. Fomalont 2000, APJSS, 131, 95
- [3] S. Likhachev 2004, Proc. of the 7th European VLBI Network Symposium on New Developments in VLBI Science and technology, October 12-15 2004, Toledo, Spain, 325