High-energy gamma-ray observations of Geminga with the Fermi Large Area Telescope
Abstract
Geminga is the second brightest persistent source in the GeV -ray sky. Discovered in 1975 by SAS-2 mission, it was identified as a pulsar only in the 90s, when ROSAT detected the 237 ms X-ray periodicity, that was later also found by EGRET in rays. Even though Geminga has been one of the most intensively studied isolated neutron star during the last 30 years, its interest remains intact especially at -ray energies, where instruments like the Large Area Telescope (LAT) aboard the Fermi mission will provide an unprecedented view of this pulsars. We will report on the preliminary results obtained on the analysis of the first year of observations. We have been able to do precise timing of Geminga using solely rays, producing a timing solution and allowing a deep study of the evolution of the light curve with energy. We have also measured and studied the high-energy cutoff in the phase-averaged spectrum and produced a detailed study of the spectral evolution with phase.
I INTRODUCTION
In the last 30 years Geminga was for a long time the first and only radio-quiet -ray pulsar detected in the sky. After launch it is no more alone, for other -ray pulsars have been discovered without a radio or X-ray counterpart so far. Since its discovery Geminga has been widely and deeply studied, but nowdays its importance is increased since it is the harbinger of a population of radio-quiet neutron stars.
Geminga was discovered in 1975 as a -ray source by SAS-2 fichtel75 but only in 1992 it was identified as a pulsar object thanks to the ROSAT discovery of a periodic X-rays emission from this source
halpern92 . This has allowed a successful search for periodicity in
high-energy rays with EGRET bertsch92 . Recent parallax and proper motion
measurements confirm the earlier results, yielding a distance of 250 pc
and a proper motion of 178.2 0.4 mas/yr faherty07 .
Geminga has a period of 237 ms and a period
derivative of 1.1 10-14 s s-1; these parameters imply that
it is an old -ray with a characteristic age of 3
105 yr and spin-down luminosity = 3.26
1034 erg s-1.
The light curve detected by EGRET showed two peaks separated by almost half rotation mayer94 ; fierro98 . The detected spectrum was compatible with a simple power law with a photon index of even if there was evidence of a cutoff at 2 GeV, but the limited EGRET statistics did not allow a measurement.
Deep X-ray observations allowed XMM-Newton and Chandra to map
the neutron star surface as it rotates, bringing into view
different regions contributing different spectral components
caraveo04 ; deluca05 ; jackson05 as well as an arcmin-scale bow-shock feature trailing the
pulsar’s motion caraveo03 ; deluca06 . Such
a non-thermal diffuse X-ray emission surrounding the pulsar is
produced by high-energy ( 1014 eV) electrons escaping from the pulsar magnetosphere and interacting with
the interstellar magnetic field.
Fermi is an excellent instrument for high energy -ray
pulsar studies, thanks to its outstanding timing capability, really good pointing and energy resolution.
In this proceeding we present the analysis of the Geminga pulsar based on the statistics collected during the first year of operations of the Fermi mission. More results on the Geminga observations by can be found in abdo09a .
II GAMMA-RAY OBSERVATIONS
Fermi-LAT is a pair conversion telescope sensitive to rays from 20MeV to 300GeV. It is composed by a silicon tracker, a CsI hodoscopic calorimeter and an Anticoincidence detector to reject the charged particles background atwood09 . The LAT has a large effective area (8000 cm2 on-axis) and thanks to its large field of view ( 2.4 sr), it covers the entire sky every 2 orbits ( 3 h). These characteristic lead to an increment of a factor 30 in sensitivity with respect to its predecessor EGRET. The data used are of particular importance since cover the full first year of the mission. The collected data range from Launch and Early Operations (LEO) (covering two months after 2008 June 25, when the LAT was operated in pointing and scanning mode for tuning purposes) to the first year of nominal operations (namely 2009 June 15). Only for the spectral analysis we selected a subsample of data, covering observations in scanning mode under nominal configuration from 2008 August 4 to 2009 June 15. We excluded observations when Geminga was viewed at zenith angles 105∘ to the instrument axis where Earth’s albedo rays give excessive background contamination. We also have taken care of excluding time intervals when the Region Of Interest (ROI) intersects the Earth’s albedo region.
III RESULTS
III.1 Pulsed profile
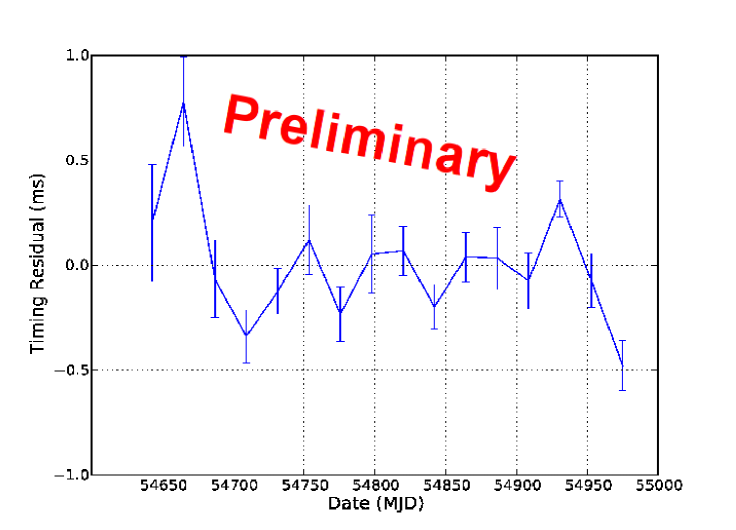
The timing solution used to build the light curve has been obtained using only the LAT data, thanks to its excellent timing accuracy (better than 1s). We have used TEMPO2 hobbs06 to generate a pulse profile and then we have fitted the results with the timing solution model: the residuals have an RMS of 251s, as shown in Figure 1.
Like all the pair conversion telescopes also the Fermi-LAT has a Point Spread Function (PSF) that strongly depend with energy. We have chosen to select photons coming from Geminga with an angle max[1.6∘-3∘ log10(EGeV), 1.3∘], that maximize the pulsed signal over the background.
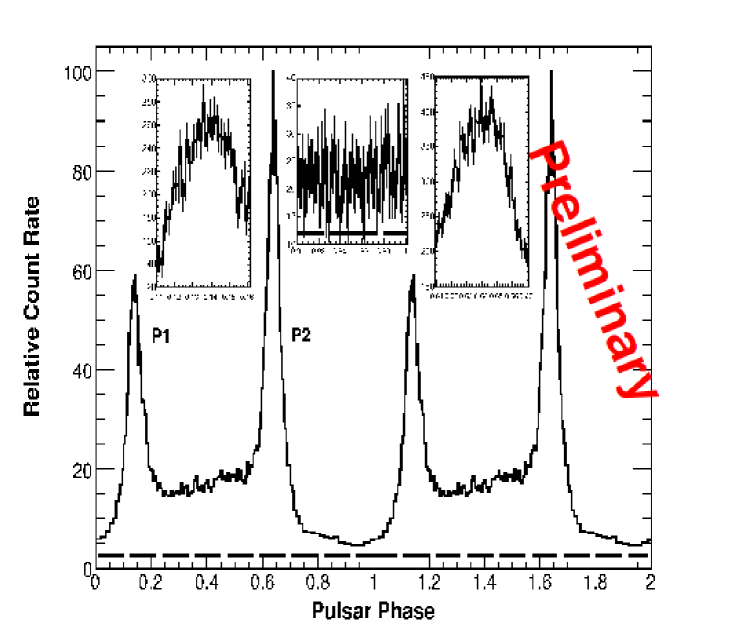
The light curve is shown in Figure 2. It has been plotted using a variable-width phase bins, each one containing 400 events, to enhance the fine structure. The photon flux in each phase interval, i.e. the counts divided by phase width, have thus a 1 Poisson statistical error of 5. The dashed line represents the contribution of the diffuse background, as estimated by selecting photons in the phase interval = 0.9–1.0 from an annular region within 2∘ and 3∘ from the source. The total number of pulsed photons is and the backgorund photons are . Both the peaks have been fitted with an asymmetric Lorentzian function and we obtain the maximum for peak 1 at = 0.141 0.002 and for peak 2 at = 0.638 0.003: the separation is 0.4970.004.
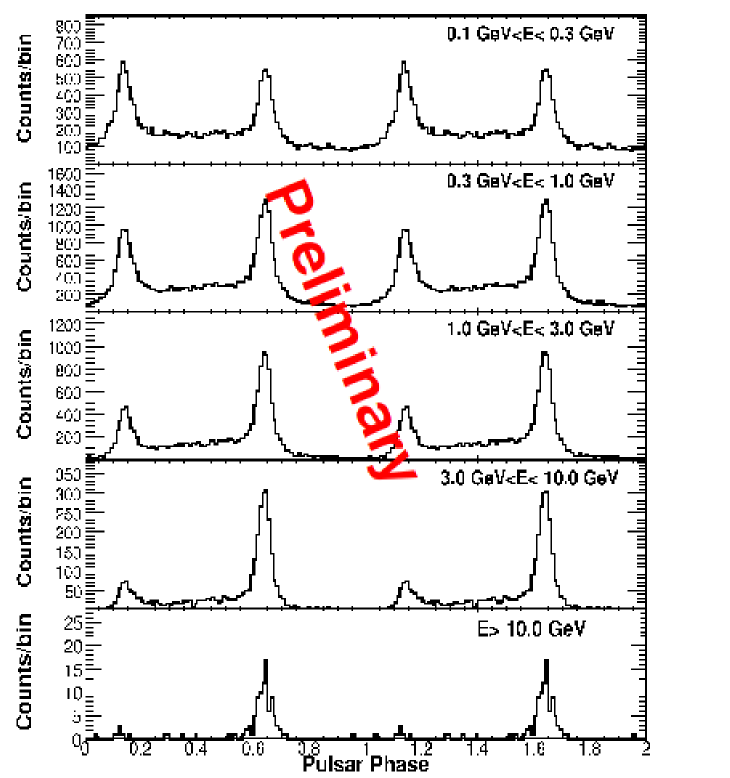
We have also built light curves in different energy bands (Figure 3) and fitted the peaks in each of them. The first trend that can be seen is the first peak is decreasing at higher energies, confirming a decreasing trend in the ratio P1/P2 as observed in Crab, Vela and PSR B1951+32 -ray pulsars by EGRET thompson04 and now confirmed for many pulsars, including the Vela abdo09a and the Crab pulsars abdo09c by Fermi LAT. We observed pulsed photons up to 18 GeV.
Moreover, both peaks narrow with increasing energy. The decreasing trend in pulse width of P1 and P2 is nearly identical. The emission of the “first interpeak” between P1 and P2 is significantly detected up to 10 GeV, emission in the “second interpeak” region (between 0.9 and 1.0), not detected before, is clearly present at low energies but vanishes above 2 GeV.
III.2 Energy Spectrum and phase-resolved spectroscopy
The spectral analysis is one of the key and most powerful analysis for pulsars. To perform the spectral analysis we have used the maximum-likelihood estimator gtlike, that is part of the standard Fermi Science Tools provided by the FSSC111http://fermi.gsfc.nasa.gov/ssc/data/analysis/scitools/overview.html. The fit was performed using a region of the sky 15∘ around the pulsar position between 0.1 and 100 GeV.
To properly fit the source we have taken into account all the nearby source in a 20∘ around Geminga, the galactic diffuse emission based on GALPROP model strong04a and the isotropic residuals emission based on a model derived from a fit of LAT data at high latitude.
The function that we have used to fit the spectral emission is a power law with exponential cutoff in the form:
| (1) |
The fit gives the following spectral parameters = (1.19 0.01 0.08) 10-6 cm-2 s-1 GeV-1, = (1.30 0.01 0.05) and = (2.47 0.04 0.19) GeV. First error is statistical and the second is systematic. The integral flux above 0.1 GeV is (4.15 0.02 0.39) 10-6
cm-2 s-1 and the corresponding energy flux is (2.57 0.01 0.32) 10-3 MeV cm-2 s-1.
We have also fitted the data with a simple power law and with a power law with a super exponential cutoff with the super exponent fixed at 2, and we have rejected both at more then 5 level.
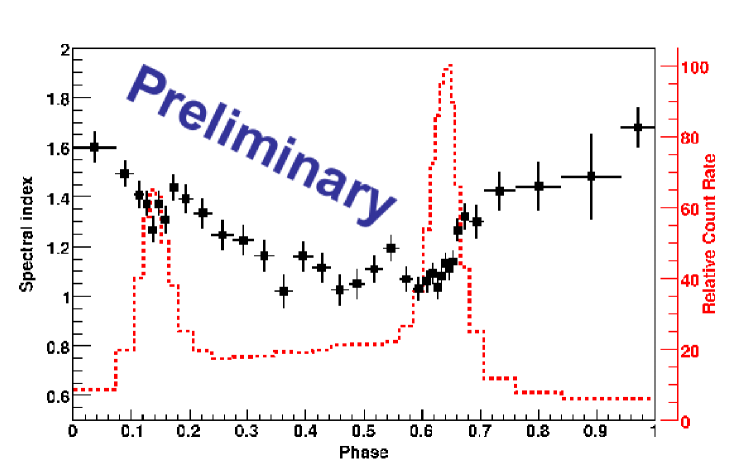
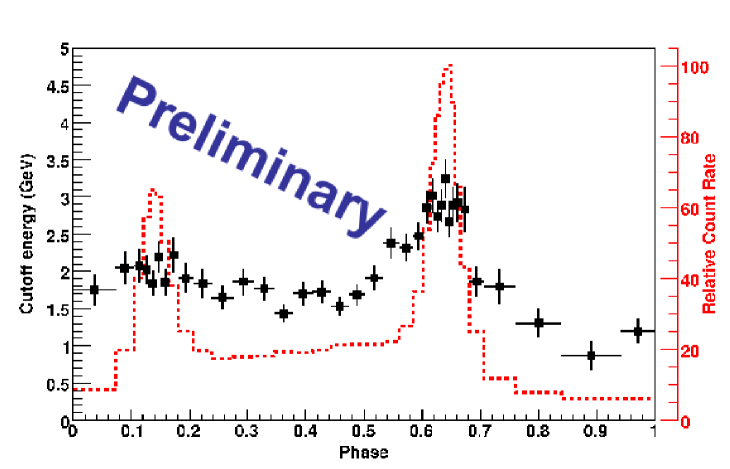
Thanks to the huge number of photons collected we were able also to perform phase-resolved spectroscopy. We divided the period in 36 phase bins, each containing 2000 counts, according to the energy-dependent cut presented in Sec. III.1. We have found that the emission is always well described by a power law with exponential cutoff, even if with different spectral parameters. This means that the emission in the two peaks is different, as expected from the study of the light curve with energies, and that the pulsar emission is clearly visible in both the interpulse and in the off-pulse region. The phase evolution of the photon index and the cutoff energy (Figure 4) show a clear variation across the whole rotation. One of the main features is that the “second interpeak” in the range 0.9–1.0 shows an exponential cutoff, indicating that the pulsar emission extends over the whole rotation.
IV DISCUSSION
One of the key feature of Geminga is the absence of radio emission, that clearly favor the outer magnetospheric emission models.
The current evidence against low-altitude emission in -ray pulsars abdo09a can also be supplemented by constraints on a separate physical origin. The maximum energy of the pulsed photons observed must lie below the –B pair production mechanism threshold, providing a lower bound to the altitude of the -ray emission . According to baring04 , the
highest energy of pulsed photons observed from Geminga (E18 GeV), points toward a limit of stellar radii, a value clearly precluding emission very near the stellar surface, adding to the advocacy for a slot gap or outer gap acceleration locale for the emission in this pulsar.
Following the atlas of -ray light curves compiled by watters09 , we can use Geminga’s light curve to estimate, for each model, the star’s emission parameters, namely the Earth viewing angle with respect to the neutron star spin axis, and the inclination angle between the star’s magnetic and rotation axes. For Slot Gap/Two Pole Caustic model muslimov04 ; dyks03 we obtain in the range of degrees and in the range degrees, while for Outer Gap romani96 models we obtain in the range of degrees and degrees.
The total luminosity radiated by the pulsar is then given by where is the observed phase-averaged energy flux over GeV and pc is the pulsar distance faherty07 . The beaming factor can be derived from watters09 and points to a value of for Slot Gap and for Outer Gap. The estimated averaged luminosity is then =3.110 erg s-1, yielding a -ray efficiency = 0.15 (/100pc)2. Altough the uncertainty in the distance limit the conclusions, the phase-resolved spectral variation observed can be predicted by caustics models.
V SUMMARY
We presented the analysis of Geminga based on data collected during the first year of operations of . We were able to obtain a timing solution based only on rays and to produce a high-detailed light curve, that shows clear energy-dependent variation of the profile. Although the phase-averaged spectrum is consistent with a power law with exponential cut-off, the phase-resolved analysis showed a much richer picture of different spectral components intervening at different rotational phases. The phase-resolved analysis has also allowed the detection of the “second interpeak” emission indicating a pulsar emission extending over all phases. Our results favor the outer magnetospheric origin for the -ray emission and future improvements in estimating the distance of Geminga will help to better strenghten the conclusions and constraining outer magnetospheric models.
Acknowledgements.
The Fermi LAT Collaboration acknowledges generous ongoing support from a number of agencies and institutes that have supported both the development and the operation of the LAT as well as scientific data analysis. These include the National Aeronautics and Space Administration and the Department of Energy in the United States, the Commissariat à l’Energie Atomique and the Centre National de la Recherche Scientifique / Institut National de Physique Nucléaire et de Physique des Particules in France, the Agenzia Spaziale Italiana and the Istituto Nazionale di Fisica Nucleare in Italy, the Ministry of Education, Culture, Sports, Science and Technology (MEXT), High Energy Accelerator Research Organization (KEK) and Japan Aerospace Exploration Agency (JAXA) in Japan, and the K. A. Wallenberg Foundation, the Swedish Research Council and the Swedish National Space Board in Sweden. Additional support for science analysis during the operations phase is gratefully acknowledged from the Istituto Nazionale di Astrofisica in Italy and the Centre National d’Études Spatiales in France.References
- (1) Abdo, A. A., et al. 2009a, ApJ, submitted (arXiv:0910.1608)
- (2) Abdo, A. A., et al. 2009b, ApJ, submitted (Geminga paper)
- (3) Abdo, A. A., et al. 2009c, ApJ, accepted (arXiv:0911.2412)
- (4) Atwood, W. B., et al. 2009, ApJ, 697, 1071
- (5) Baring, M. G. 2004, AdSpR, 33, 552
- (6) Bertsch, D. L., et al. 1992, Nature, 357, 306
- (7) Caraveo, P. A., Bignami, G. F., DeLuca, A., Mereghetti, S., Pellizzoni, A., Mignani, R., Tur, A., & Becker, W. 2003, Science, 301, 1345
- (8) Caraveo, P. A., De Luca, A., Mereghetti, S., Pellizzoni, A., & Bignami, G. F. 2004, Science, 305, 376
- (9) Cheng, K. S., Ho, C., Ruderman, M. 1986, ApJ, 300, 500
- (10) De Luca, A., Caraveo, P. A., Mereghetti, S., Negroni, M., & Bignami, G. F. 2005, ApJ, 623, 1051
- (11) de Luca, A., Caraveo, P. A., Mattana, F., Pellizzoni, A., & Bignami, G. F. 2006, A&A, 445, L9
- (12) Dyks, J. and Rudak, B., 2003, ApJ, 598, 1201
- (13) Faherty, J., Walter, F. M., & Anderson, J. 2007, Ap&SS, 308, 225
- (14) Fichtel, C. E., et al. 1975, ApJ, 198, 163
- (15) Fierro, J. M., Michelson, P. F., Nolan, P. L., & Thompson, D. J. 1998, ApJ, 494, 734
- (16) Halpern, J. P., & Holt, S. S. 1992, Nature, 357, 222
- (17) Hobbs, G. B., Edwards, R. T., & Manchester, R. N. 2006, MNRAS, 369, 655
- (18) Jackson, M. S., & Halpern, J. P. 2005, ApJ, 633, 1114
- (19) Mayer-Hasselwander, H. A., et al. 1994, ApJ,421,276
- (20) Muslimov, A. G. and Harding, A. K., ApJ, 588, 430
- (21) Romani, R. W., 1996, ApJ, 470, 469
- (22) Strong, A. W., Moskalenko, I. V., & Reimer, O. 2004, ApJ, 613, 962
- (23) Thompson, D. J. 2004, in Astroph. and Space Sci. 304, Cosmic Gamma-Ray Sources, ed. K. S. Cheng & G. E. Romero (Kluwer: Dordrecht), 149
- (24) Watters, K. P. and Romani, R. W. and Weltevrede, P. and Johnston, S., 2009, ApJ, 695, 1289