The VERITAS Survey of the Cygnus Region of the Galactic Plane
Abstract
The VERITAS IACT observatory has carried out an extensive survey of the Cygnus region between 67 and 82 degrees in galactic longitude and between -1 and 4 degrees in galactic latitude. This region is a natural choice for a Very High Energy (VHE) gamma-ray survey in the Northern Hemisphere, as it contains a substantial number of potential VHE gamma-ray emitters such as supernova remnants, pulsar wind nebulae, high-mass X-ray binaries, and massive star clusters, in addition to a few previously detected VHE gamma-ray sources. It is also home to a number of GeV gamma-ray sources, including no less than four new high-significance sources detected in the first six months of Fermi data. The VERITAS survey, comprising more than 140 hours of observations, reaches an average VHE point-source flux sensitivity of better than 4% of the Crab Nebula flux at energies above 200 GeV. Here we report on preliminary results from this survey, including two source detections, and discuss the prospects for further studies that would exploit the joint coverage provided by VERITAS and Fermi data in this region.
I Introduction
To date, only a few moderate-scale surveys have been performed in gamma rays between and : the HESS scan of the central region of the Galactic Planehess_survey , the much less sensitive HEGRA survey of the quarter of the Galactic Plane between and in galactic longitudehegra , and the VERITAS scan of the Cygnus region under discussion here. However, there is a strong motivation for performing such surveys; an unbiased search of a substantial region of sky is less subject to the experimental and theoretical prejudices that guide most VHE gamma-ray observations, and therefore (as demonstrated by HESS) offers greater scope for serendipitous discoveries. An unbiased search also allows for more quantitative statements to be made about the source population in the region surveyed.
The stereoscopic imaging atmospheric Cherenkov telescope (IACT) array VERITAS has just completed a two-year survey of a 5 by 15 degree portion of the Cygnus region of the Galactic Plane. The Cygnus region was a natural target for survey observations, as it is already known to contain a significant number of potential TeV gamma-ray emitters. In the GeV ( GeV) energy band, it is home to a number of sources or potential sources, including no less than 4 distinct Fermi sources fermibrightsource . Moreover, both Fermi and its predecessor EGRET have detected diffuse emission from this region that is greater in flux than all of the currently resolved sources taken together. Viewed in the energy range between 1TeV-50 TeV, it contains a pair of unidentified TeV sources (MGRO J2031+41 and MGRO 2019+37) detected by the Milagro Gamma Ray Observatory, a water Cherenkov extensive air shower array that is sensitive to TeV sources at a median energy of 20 TeV over the entire sky MGROsurvey , as well as the unidentified source TeV J2032+4130 (first detected by the HEGRA IACT arrayHEGRAtev ), that is spatially coincident with MGRO J2031+41. The exact nature of these sources is currently unknown. There is also a significant catalog of objects detected at other wavelengths, including SNRs, pulsar wind nebulae (PWNe), high-mass x-ray binaries (HMXBs) and massive star clusters, that are considered potential TeV sources.
II Survey Observations
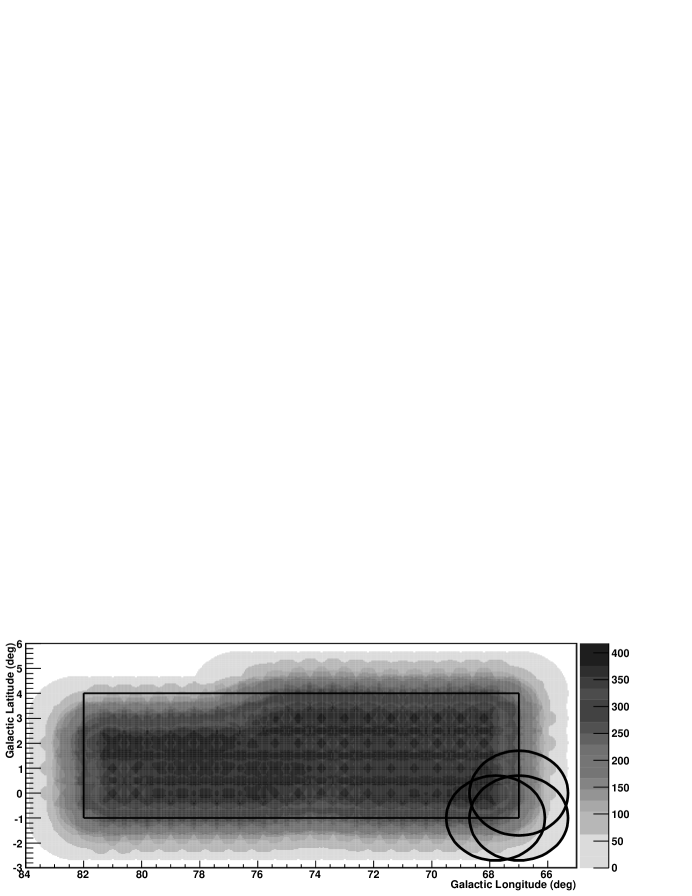
Survey observations, which began in April 2007 and were completed in November 2008, cover the field between galactic longitudes and and galactic latitudes and with a grid of pointed observations. Grid points have separation in galactic longitude and separation in galactic latitude, allowing for substantial overlap in the fields of view for observations at nearby grid points. Approximately one hour of observing time was taken at every grid point (generally within a 1-3 day period), with that hour broken into 20-minute observation periods. Figure 1 shows both a schematic of the survey observation strategy and the acceptance-corrected (“effective”) exposure time for the “base” survey (that is, the survey data taken prior to follow-up observations) over the entire survey field. The base survey achieves a relatively uniform effective exposure of hours. The full survey dataset ( hours of good-quality observation time) has regions of enhanced exposure due to follow-up observations taken in Fall 2008, Spring 2009, and Fall 2009.
Survey data have been quality-selected to remove runs with unstable trigger rates, poor weather conditions, and known hardware problems. Almost all survey data were taken on moon-less nights, with a few percent taken under slight to moderate moonlight conditions. Since survey observations began during the commissioning period for the VERITAS array, data in the base survey were taken in two different configurations. Observations from Spring 2007 were taken with a three-telescope array configuration (including telescopes 1, 2, and 3) and observations from Fall 2007 and Spring and Fall 2008 were taken with the full four-telescope array.
Survey observations were taken over a range of zenith angles between to Observations were scheduled in such a way as to keep the average zenith angle of observations for any survey pointing at , but constraints in terms of available time did not always allow for this. We estimate that of the survey region is covered by observations taken at an average zenith angle of or smaller, another by observations taken at , by observations taken at , and by observations taken at .
II.1 Follow-up Observations
Follow-up data taken in Fall 2008 were also taken with the four-telescope array configuration: observations during this period are a combination of two types of observations: wobble observations at to offsets from points of interest ( fluctuations or locations of reported AGILE or INTEGRAL transients) within the survey region, and additional exposure on survey pointings near a point or region of interest. Further follow-up observations ( hours total) using a wobble strategy were taken in Spring and Fall 2009. Due to a scheduled VERITAS upgrade, data taken in Spring 2009 were taken with a three-telescope array configuration containing telescopes 2, 3, and 4, while data taken in Fall 2009 was taken with the full array in an upgraded configuration, where telescope 1 has been moved to improve the instrument baselines. This upgrade has improved the sensitivity of the array to weak point sources by about vsensitivity .
III Survey Analysis
Given that the H.E.S.S. survey revealed a population of Galactic TeV gamma-ray emitters that was biased towards hard-spectrum, moderately extended sourceshess_survey , and the fact that that the Milagro survey of the Cygnus region MGROsurvey showed sources of significant apparent extent, it was reasonable to expect that some or all of the visible gamma-ray sources in this region would also have relatively hard spectra and significant extension.
In order to optimize the survey’s sensitivity to such sources while not sacrificing too much in the way of sensitivity to softer-spectrum and/or point-like sources, a set of parallel analyses was used. Each analysis is a variation on a common base analysis, optimized for better sensitivity to a particular type of source. In order to limit the number of additional trials factors incurred, the number of parallel analyses was restricted to four. Two were optimized for sources with a Crab-like spectrum—one for point sources and the other for moderately extended () sources—and two more were optimized for hard-spectrum point-like and extended sources, using a reference source with a power-law spectrum and a spectral index of .
The completely common elements of the analysis procedure consist of calibrating and cleaning the Cherenkov images and parameterizing them by second momentshillas . The technique used to stereoscopically reconstruct the shower direction and impact parameter is likewise common to all analyses: however, images used in stereoscopic reconstruction are required to exceed a minimum integrated charge (size) in digital counts (dc), and the value of that requirement is analysis-specific as shown in Table 1. Showers are reconstructed for all events in which at least three telescope images passed quality selection.
| Point Source | Extended Source | |
|---|---|---|
| Standard Source | ||
| Hard Source | ||
Cosmic ray background is rejected using two means. The first is a pair of variables (mean scaled length (MSL) and mean scaled width (MSW) that summarize differences in image shape between gamma ray events and the majority of the cosmic ray background)mslw and are applied prior to generation of photon sky maps. The second is a cut on the square of the angular distance () between a reconstructed shower and the sky position of a potential source that is applied as part of that process. The cuts on mean scaled length and mean scaled width are common to all parallel analyses (, ), while the cut in is analysis-specific as shown in Table 1. The residual cosmic ray background is estimated using the “ring-background” model ring .
IV Survey Detections
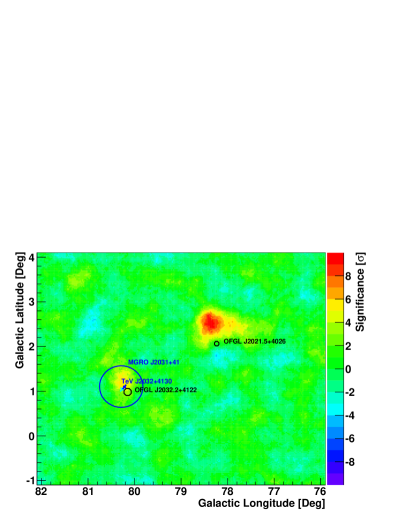
Figure 2 shows the pre-trials significance at all points in the VERITAS Cygnus Region survey above galactic longitude, based on the standard extended source analysis and including all data taken through Fall 2009. This region of the survey contains two clear detections of VHE gamma-ray emission: the known source TeV J2032+4130HEGRAtev , and a newly discovered source, VER J2019+407, in the vicinity of the Cygni SNR. As shown in Figure 2, both sources are in proximity to a Fermi pulsar, and TeV J2032+4130 is also coincident with the multi-TeV gamma-ray source MGRO 2031+41.
In the full survey dataset, VER J2019+407 is detected at pre-trials and TeV J203+4130 is detected at at the nominal position. Neither source exceeded pre-trials in the base survey.
IV.1 VER J2019+407
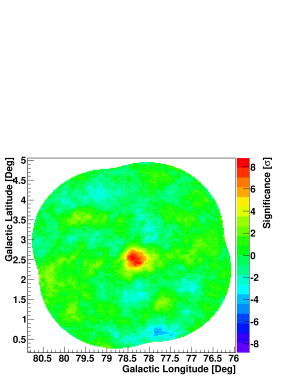
The base survey had shown a hint of extended emission (at the level) in the northwest corner of the Cygni SNR; survey-style follow-up data in Fall 2008 and wobble observations taken in Spring 2009 raised the signal to the level of pre-trials in the various survey analyses. In Fall 2009, a set of independent wobble observations were taken at offsets about the position (RA,Dec) , . The resulting significance map is shown in Figure 3; extended emission was detected with a maximum significance of 8.5 standard deviation ( post-trials) within a search region of radius around the central wobble position, using the standard extended source analysis from the survey. The analysis and search region were chosen a priori based on the the previous survey results.
The centroid and intrinsic extension of the source are based on the Fall 2009 observations only, and were characterized by fitting an asymmetric two-dimensional Gaussian convolved with the point-spread function (PSF) of the instrument, to an acceptance-corrected uncorrelated excess map with bins. The PSF was derived from a fit to Crab data taken in Fall 2009 and has a containment radius of . We find a preliminary centroid position of , and a preliminary extension of and along the major and minor axes.
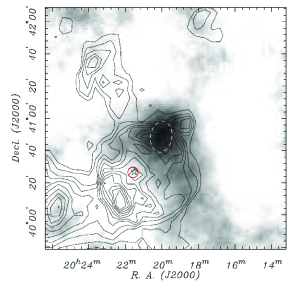
The nature of VER J2019+407 is still unclear. As the centroid of VER J2019+407 is displaced from the Fermi pulsar position by over (15pc for an assumed distance of 1.7kpclandp ), an association between the two sources seems unlikely. While it is not uncommon for VHE gamma-ray pulsar wind nebulae to be displaced from both the associated pulsar and the X-ray (or GeV gamma-ray) counterpart of the PWN, a displacement of this size would be rare and not easily justified. It seems more likely that the TeV emission is in some way associated with the northwestern portion of the SNR itself. It would be attractive to interpret the emission as being hadronic in origin and associated with a shock-cloud interaction, but this would require sufficient density in HI to compensate for the relative lack of molecular material, particularly CO, at the VER J2019+407 position. There are two other puzzling features that must also be explained: the reason for the correlation between the TeV emission and the population of GeV electrons indicated by high-intensity regions in the radio contours at 1420 MHz and 4.85 GHz, and the confinement of emission to the northwestern portion of the remnant. One possible scenario is that the SNR was previously expanding within a low density bubble blown by winds from the progenitor star. In this case, the SNR has only recently begun to interact with relatively dense material in the interstellar medium, with the northwestern portion of the remnant being the first to encounter denser material.
Uchiyama et al. have also argued for the presence of shock-cloud interactions in the northwestern part of the remnant on the basis of clumpy structures in 0.7-1keV ASCA satellite data, some of which are co-located with VER J2019+407uchiyama . However, the corresponding identification of hard X-ray sources in the same region in the 4-7 keV band with shocked, high-density HI cloudlets rested on the identification of this region with EGRET source 3EG J2020+4017, which is now identified with OFGL J2021.5+4026 and therefore now localized well away from VER J2019+407. A Fermi upper limit on GeV gamma-ray emission within the VER J2019+407 emission region would therefore be essential to placing an upper limit on possible HI cloudlet density in the region.
V Base Survey Sensitivity and Limits
A set of detailed survey simulations, coupled with observations of the Crab Nebula at multiple offsets, allows us to determine the a priori sensitivity of the survey analyses, not only to a point source with a Crab-like spectrum, but to harder-spectrum and/or significantly extended sources. In order to best reproduce the expected background conditions, blank (i.e. cosmic-ray dominated) survey fields were used to provide the background for these simulations. Blank fields at an appropriate range of zenith angles were pulled from the survey and arranged in a mocked-up ‘cell’ of the survey grid around a test point. Showers that reconstruct at a distance greater than from the center of the field of view are not used in the analysis of survey data. Therefore, only pointings where the center of the field of view is less than from the test position are included in the simulation, as only these pointings contribute significantly to the sensitivity at the test point.
Simulated gamma rays were then injected into each field in the simulated survey grid at the test position at a rate appropriate to the source spectrum and flux strength in question. In each case the gamma rays were simulated at an appropriate camera offset and matched as closely as possible to the background field in terms of zenith angle and azimuth. In the case of an extended source, the injection positions were smeared by a two-dimensional Gaussian with appropriate radii. The simulated grid is then analyzed using standard survey analysis procedures.
| Analysis | Source Properties | ||
|---|---|---|---|
| Spectral Index | Extension (radius) | Flux | |
| Standard Point | 2.5(2.0) | none | 4% Crab 200 GeV |
| Standard Extended | 2.5(2.0) | 10% Crab 200 GeV | |
| Hard Point | 2.0 | none | 6.3% Crab 500 GeV |
| Hard Extended | 2.0 | 16% Crab 500 GeV | |
Preliminary results of the sensitivity studies, using a simulated survey grid of four-telescope array observations taken at zenith angle, have been completed. Using the results of theses studies, and accounting for variations in sensitivity due to array configuration and zenith angle, we derive preliminary values for the sensitivity of the various survey analyses to sources of particular spectral indices and extensions, as summarized in Table 2. Extrapolating from these sensitivities and assuming a fluctuation, we calculate preliminary flux limits (for all points below in the survey region) of of the Crab above 200 GeV for point sources and of the Crab above 200 GeV for extended sources.
The base Cygnus region survey sees no points at or above pre-trials. If we extrapolate from our sensitivity estimates and the population seen by the original H.E.S.S. surveyhess_survey of the region between , and correct for the area covered by the two surveys at or near full sensitivity, we would have expected to see between two and three sources in the base survey. While these preliminary results are not conclusive, they do seem to indicate a difference in VHE gamma-ray source population between the Cygnus region and the Galactic center region surveyed by H.E.S.S.
VI Summary and Outlook
VERITAS has completed a 140-hour survey of a 5 by 15 degree portion of the Cygnus region of the Galactic Plane, and simulation studies indicate that the base survey’s average VHE point-source flux sensitivity is better than of the Crab Nebula at energies above 200 GeV, and we derive preliminary flux limits of of the Crab Nebula for point sources and of the Crab Nebula for all points in the survey below . Given our estimated sensitivity and the known source population from the original 2005 H.E.S.S. survey of the Galactic Center region, we would have expected to see 2-3 sources in the Cygnus region in the base survey at or above pre-trials, but see none—a result indicative of a population difference between the two regions. Follow-up observations within the survey region have also resulted in two source detections: TeV J2032+4130 (which is likely related to the coincident Fermi source OFGL J2032.2+4122) and a newly-discovered region of extended emission, VER J019+407, overlapping the northwest portion of the Cygni SNR, which may or may not have a relationship to the nearby Fermi source OFGL J2021.5+4026.
VERITAS observations continue on areas of interest within the Cygnus Region survey. Studies of correlations between VERITAS and Fermi maps in this region are also planned.
Acknowledgements.
This research is supported by grants from the U.S. Department of Energy, the US National Science Foundation, and the Smithsonian Institution, by NSERC in Canada, by Science Foundation Ireland, and by STFC in the UK. We acknowledge the excellent work of the technical support staff at the FLWO and the collaboration institutions in the construction and operation of the instrument.References
- (1) Aharonian, F. A., et al., A&A, 395, 803 (2002).
- (2) J.S. Perkins et al. “VERITAS Telescope 1 Relocation: Details and Improvements”, these proceedings.
- (3) Aharonian, F., et al (H.E.S.S. collaboration) 2005, A&A, 430, 865
- (4) Hillas, M., Proc. of the 19th ICRC (La Jolla, USA) 3, 445 (1985).
- (5) Krawczynski, H. et al. Astroparticle Physics, 25, 380 (2006).
- (6) Hartman, R.C., et. al.. ApJS 123, 79-202 (1999).
- (7) Abdo, A. A. et al. ApJS 183, L46 (2009).
- (8) Abdo, A. A., et al. ApJ 664, L91-L94 (2007).
- (9) Aharonian, F. et al., Science 307, 1938–1942 (2005).
- (10) Uchiyama, Y., et al. ApJ 855, 866 (2002).
- (11) Ladouceur, Y. and Pineault, S. A.&A. 490, 197-211 (2008).
- (12) Aharonian, F., et al. ApJL. 675, L25-28 (2008).
- (13) Aharonian, F. et al., A.&A. 431, 197–202 (2005).
- (14) Taylor, A. R. et al. AJ 125:3145-3164 (2003).
- (15) Abdo, A. A., et al. ApJL. 700, L127 (2008)