Extragalactic Jets from the TANAMI Sample as Seen by Fermi/LAT
Abstract
The TANAMI program has been monitoring the parsec-scale radio jets of southern -ray bright AGN with VLBI techniques simultaneously with Fermi/LAT monitoring of their -ray emission. Here we present the -ray properties of the TANAMI sources based on an analysis of the preliminary 1-year LAT source list. We present upper limits on the -ray flux for TANAMI sources not detected by LAT.
I Introduction
Blazars are a subset of active galactic nuclei (AGN). They are variable, radio-loud, and very luminous. Their emission often has a high degree of polarization. The strong -ray variability and luminosity can be explained by collimated jets consisting of charged particles moving at relativistic velocities, which are orientated with a small angle to the line of sight and thus Doppler boosted (Blandford and Rees, 1978; Maraschi et al., 1992). This explanation is confirmed by the fact that blazars typically exhibit apparent superluminal motion in the inner radio-jet (Lister et al., 2009a).
The EGRET detector aboard the Compton Gamma Ray Observatory (CGRO; Thompson et al., 1993) found that many blazars have strong -ray emission. A successor of this mission was launched in 2008 June 11: The Large Area Telescope (LAT), which is a pair conversion detector on board the Fermi Gamma-ray Space Telescope (Atwood et al., 2009). Fermi/LAT has been in operation since 2008 August 11 and detects -rays with energies in the range from 20 MeV to 300 GeV. The sensitivity of LAT is more than one order of magnitude higher than that of EGRET. The whole sky is scanned by LAT every 3 hours and in its sky-survey mode uniform exposure is obtained within a few months. One of LATs major scientific goals is to observe the -ray activity of AGN, i.e., the detection and monitoring and of variable flaring sources. Most of the EGRET detections were confirmed. A detailed discussion of AGN detections by Fermi/LAT is given by Abdo et al. (2009a) based on the first three months of LAT observations.
Tracking Active Galactic Nuclei with Austral Milliarcsecond Interferometry (TANAMI) is a radio VLBI monitoring program of AGN jets south of declination. The observations are performed approximately every two months with the telescopes of the Australian Long Baseline Array (LBA; Norris, 1988) in combination with telescopes in South Africa, Antarctica and Chile. A detailed discussion of the TANAMI program including a description of the initial source sample, explanations of the observation and data reduction procedures, and brief notes on the individual sources are given by Ojha et al. (submitted to A&A) and presented in contributions to this volume by Ojha et al. (2009) and Müller et al. (2009). Observations are made at 8.4 GHz and 22 GHz yielding spectral indices of parsec-scale jet features. VLBI monitoring allows to determine intrinsic jet parameters, such as the jet speed and the collimation angle, and makes the tracking of components in the jet possible. For that reason VLBI is a crucial complement to high energy astronomy to figure out the underlying emission processes of -rays in the jet.
Recent results of the MOJAVE team (Lister et al., 2009b) have shown that the -ray brightness of AGN as seen by LAT is correlated with VLBI jet properties (Lister et al., 2009c; Kovalev et al., 2009). MOJAVE is an extensive long-term monitoring program of AGN jets in the northern sky, begun in 1994. It provides a multi-year database to study correlations between radio and -ray emission of blazar jets.
In this work, we present the -ray properties of the TANAMI sample, which were obtained in the first year of Fermi operations. The combined analysis of radio and -ray properties is still in progress.
II Analysis
We analyzed the -ray emission of the sources in the TANAMI sample consisting of 65 AGN as of 2009 November. The sample, which was recently extended to 75 sources, is discussed by Müller et al. (2009). We searched for associations with -ray sources from the 1-year catalog under development by the LAT team and determined upper limits on the -ray flux for TANAMI sources without a -ray counterpart in this catalog.
To obtain a first tentative association of an AGN from the sample a simple comparison of the positions of the TANAMI sources with that of the -ray sources in the preliminary version of First LAT Catalog (Abdo et al., in preparation) turned out to be an efficient technique. In most cases the result was unique, i.e., for each AGN there were not more than one -ray source with a position uncertainty larger than the separation to the radio position of the AGN. The tentative associations were then confirmed by taking the automatic source association pipeline of the LAT team Abdo et al. (2009b) into account. This process is based on positional coincidence but additionally considers the class and physical expecations of possible association candidates for a -ray source in order to determine association probabilities. The application of a figure-of-merit (FoM) approach for finding AGN associations is discussed by Healey et al. (2008).
For AGN which could not be associated with -ray catalog sources we calculated upper limits on the -ray flux and list the test statistic (TS) for a -ray source at this position using a maximum likelihood analysis (Cash, 1979; Mattox et al., 1996). is comparable to the significance in sigma. For the calculation of upper limits we use only photons in the “Diffuse” class with energies in the range 100 MeV – 100 GeV. To minimize contamination from limb -rays, photons with zenith angles greater than were removed. The standard Fermi-LAT ScienceTools software package 111http://fermi.gsfc.nasa.gov/ssc/data/analysis/documentation/Cicerone/ (version v9r15p2) was used with the “P6_V3_DIFFUSE” set of instrument response functions. The flux, photon index, and test statistic of each source were determined by analyzing a Region of Interest (RoI) of 12∘ in radius centered at the radio position and we modeled the LAT point sources with a single power-law (). The Galactic diffuse background and the isotropic background used in the RoI model (including the -ray diffuse and residual instrumental backgrounds) are the currently recommended versions released and described in more detail in documentation available at the Fermi Science Support Center 222http://fermi.gsfc.nasa.gov/ssc/data/access/lat/BackgroundModels.html.
In addition to the TS values obtained in our upper limit analysis we present TS maps of the analyzed region and the pointlike TS values. Localized peaks in these TS maps indicate tentative new detections of a source. The method of the pointlike TS is described in detail in a contribution to this volume by Burnett (2009).
III Results
The analysis of LAT data revealed different results for different classes of AGN. The sources in our sample are classified according to the Véron-Véron 12th edition catalog (Véron-Cetty and Véron, 2006). The detection rates in the -ray regime of certain source classes is biased by our sample selection. The TANAMI sample consists of a flux-limited radio subsample combined with a -ray selected subsample based on known and candidate EGRET detections. In addition sources from special classes, such as intra-day variable (IDV) and giga-hertz peaked spectrum (GPS) sources were included in the sample. During the operation time of Fermi we added southern AGN, which are candidate counterparts for LAT sources, to the inital sample of 43 AGN.
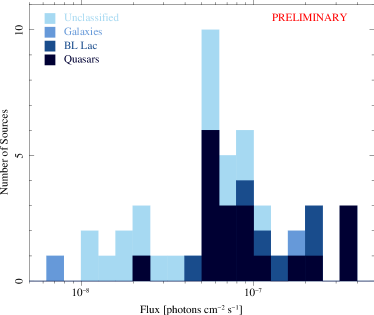
45 out of the 65 AGN from the TANAMI sample can be associated with -ray sources from the 1-year catalog under development by the LAT team. All of the 7 BL Lac objects in the sample were detected in the -ray regime. 20 out of 28 quasars were detected, but only 2 out of 11 radio galaxies have strong enough -ray emission to be detected with LAT. The two detected radio galaxies are PKS 0625354 (OH342) and PKS 1322428 (Cen A). This result is consistent with the unification scheme (Urry and Padovani, 1995) in which the inclination of the jet and thus the relativistic beaming effects are considered. Cen A is the closest AGN and PKS 0625354 is interesting because it exhibits an FR I radio-galaxy morphology whereas its optical spectrum is similar to that of a BL Lac object (Wills et al., 2004). Further TANAMI observations are necessary to determine properties of the inner radio jet of this source, such as its speed.
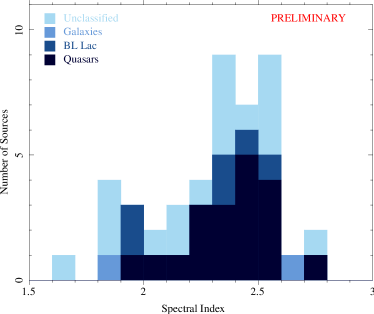
The distribution of the -ray flux of the associated sources is shown in Fig. 1. The distribution of spectral indices is presented in Fig. 2.
For sources that were not associated we performed a maximum likelihood analysis to obtain upper limits on the flux. For this analysis we used the positions of the AGN, which are know from observations at radio frequencies, and analyzed the LAT data at these positions.
The calculation of upper limits on the -ray flux for the unassociated AGN from the TANAMI sample revealed in several cases a relatively high TS. We modeled sources with following the criteria of the LAT team, while upper limits are presented for the other sources. The resulting parameters are shown in Tab. 1. Out of these 20 sources we found two objects with test statistic larger than 25. In both cases also the TS maps, which are presented in Fig. 3, show a localized peak at the corresponding position.
The spectral indices of the tentative detections (Tab. 1) are larger than the average of the catalog sources shown in Fig. 2. Modelling the other sources in the sample, with , yielded soft spectra as well. This trend can be understood as the size of the point spread function of the LAT decreases with energy, and makes it difficult to localize soft weak sources. These tentative detections need to be confirmed by further analysis, such as the comparison with a large sample of random positions. For that reason only upper limits for these sources are presented here. Several of the tentatively detected sources are close to bright sources or not far away from the Galactic plane. Further analysis is required to determine if the asymmetric distribution of spectral indices is a characteristic of the sample.
In addition to the likelihood analysis, we calculated TS maps (Burnett, 2009). The pointlike TS peak values from the TS maps are qualitatively similar but show a significant quantitative difference to the TS values obtained with the upper limit analysis. This differences will be investigated in more detail, such as the analysis of a large sample of random position.
| Name | ID333 The optical counterpart, denoted as follows: (Q) quasar, (B) BL Lac object, (G) galaxy, (U) unclassified | TS | Flux444 Flux in the energy band from 100 MeV to 100 GeV in units of [ photons cm-2 s-1] | ptlikeTS | |
| 1505-496 | U | 51.64 | 5.4 | ||
| 2149-306 | Q | 31.00 | 5.7 | ||
| 0438-436 | Q | 0.01 | — | 0.6 | |
| 0518-458 | G | 9.18 | — | 6.6 | |
| 0527-359 | U | 0.00 | — | 0.0 | |
| 1104-445 | Q | 3.65 | — | 0.7 | |
| 1257-326 | Q | 0.00 | — | 3.3 | |
| 1333-337 | G | 0.00 | — | 0.0 | |
| 1549-790 | G | 2.04 | — | 0.0 | |
| 1716-771 | U | 0.00 | — | 1.9 | |
| 1718-649 | G | 14.00 | — | 8.8 | |
| 1733-565 | G | 0.00 | — | 0.0 | |
| 1804-502 | Q | 18.32 | — | 7.0 | |
| 1814-637 | G | 1.56 | — | 1.8 | |
| 1934-638 | G | 0.00 | — | 0.0 | |
| 2027-308 | G | 14.29 | — | 2.0 | |
| 2106-413 | Q | 0.00 | — | 0.0 | |
| 2152-699 | G | 20.32 | — | 6.7 | |
| 2326-477 | Q | 17.56 | — | 1.1 | |
| 2355-534 | Q | 15.03 | — | 1.6 |
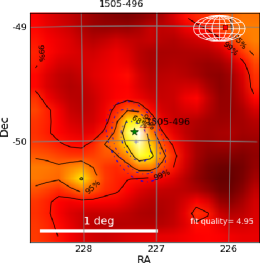
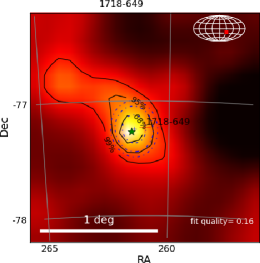
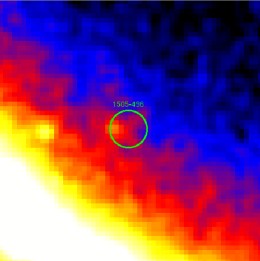
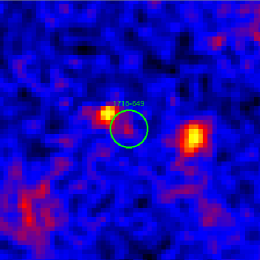
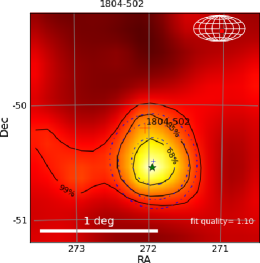
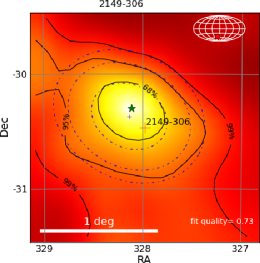
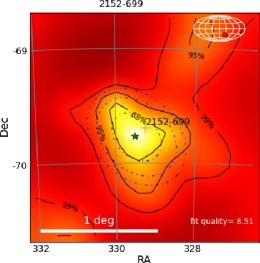
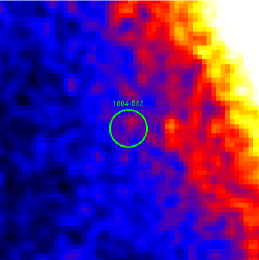
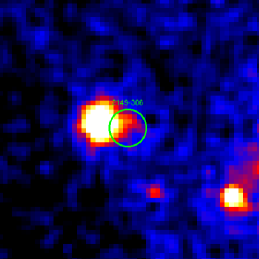
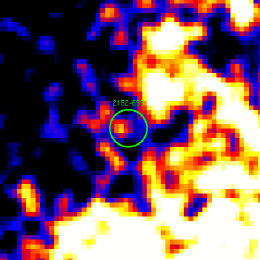
In Fig. 3, the TS maps of the five unassociated sources with the best localized TS peak, and the corresponding count maps are shown. The source PKS 1718649 is an interesting candidate, as this source is one of the closest (56 Mpc) and best studied GPS sources (e.g., Tingay et al., 2003) and would be the first LAT detected source of this type. The radio morphology of this source is classified as irregular as it does not fit in the classification scheme of “compact”, “single-sided jet”, or “double sided jet”. More TANAMI observations of this source have to be analyzed to clarify its structure and especially the kinematic behavior of the radio jet.
IV Summary
We analyzed the -ray properties of the TANAMI sample based on the data obtained with Fermi-LAT during its first year of operation. 45 out of the 65 AGN from this sample can be associated with -ray sources from the 1-year catalog under development by the LAT team. All BL Lac objects and a large fraction of quasars (71%) are detected in the -ray regime, whereas from the 11 radio galaxies only the closest one (Cen A) and one (PKS 0625354) with an optical spectrum similar to a BL Lac object were detected with Fermi-LAT. For the 20 AGN without -ray counterpart we presented upper limits on the -ray flux. In two cases (PKS 1505496, PKS 2149306) the TS was high enough to model a source. The combination with TS maps indicated tentative new -ray detections of five sources (PKS 1505496, PKS 1718649, PKS 1804502, PKS 2149306, PKS 2152699).
Acknowledgements.
This research has been partially funded by the Bundesministerium für Wirtschaft und Technologie under Deutsches Zentrum für Luft- und Raumfahrt grant number 50OR0808. The Long Baseline Array is part of the Australia Telescope which is funded by the Commonwealth of Australia for operation as a National Facility managed by CSIRO.References
- Blandford and Rees (1978) R. D. Blandford and M. J. Rees, in BL Lac Objects, edited by A. M. Wolfe (1978), pp. 328.
- Maraschi et al. (1992) L. Maraschi, G. Ghisellini, and A. Celotti, ApJL 397, L5 (1992).
- Lister et al. (2009a) M. L. Lister, M. H. Cohen, D. C. Homan, M. Kadler, K. I. Kellermann, Y. Y. Kovalev, E. Ros, T. Savolainen, and J. A. Zensus, AJ 138, 1874 (2009a).
- Thompson et al. (1993) D. J. Thompson, D. L. Bertsch, C. E. Fichtel, R. C. Hartman, R. Hofstadter, E. B. Hughes, S. D. Hunter, B. W. Hughlock, G. Kanbach, D. A. Kniffen, et al., ApJS 86, 629 (1993).
- Atwood et al. (2009) W. B. Atwood, A. A. Abdo, M. Ackermann, W. Althouse, B. Anderson, M. Axelsson, L. Baldini, J. Ballet, D. L. Band, G. Barbiellini, et al., ApJ 697, 1071 (2009).
- Abdo et al. (2009a) A. A. Abdo, M. Ackermann, M. Ajello, W. B. Atwood, M. Axelsson, L. Baldini, J. Ballet, G. Barbiellini, D. Bastieri, B. M. Baughman, et al., ApJ 700, 597 (2009a).
- Norris (1988) R. P. Norris, in The Impact of VLBI on Astrophysics and Geophysics, edited by M. J. Reid & J. M. Moran (1988), IAU Symposium 129, 485.
- Ojha et al. (2009) R. Ojha et al., Proc. Fermi Symposium (this volume) (2009).
- Müller et al. (2009) C. Müller et al., Proc. Fermi Symposium (this volume) (2009).
- Lister et al. (2009b) M. L. Lister, H. D. Aller, M. F. Aller, M. H. Cohen, D. C. Homan, M. Kadler, K. I. Kellermann, Y. Y. Kovalev, E. Ros, T. Savolainen, et al., AJ 137, 3718 (2009b).
- Lister et al. (2009c) M. L. Lister, D. C. Homan, M. Kadler, K. I. Kellermann, Y. Y. Kovalev, E. Ros, T. Savolainen, and J. A. Zensus, ApJL 696, L22 (2009c).
- Kovalev et al. (2009) Y. Y. Kovalev, H. D. Aller, M. F. Aller, D. C. Homan, M. Kadler, K. I. Kellermann, Y. A. Kovalev, M. L. Lister, M. J. McCormick, A. B. Pushkarev, et al., ApJL 696, L17 (2009).
- Abdo et al. (2009b) A. A. Abdo, M. Ackermann, M. Ajello, W. B. Atwood, M. Axelsson, L. Baldini, J. Ballet, D. L. Band, G. Barbiellini, D. Bastieri, et al., ApJS 183, 46 (2009b).
- Healey et al. (2008) S. E. Healey, R. W. Romani, G. Cotter, P. F. Michelson, E. F. Schlafly, A. C. S. Readhead, P. Giommi, S. Chaty, I. A. Grenier, and L. C. Weintraub, ApJS 175, 97 (2008).
- Cash (1979) W. Cash, ApJ 228, 939 (1979).
- Mattox et al. (1996) J. R. Mattox, D. L. Bertsch, J. Chiang, B. L. Dingus, S. W. Digel, J. A. Esposito, J. M. Fierro, R. C. Hartman, S. D. Hunter, G. Kanbach, et al., ApJ 461, 396 (1996).
- Not (a) http://fermi.gsfc.nasa.gov/ssc/data/analysis/documentation/Cicerone/.
- Not (b) http://fermi.gsfc.nasa.gov/ssc/data/access/lat/BackgroundModels.html.
- Burnett (2009) T. Burnett, Proc. Fermi Symposium (this volume) (2009).
- Véron-Cetty and Véron (2006) M. Véron-Cetty and P. Véron, A&A 455, 773 (2006).
- Urry and Padovani (1995) C. M. Urry and P. Padovani, PASP 107, 803 (1995).
- Wills et al. (2004) K. A. Wills, R. Morganti, C. N. Tadhunter, T. G. Robinson, and M. Villar-Martin, MNRAS 347, 771 (2004).
- Tingay et al. (2003) S. J. Tingay, P. G. Edwards, and A. K. Tzioumis, MNRAS 346, 327 (2003).