Beam Energy Considerations for Gold Nano–Particle Enhanced Radiation Treatment
Abstract
Purpose: A novel approach using nano technology enhanced radiation modalities is investigated. The proposed methodology uses antibodies labeled with organically inert metals with a high atomic number. Irradiation using photons with energies in the kilo–electron volt (keV) range show an increase in dose due to a combination of an increase in photo–electric interactions and a pronounced generation of Auger and/or Coster–Krönig (A–CK) electrons.
Methods: The dependency of the dose deposition on various factors is investigated using Monte Carlo simulation models. The factors investigated include: agent concentration, spectral dependency looking at mono–energetic sources as well as classical bremsstrahlung sources. The optimization of the energy spectrum is performed in terms of physical dose enhancement as well as the dose deposited by Auger and/or Coster–Krönig electrons and their biological effectiveness.
Results: A quasi–linear dependency on concentration and an exponential decrease within the target medium is observed. The maximal dose enhancement is dependent on the position of the target in the beam. Apart from irradiation with low photon energies (10 – 20 keV) there is no added benefit from the increase in generation of Auger electrons. Interestingly, a regular 110kVp bremsstrahlung spectrum shows a comparable enhancement in comparison with the optimized mono–energetic sources.
Conclusions: In conclusion we find that the use of nano–particle enhanced shows promise to be implemented quite easily in regular clinic on a physical level due to the advantageous properties in classical beams.
1 Introduction
Recently, methodologies using monoclonal antibodies that target specific tumor cells have been used to bring active compounds in the vicinity of these cells. One approach uses radioactive compounds of – or –emitters[1, 2, 3]. Alternatively, chemotherapeutic compounds have been attached to this delivery mechanism. The use of such approaches is interesting but limited due to the fact that the therapeutic compound is already active at time of delivery and during secretion by the body. More in particular with radioactive compounds an important whole body dose (red marrow dose) as well as renal toxicity are limiting factors for the efficacy of the treatment[4, 5, 6, 7].
It is the goal of this paper to investigate a delivery method that could potentially have most of the benefits associated with the previously listed therapeutic modalities ánd has almost none of the disadvantages. Which means:
-
1.
Differentiation between malignant and healthy cells.
-
2.
Enhanced effectiveness.
-
3.
Image guidance possibilities.
-
4.
Activation methodology (i.e. Only active were it needs to be active).
-
5.
Large therapeutic window.
Dose enhancement due to the presence of gold nano–particles has been proposed already both by means of an injectable contrast agent as by the use of mono–clonal antibodies or other targetted delivery methods.. However, the enhancement relied on an increased interaction due to the increased probability of the photo–electric interaction being dependent on the atomic number at the proposed energies and the specific contribution of Auger electrons was not investigated[8, 9, 10, 11]. All sources used in these studies were spectral sources and/or brachytherapy sources. Moreover, proposals to use more sophisticated photon sources have been put forward, in the hope to maximize the efficiency of the conversion of the beam energy to deposited energy as well as generate a high amount of Auger electrons[12].
In the dose deposition model proposed here a significant part of the energy is deposited by Auger electrons. There is reason to believe that Auger electrons deposit their energy more efficiently than those emanating from Compton or photo–electric effect processes. The exact mechanism behind this apparant dose enhancement effect is still unclear. A possible cause is the fact that Auger have a very low energy and deposit all of the energy within a range comparable to a few cell diameters. Furthermore, there is a possible change in the stopping power energy dependency at very low energies (10keV), where the Bethe formalism breaks down. Alternatively, it could be that on average more than a single Auger electron is being produced, increasing the probability of clustered double strand breaks.
A number of authors have investigated the biological effects indirectly and support the notion that Auger electrons indeed have high LET characteristics[13, 14, 15].
To our knowledge. a systematic study of the impact of different spectral sources on the enhancement and the possible biological enhancement has not been published.
2 Methods and Materials
To perform the planning simulation we used MCNPX (Monte Carlo N-Particle eXtended)[16] version 2.7a running on a 738 node cluster at the University of Leuven. The department of experimental radiotherapy at Leuven is part of the beta–test group for MCNPX. The following physical parameters were used during these simulations.
- Photon energy cutoff:
-
1keV.
- electron energy cutoff:
-
1keV.
- EM interaction library:
-
ENDF/B-VI Release 8 Photoatomic Data 02/07/03
For the spectral dose deposition from Auger electrons version 2.7b was used. As the version is only available to use as a single processor binary it was not possible to run this on the cluster. Therefore if we did not need information on the Auger electrons seperately we chose to use the earlier version.
2.1 Geometry
The simulation geometry consisted of a tank filled with water containing three 1mm thick cylindrical slabs holding tissue as defined by ORNL report TM8381. One slab was positioned at the surface of the tank representing a skin surface. A second slab was positioned at 5cm distance from the tank surface down stream from the source. In this slab varying concentrations of gold were added in a homogeneous distribution. Additionally, geometrically identical slabs containing tissue, were positioned downstream adjacent to the structure containing the gold particles. The source in this geometry was a plane source (not divergent). The divergence can be introduced depending of the position of the source in a clinical situation by applying a inverse square rule.
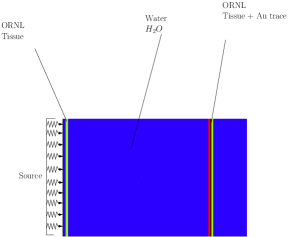
2.2 Source
The radiation source is modeled after mono–energetic radiation sources obtained by Bragg–Gray diffraction of regular X–ray sources. Although these sources are called mono–energetic, they do exhibit some spectral spread which was modeled as a normal distribution with a = 1.5keV.
2.3 Simulations
2.3.1 Energies
To investigate the energy dependence of the therapeutic window, we performed the same simulation with quasi–mono–energetic beams of energies ranging from 10 to 200 keV, with special consideration to the Kα–energy of gold (i.e. 80.67keV). Additionally, a broad spectrum beam was investigated. The spectrum was taken to be identical to that coming from an Acuity simulator’s X–ray tube (Varian Inc.) running at 110kVp.
2.3.2 Concentrations
The medium used in the activated environment was considered to be tissue as defined in the (Oak Ridge National Labs (ORNL) Report TM-8381). Gold (Z=79) in natural isotope abundance was added with all other components diminished to yield a normalized weight. The structures were embedded in water. The concentrations of gold in one of the structures varied between 0 and 10% in steps of 1%. A concentration of 10% is highly unlikely, however as reported by Verhaegen et al. it is the concentration of off–the–shelf contrast material and should serve as an upper limit of the enhancements achievable with this technique. Furthermore, it is to be expected that once a distribution methodology for the gold particles is implemented we are bound to see very heterogeneous concentrations of gold in the irradiated medium, reaching high concentrations locally.
All concentration related simulations were performed with the broad spectrum, for reasons made clear in the results section.
2.3.3 Auger electrons
As mentioned above, the contribution of the Auger electrons could be estimated by tagging the electrons released due to Auger cascades in the cell of interest. The number of generated Auger electrons could then be linked to the energy of the source.
This to find the optimal energy for Auger electron generation. Below energies of 1keV MCNPX does not track the electrons and the energy is considered to be deposited locally. The simulations were performed for all energies as listed above.
2.4 Analysis
2.4.1 Energy Dependence
The energy dependence is reviewed for the maximal concentration of 10%, this because any differences between the energies would be magnified, as well as reduce the statistical errors in our monte carlo calculations. We define three types of dose enhancement:
- Absolute Enhancement ():
-
The ratio of the dose deposited in the gold–containing structure to the dose deposition in a run with exact same geometry without gold present.
- OAR Enhancement ()
-
: The ratio of the dose deposited in the gold–containing structure to the dose deposited in another structure in the geometry not containing gold, representing an Organ at Risk (OAR).
- Skin ratio ()
-
: The ratio of the dose deposited in the gold–containing structure to a layer 1mm under the skin. Which is a special case of .
We determined the energy deposited per unit mass by counting the energy deposited by electrons using the MCNPX tally F6:E. This underestimates the effectively deposited dose slightly as it does not take into account the energy expended to generate the photon initiated ionization. However, this ionization is likely not contributing to a biological effect as it is mainly through interaction with the gold atom which does not form part of the cell structure. The difference between F6:E and F6:P (Energy transferred by photons, which includes electrons) is about 1%. However the electron energy deposition is better defined spatially.
2.4.2 Concentration
The results from the concentration study were analyzed in function of absolute enhancement. The variation was fit using a linear relationship and a second order polynomial. The fit was performed using a minimization of a –function taking into account the simulation errors.
2.5 Radiobiological effect
To estimate the relative effect of the change in spectrum and the increase in the contribution by Auger–electrons we used a fast monte carlo model of biological damage as proposed by Semenenko and Stewart[17] which has been shown to obtain the same results as track code monte carlo codes as proposed by Nikjoo et al. [18]. The approach used here determines the amount of different damage to a DNA–molecule from direct ionization as well as through the generation of radicals. It then produces a yield () in percentage of the different types of damage ranging from single strand breaks to complex clustered double strand breaks for interacting electrons of a given energy (). The methodology used to incorporate this information in our calculations is as follows.
-
1.
For every energy available in the energy deposition histogram we used the code provided by Semenenko and Stewart to generate the yields of the different types of DNA–damage making sure that the lowest energy is included. The yield is given as percentage per cell and per Gy ().
-
2.
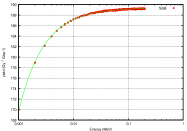
The data was fit as a function of energy of the electron using an equation of the form:
(1) with , , and variable parameters. Figure 2 shows for single strand breaks and double strand breaks together with the fitted parameters, which are provided in table 1.
par SSB DSB a 1136.3.801 49.656 b -0.1735 0.0569 c -0.945 -0.907 Table 1: Parameter fit for number of single resp. double strand breaks Gy-1 cell-1 using a function of the form: . -
3.
The total relative yield of damage of type D () was then given by
(2) With F(E) the normalized histogram of deposited energy as a function of energy of the depositing electrons (in MCNPX tally F6:E divided by the total energy).
-
4.
This repeated for all damage types and volumes with and without nano–particles.
-
5.
The ratio’s of the different yields for these volumes provides the relative yield.
For reasons of simplicity we chose to concentrate on the yields of single and double strand breaks. The latter being defined as strand breaks on different DNA–helices not more than 10 base pairs apart[18].
3 Results
3.1 Enhancement
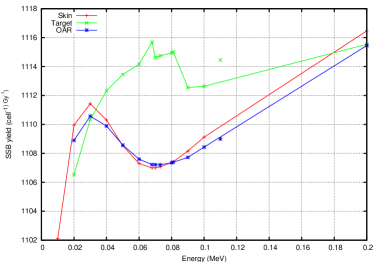
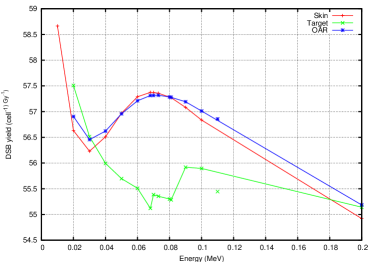
Figures 3a and 3b show the maximal enhancements (i.e. 10% solution) of the dose in the volume containing GNP (target) compared to the skin and organ at risk structures. The skin ratio shows two local maxima at 60keV and at 90 keV. The OAR, which is positioned downstream of the target structure decreases monotonically reflecting a shielding effect due to the increased photon absorption in the target.
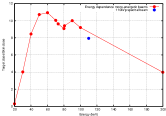
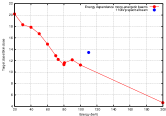
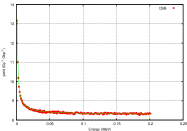
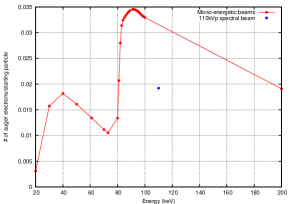
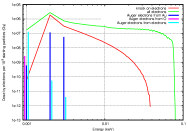
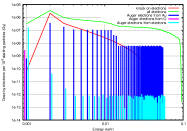
Figure 4 counts the number of Auger or Coster–Krönig electrons (AE) generated in the target. The graph reflects the atomic structure in of gold as both L– and K–edges show their influence leading to local maxima of generated Auger electrons. The highest number generated occurs at 90 keV. However, the energy of the AE in the latter case is much higher than those generated with lower energy. This can be seen in Figure 5 where the energy deposition of the various electrons is presented. Also note that in both cases the contribution of AE to the energy deposition process remains an order of magnitude lower. The largest part of the dose is deposited by photo–electric (PE) and knock–on electrons.
3.2 Concentration
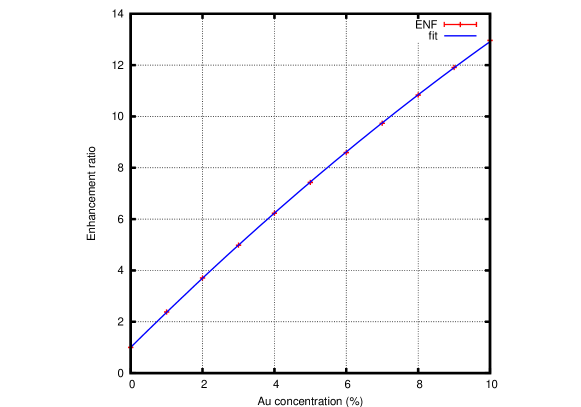
Figure 6 shows the Absolute enhancement ratio as a function of the concentration of gold in the cell. was fit with a second order polynomial, where the quadratic factor is small with respect to the other factors. Showing that the dose enhancement is quasi–linear in the sense that the quadratic term in the polynomial has a small contribution. When the second order polynomial is denoted as . Then the coefficients are: a= (), b = (), and c= (). Fixing the –coefficient to 1 gives comparable results. If a linear fit is performed the slope is given by (), a number which can be used to easily predict the impact of concentration changes.
3.3 Biological effect
Figure 7 shows the yield per cell and per Gy of single strand breaks (SSB) and double strand breaks (DSB) as a function of energy. This for the three volumes under consideration. The target volume containing GNP reflects the atomic structure in the calculated yields. One can easily identify the when auger electrons are generated as a function of beam energy. The addition generates increases in DSB and lowers the contributions of SSB. However, the added tail of high energy electrons which mainly affect the DNA through SSB’s. It is only for very low energies (10 – 20keV) that the addition of GNP changes the ratio of SSB to DSB to give the dose deposition a more high LET character. For deeper lying structures there is no data available for 10 keV as the photons do not penetrate deep enough to generate a meaningful contribution.
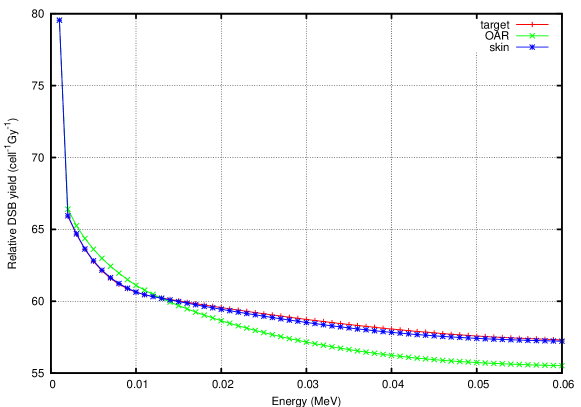
The spectrum in the target does contain more low energy electrons compared to the OAR’s. This advantage is negated by the additional tail of high energy electrons as illustrated in Fig. 8 where a cumulative representation of the dose deposition in double strand breaks is shown for a beam energy of 60kev.
4 Discussion
From the data available here, one can conclude that there exists a necessity to perform full monte carlo simulation based for these type of treatments. Not only does the enhancement change with energy it is also imperative to monitor the concentration of the nano–particles during treatment. Before treatments can be started methodologies need to be developed to monitor concentrations adequately. The monitoring of the concentration and the error of this specific measurement has a direct impact on the dosimetry as we find a relationship of concentration to dose which is close to unity. This implies that the uncertainty of the dosimetric planning is at least equal to the uncertainty of this measurement.
The choice of energy of the radiation beam for treatment does not seem to be a critical issue, as long as radiation reaches the intended volume. So, it might not be necessary to build expensive high output mono–energetic photon sources. However, to determine the concentration it might be necessary to do so albeit with a lower photon flux [19, 20]. A possible alternative for measurement is the use of the same markers with nano–particles attached, but where the gold is replaced by a radioactive isotope[21]. Using methodology developed in nuclear medicine imaging techniques the concentration and its variation can then be monitored over time. This approach gives up some of the advantages as the radioactive particles will deliver a dose in the manner we are trying to avoid. The dose, however, is only for imaging purposes and is more limited than when a therapeutic procedure is attempted. A further approach could be to measure concentration changes using other nano–particles attached to same targeting agent and use non–ionizing techniques for visualization[22]. A drawback of this technique is that due to the use of different nano–particles, the uptake and concentration dynamics could be slightly different from the therapeutically enhanced targeting molecules.
The impact of Auger electrons seems to be limited as they only consist of a small fraction of the dose depositing electrons. Only at very low energies they seem to have an effect in increasing the efficiency of the dose deposition. Using such low energies limits the use to superficial tumors or warrants the use of intra–operative techniques or brachytherapy techniques using low energy sources like or electronic brachytherapy sources[23].
From the data available here it seems that a classical bremsstrahlung source is suited as an investigative tool to assess the effectiveness of this approach for deep seated tumors.
References
- [1] T. K. Nayak, J. P. Norenberg, T. L. Anderson, E. R. Prossnitz, M. G. Stabin, R. W. Atcher, Somatostatin-receptor-targeted [alpha]-emitting 213Bi is therapeutically more effective than [beta]–emitting 177Lu in human pancreatic adenocarcinoma cells, Nuclear Medicine and Biology 34 (2) (2007) 185 – 193.
- [2] M. Pless, C. Waldherr, H. Maecke, C. Buitrago, R. Herrmann, J. Mueller-Brand, Targeted radiotherapy for small cell lung cancer using 90Yttrium-DOTATOC, an Yttrium-labelled somatostatin analogue: a pilot trial, Lung Cancer 45 (3) (2004) 365 – 371.
- [3] M. Miederer, D. A. Scheinberg, M. R. McDevitt, Realizing the potential of the actinium-225 radionuclide generator in targeted alpha particle therapy applications, Advanced Drug Delivery Reviews 60 (12) (2008) 1371 – 1382, delivery Systems for the Targeted Radiotherapy of Cancer.
- [4] A. Otte, S. M. Weiner, M. Cybulla, Is radiation nephropathy caused by Yttrium-90?, Lancet 359 (9310) (2002) 979; author reply 979.
- [5] T. Schumacher, C. Waldherr, J. Mueller-Brand, H. Maecke, Kidney failure after treatment with 90Y-DOTATOC, Eur J Nucl Med Mol Imaging 29 (3) (2002) 435.
- [6] T. M. Behr, M. Behe, G. Kluge, M. Gotthardt, M. L. Schipper, S. Gratz, R. Arnold, W. Becker, D. M. Goldenberg, Nephrotoxicity versus anti-tumour efficacy in radiopeptide therapy: facts and myths about the Scylla and Charybdis, Eur J Nucl Med Mol Imaging 29 (2) (2002) 277–279.
- [7] M. Cybulla, S. M. Weiner, A. Otte, End-stage renal disease after treatment with 90Y-DOTATOC, Eur J Nucl Med 28 (10) (2001) 1552–1554.
- [8] J. F. Hainfeld, D. N. Slatkin, H. M. Smilowitz, The use of gold nanoparticles to enhance radiotherapy in mice, Phys Med Biol 49 (18) (2004) N309–315.
- [9] F. Verhaegen, B. Reniers, F. Deblois, S. Devic, J. Seuntjens, D. Hristov, Dosimetric and microdosimetric study of contrast-enhanced radiotherapy with kilovolt x-rays, Physics in Medicine and Biology 50 (15) (2005) 3555–3569.
- [10] S. Cho, Estimation of tumour dose enhancement due to gold nanoparticles during typical radiation treatments: a preliminary Monte Carlo study, Phys Med Biol 50 (15) (2005) N163–N173.
- [11] S. H. Cho, B. L. Jones, S. Krishnan, The dosimetric feasibility of gold nanoparticle-aided radiation therapy (GNRT) via brachytherapy using low-energy gamma-/x-ray sources, Phys Med Biol 54 (16) (2009) 4889–4905.
-
[12]
E. Silver, A. Pradhan, Y. Yu, Tu-d-352-08: Innovative instrumentation for
resonant cancer theranostics, Med Phys 35 (6) (2008) 2899–2899.
URL http://link.aip.org/link/?MPH/35/2899/3 - [13] J. Chen, A compilation of microdosimetry for uniformly distributed Auger emitters used in medicine, Int J Radiat Biol 84 (12) (2008) 1027–1033.
- [14] T. Urashima, H. Nagasawa, K. Wang, S. J. Adelstein, J. B. Little, A. I. Kassis, Induction of apoptosis in human tumor cells after exposure to Auger electrons: comparison with gamma-ray exposure, Nucl Med Biol 33 (8) (2006) 1055–1063.
- [15] P. Balagurumoorthy, K. Chen, S. J. Adelstein, A. I. Kassis, Auger electron-induced double-strand breaks depend on DNA topology, Radiat Res 170 (1) (2008) 70–82.
- [16] L. S. Waters, G. W. McKinney, J. W. Durkee, M. L. Fensin, J. S. Hendricks, M. R. James, R. C. Johns, D. B. Pelowitz, The MCNPX Monte Carlo radiation transport code, in: Albrow, M and Raja, R (Ed.), Hadronic Shower Simulation Workshop, Vol. 896 of AIP conference proceedings, Amer Inst Physics, 2007, pp. 81–90, Hadronic Shower Simulation Workshop, Batavia, IL, SEP 06-08, 2006.
- [17] V. Semenenko, R. Stewart, Fast Monte Carlo simulation of DNA damage formed by electrons and light ions, Phys Med Biol.
- [18] H. Nikjoo, P. O’Neill, D. T. Goodhead, M. Terrissol, Computational modelling of low-energy electron-induced DNA damage by early physical and chemical events, Int J Radiat Biol 71 (5) (1997) 467–473.
- [19] M. Gambaccini, A. Tuffanelli, A. Taibi, A. Del Guerra, Spatial resolution measurements in quasimonochromatic x rays with mosaic crystals for mammography application, Medical Physics 28 (4) (2001) 412–418.
- [20] P. Baldelli, A. Taibi, A. Tuffanelli, M. Gilardoni, M. Gambaccini, A prototype of a quasi-monochromatic system for mammography applications, Physics in Medicine and Biology 50 (10) (2005) 2225–2240.
- [21] K. Roy, S. Lahiri, A green method for synthesis of radioactive gold nanoparticles, Green Chemistry 8 (12) (2006) 1063–1066.
- [22] C. Sun, C. Fang, Z. Stephen, O. Veiseh, S. Hansen, D. Lee, R. G. Ellenbogen, J. Olson, M. Zhang, Tumor-targeted drug delivery and MRI contrast enhancement by chlorotoxin-conjugated iron oxide nanoparticles, Nanomedicine 3 (4) (2008) 495–505.
-
[23]
M. J. Rivard, S. D. Davis, L. A. DeWerd, T. W. Rusch, S. Axelrod, Calculated
and measured brachytherapy dosimetry parameters in water for the xoft axxent
x-ray source: An electronic brachytherapy source, Medical Physics 33 (11)
(2006) 4020–4032.
URL http://link.aip.org/link/?MPH/33/4020/1