Fermi detected blazars seen by INTEGRAL
Abstract
Multiwavelength observations are essential to constrain physical parameters of the blazars observed by Fermi/LAT. Among the 187 AGN significantly detected in public INTEGRAL data above 20 keV, 20 blazars were detected. 15 of these sources allowed significant spectral extraction. They show hard X-ray spectra with an average photon index of and a hard X-ray luminosity of . 15 of the INTEGRAL blazars are also visible in the first 16 months of the Fermi/LAT data, thus allowing to constrain the inverse Compton branch in these cases. Among others, we analyse the LAT data of four blazars which were not included in the Fermi LAT Bright AGN Sample based on the first 3 months of the mission: QSO B0836+710, H 1426+428, RX J1924.8–2914, and PKS 2149–306. Especially for blazars during bright outbursts, as already observed simultaneously by INTEGRAL and Fermi (e.g. 3C 454.3 and Mrk 421), INTEGRAL provides unique spectral coverage up to several hundred keV. We present the spectral analysis of INTEGRAL and Fermi data and demonstrate the potential of INTEGRAL observations of Fermi detected blazars in outburst by analysing the combined data set of the persistent radio galaxy Cen A.
I INTRODUCTION
The identification and modelling of Fermi/LAT detected blazars requires a dense observation of these sources accross the electromagnetic spectrum, from radio observations up to the TeV range. In the neighboring wavelengths of the LAT energy band blazars are well studied in the X-ray range up to 10 keV thanks to satellite based observations ranging from early missions like EINSTEIN and EXOSAT towards nowadays Chandra and XMM-Newton. The TeV range is now becoming more and more accessible through state-of-the-art projects like HESS, MAGIC, VERITAS, and CTA in the not too distant future. In order to determine the energy output of blazars in the inverse Compton branch, it is necessary though to fill also the parameter space below 100 MeV. At the time being, there is no mission available or even planned to access the energy range between 1 and 100 MeV, thus, in order to constrain the SEDs of blazars and to learn as much as possible about the low-energy end of the inverse Compton emission, we have to rely on the hard X-ray band. Blazars in the hard X-ray range (20 keV – 500 keV) became accessible through instruments like CGRO/OSSE OSSEBlazar and BeppoSAX/PDS BeppoBlazars in the 1990s, and are nowadays probed mainly by experiments on-board Swift BATsurvey , Suzaku, and INTEGRAL INTAGN2 . In this paper we focus on blazars commonly detected by INTEGRAL and Fermi/LAT and demonstrate the potential of INTEGRAL observations of blazars in outburst. The INTEGRAL and Fermi/LAT data of the IBIS/ISGRI detected blazars are described in Sect. II, followed by a discussion of the potential of INTEGRAL observations of blazars in outburst in Sect. III, and conclusions in Section IV.
II FERMI AND INTEGRAL BLAZARS
The INTEGRAL satellite INTEGRAL hosts several instruments to study objects over a wide energy range. The spectrograph SPI performs high-resolution spectroscopy in the 20 – 8000 keV range, and IBIS/ISGRI ISGRI provides spectra and images from 18 keV up to several hundred keV. ISGRI is more sensitive and gives a higher spatial resolution than Swift/BAT, although the latter has a more uniform all-sky coverage due to its larger field of view and the Swift observation strategy following gamma-ray bursts. INTEGRAL provides broad-band coverage through the additional X-ray monitor JEM-X JEMX in the 3–20 keV range and provides photometry with the optical camera OMC OMC in the V-band. Since JEM-X and OMC have a much smaller field of view than ISGRI, for many sources no data are available from the monitors.
The analysis of the INTEGRAL data used here is described in detail in Beckmann et al. (2009). The second INTEGRAL AGN catalogue INTAGN2 lists in total 25 blazars which have been reported to be detected by IBIS/ISGRI above 20 keV, out of which 20 are detectable at in the data analysed there. The results of a single power law model fit to the data taken between January 2003 and spring 2008 are given in Table 1. It has to be pointed out that the INTEGRAL data are not simultaneous with the Fermi data. In cases where the IBIS/ISGRI detection significance was , a photon index of has been assumed in order to estimate the hard X-ray flux. For six of the 20 IBIS/ISGRI detected blazars, INTEGRAL’s X-ray monitor JEM-X gave a detection of in the band: 1ES 0033+595, Mrk 421, 3C 273, H 1426+428, Mrk 501, and 3C 454.3. In addition, for six blazars V-band measurements are available, representing the average optical emission during the INTEGRAL observation.
| Name | (OMC) | ||||||||
|---|---|---|---|---|---|---|---|---|---|
| 1ES 0033+595 | 0.086 | 45.08 | 44.36 | – | |||||
| IGR J03532–6829 | 0.087 | 44.63 | – | ||||||
| PKS 0528+134 | 2.060 | 47.51 | 20 | 48.68 | |||||
| QSO B0716+714 | 0.300 | 45.24 | 85 | 46.90 | |||||
| QSO B0836+710 | 2.172 | 47.93 | 15 | 48.42 | |||||
| Mrk 421 | 0.030 | 44.50 | 44.92 | 107 | 45.10 | ||||
| 4C 04.42 | 0.965 | 46.83 | 12 | 47.23 | |||||
| 3C 273 | 0.158 | 45.90 | 46.09 | 126 | 46.62 | ||||
| PKS 1241–399 | 0.191 | 45.23 | – | ||||||
| 3C 279 | 0.536 | 46.40 | 146 | 47.85 | |||||
| H 1426+428 | 0.129 | 45.48 | 44.80 | 13 | 45.01 | ||||
| Mrk 501 | 0.034 | 44.72 | 44.05 | 49 | 44.71 | ||||
| IGR J16562–3301 | 2.40 Masetti08 | 47.80 | – | ||||||
| PKS 1830-211 | 2.507 | 48.19 | 53 | 49.38 | |||||
| RX J1924.8–2914 | 0.352 | 45.70 | 17 | 46.39 | |||||
| 1ES 1959+650 | 0.048 | 44.32 | 33 | 44.79 | |||||
| PKS 2149–306 | 2.345 | 47.74 | 11 | 48.48 | |||||
| BL Lac | 0.069 | 44.34 | 41 | 45.32 | |||||
| IGR J22517+2217 | 3.668 | 48.43 | – | ||||||
| 3C 454.3 | 0.859 | 47.49 | 47.76 | 232 | 48.65 | ||||
| Cen A | 0.002 | 42.54 | 42.70 | 34 | 42.09 |
On average, the INTEGRAL IBIS/ISGRI detected blazars show the following properties. Redshift information is available for 18 of the sources, having an average luminosity of , assuming isotropic emission. 15 sources allowed spectral fitting with , and for 10 blazars the mass of the central black hole has been determined, giving .
The analysis of Fermi/LAT data of the INTEGRAL detected blazars was done using Fermi Science Tools version 9.15.2 and applying the unbinned likelihood analysis. Data were used taken from the beginning of the Fermi mission until November 25, 2009, spanning about 16 months of LAT observations. We used the square root of the Test Statistic (TS) as an indicator for the significance of a source detection, and considered sources with as detected. Out of the 20 blazars listed in Tab. 1, 15 are detectable with a significance in the LAT data analysed here. 11 of these LAT detected sources have already been reported in the Fermi LAT Bright AGN Sample (LBAS) based on the first 3 months of the mission FermiBSC ; LBAS_SED . The four blazars which were not included in that list are QSO B0836+710, H 1426+428, RX J1924.8–2914, and PKS 2149–306.
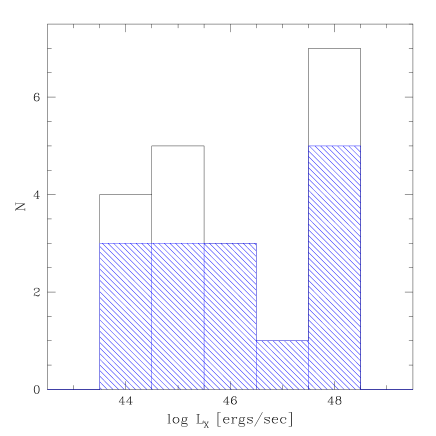
For all the 15 objects for which we have a significant LAT detection, the properties as reported in the INTEGRAL AGN catalogue are an average X-ray luminosity of and a photon index of . Figure 1 shows the histogram of hard X-ray luminosities, as derived from IBIS/ISGRI data, for the INTEGRAL detected blazars. The shaded area indicates those objects which are also detected by the LAT.
In all 15 commonly detected blazars the gamma-ray luminosity in the band is significantly larger than the hard X-ray () one, with an average ratio of .
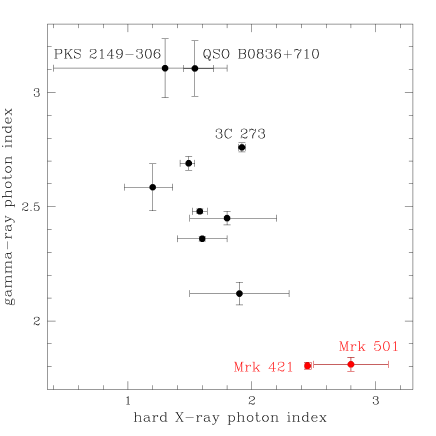
Mrk 421 and Mrk 501 are the only two blazars commonly detected which show a falling spectrum of the spectral energy distribution (e.g. versus diagram) in the X-rays, but a rising one in the gamma-rays. All other objects show a rising X-ray () and a falling gamma-ray spectrum (). Although the data are not simultaneous, this indicates that in Mrk 501 and Mrk 421 we detect the synchrotron branch in the hard X-rays, while the gamma-rays are dominated by the inverse Compton component. In the other cases we see in both, the X- and the gamma-rays, the inverse Compton component with the peak of this component lying in between both bands (). In these cases, the average difference between the photon indices is , with the gamma-ray spectra being steeper. Obviously both, the X-ray and the gamma-ray photon index represent an average over many spectral states during which the photon index and flux can vary significantly – see for example the case of the Fermi/LAT time resolved spectral analysis of 3C 273 3C273Fermi . Figure 2 shows the comparison of the hard X-ray versus the gamma-ray photon index for a single power law fit. The results are consistent with the anti-correlation between X-ray and gamma-ray photon index as found for the Fermi LAT Bright AGN Sample (LBAS) LBAS_SED , although the sample size we present here is not sufficient to confirm the trend. The two objects with the very steep () photon index in the gamma-rays are QSO B0836+710 and PKS 2149–306, two of the fainter blazars which are not included in the LBAS. It can be expected that the ongoing Fermi mission will detect more of these soft gamma-ray blazars which belong to the LBL class as the survey sensitivity improves.
III DISCUSSION
Although the INTEGRAL and Fermi data presented here have not been taken simultaneously, they allow already a rough outline of the spectral energy distribution of this blazar sample. Mrk 421 and Mrk 501 are mainly observed in outburst and they are both high-frequency peaked BL Lac objects, therefore the peak energy of the synchrotron and inverse Compton emission is at higher energies compared to the other blazars. We show as an example the spectral energy distribution of Mrk 421 based on INTEGRAL OMC, JEM-X, and IBIS/ISGRI data together with the Fermi/LAT 16-month average spectrum in Fig. 3. The INTEGRAL data shown here are dominated by an outburst observed in June 2006 Lichti08 , thus the X-ray emission level is about 10 times higher than in recent simultaneous X-ray and gamma-ray observations LBAS_SED .

In Mrk 421 and Mrk 501 the (hard) X-rays are dominated by the synchrotron radiation, while the hard X-rays of the other objects and the gamma-rays of all 15 objects are dominated by inverse Compton emission.
The data presented here show also the potential for simultaneous INTEGRAL observations accompagnying an outburst in the gamma-rays of one of the blazars. Data in outburst often allow to determine the shape of the gamma-ray spectra within less than a week observing time. INTEGRAL observations of blazars in outburst have shown that significant spectra can be taken on time scales of , for example in the case of 3C 454.3 3C454Pian or Mrk 421 Lichti08 .
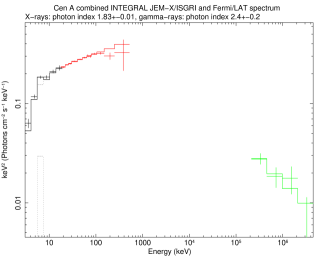
As an example of what a simultaneous INTEGRAL and Fermi observation can provide, we studied the case of Cen A. Although also the data for this low-redshift () radio galaxy are not taken simultaneously, the source shows low variability in the X-rays and gamma-rays, especially when compared to blazars. For the case of Cen A, also INTEGRAL’s monitors JEM-X and OMC provide valuable data. The X-ray and gamma-ray data can be fit by a broken power law model absorbed by , as shown in Fig. 4. The photon index in the X-rays is , the one in the gamma-rays with a break energy at . Note that the combined fit flattens the result for the gamma-ray photon index, which is when analysing the LAT data alone. The value of the break energy has to be taken with caution, as there are no data available between 500 keV and 200 MeV, and studies of the hard X-ray data do not show a significant cut-off Soldi05 . Nevertheless the combined modeling of the data as shown in Fig. 5 gives a reliable estimate for the total energy output in the X-ray to gamma-ray domain of this elusive radio galaxy, with a total unabsorbed flux between 1 keV and 10 GeV of and a luminosity of . In addition, the peak of the spectral energy distribution which in this model appears to be around a few hundred keV is consistent with the observations by CGRO OSSE, COMPTEL, and EGRET, which derived a peak energy around 500 keV for the intermediate emission state CGRO_CenA . The peak flux is lower in our model, with compared to during the CGRO measurement.

IV CONCLUSIONS
Out of the 20 blazars significantly detected within the INTEGRAL AGN catalogue, 75% are already clearly detected by Fermi/LAT within the first 16 months of operation. Although this might appear to be a small fraction when compared to the total number of LAT detected blazars, it can be expected that gamma-ray blazars exhibiting a bright outburst will be detectable by INTEGRAL within 100 - 200 ks. This offers the possibility to constrain the spectral energy distribution between 3 keV and several hundred keV. The example of Cen A, a radio galaxy which is quasi persistent in the X-ray and gamma-ray energy ranges, shows the potential of such a combined INTEGRAL OMC, JEM-X, and IBIS/ISGRI data set. With the on-going Fermi mission one will be able to detect even a larger fraction of hard X-ray blazars, especially those which show soft gamma-ray spectra such as QSO B0836+710 and PKS 2149-306.
INTEGRAL is an ESA satellite open to observation proposals from astrophysicists from all countries. The next call for proposals111see http://www.sciops.esa.int/index.php?project=INTEGRAL in 2010 with a dead line on April 23 (to be confirmed) offers again the possibility to apply for target of opportunity (ToO) observations of Fermi detected blazars in outburst. This way, INTEGRAL data can contribute significantly to the increasing number of well studied outbursts of blazars and help to understand this enigmatic type of AGN.
References
- (1) McNaron-Brown, K., Johnson, W. N., Jung, G. V., et al. 1995, ApJ, 451, 575
- (2) Donato, D., Sambruna, R. M., & Gliozzi, M. 2005, A&A, 433, 1163
- (3) Tueller, J., Baumgartner, W. H., Markwardt, C. B., et al. 2009, ApJS accepted, arXiv:0903.3037
- (4) Beckmann, V., Soldi, S., Ricci, C., et al. 2009, A&A, 505, 417
- (5) Winkler, C., Courvoisier, T. J.-L., Di Cocco, G., et al. 2003, A&A, 411, L1
- (6) Lebrun, F., Leray, J. P., Lavocat, P., et al. 2003, A&A, 411, L141
- (7) Lund, N., Budtz-Jørgensen, C., Westergaard, N. J., et al. 2003, A&A, 411, L231
- (8) Mas-Hesse, J. M., Giménez, A., Culhane, J. L., et al. 2003, A&A, 411, L261
- (9) Abdo, A. A., Ackermann, M., Ajello, M., et al. 2009, ApJ, 700, 597
- (10) Masetti, N., Mason, E., Landi, R., et al. 2008, A&A, 480, 715
- (11) Abdo, A. A., Ackermann, M., Ajello, M., et al. 2009, submitted to ApJ, arXiv:0912.2040
- (12) Soldi, S., Beckmann, V., & Türler, M. 2009, these proceedings, arXiv:0912.2266
- (13) Lichti, G. G., Bottacini, E., Ajello, M., et al. 2008, A&A, 486, 721
- (14) Pian, E., Foschini, L., Beckmann, V., et al. 2006, A&A, 449, L21
- (15) Soldi, S., Beckmann, V., Bassani, L., et al. 2005, A&A, 444, 431
- (16) Steinle, H., Bonnell, J., Kinzer, R. L., et al. 1999, Advances in Space Research, 23, 911