On the Origin of the Galaxy Star-Formation-Rate Sequence: Evolution and Scatter
Abstract
We use a semi-analytic model for disk galaxies to explore the origin of the time evolution and small scatter of the galaxy SFR sequence — the tight correlation between star-formation rate (SFR) and stellar mass (). The steep decline of SFR from to the present, at fixed , is a consequence of the following: First, disk galaxies are in a steady state with the SFR following the net (i.e., inflow minus outflow) gas accretion rate. The evolution of the SFR sequence is determined by evolution in the cosmological specific accretion rates, , but is found to be independent of feedback. Although feedback determines the outflow rates, it shifts galaxies along the SFR sequence, leaving its zero point invariant. Second, the conversion of accretion rate to SFR is materialized through gas density, not gas mass. Although the model SFR is an increasing function of both gas mass fraction and gas density, only the gas densities are predicted to evolve significantly with redshift. Third, star formation is fueled by molecular gas. Since the molecular gas fraction increases monotonically with increasing gas density, the model predicts strong evolution in the molecular gas fractions, increasing by an order of magnitude from to . On the other hand, the model predicts that the effective surface density of atomic gas is , independent of redshift, stellar mass or feedback. Our model suggests that the scatter in the SFR sequence reflects variations in the gas accretion history, and thus is insensitive to stellar mass, redshift or feedback. The large scatter in halo spin contributes negligibly, because it scatters galaxies along the SFR sequence. An observational consequence of this is that the scatter in the SFR sequence is independent of the size (both stellar and gaseous) of galaxy disks.
keywords:
galaxies: evolution – galaxies: formation – galaxies: fundamental parameters – galaxies: haloes – galaxies: high redshift – galaxies: spiral1 Introduction
Understanding the star formation history of the universe is a major goal of modern astronomy. Starting at redshift , the comoving cosmic star formation rate (SFR) density (in units of ) rises by an order of magnitude to (e.g. Lilly et al. 1996; Schiminovich et al. 2005; Hopkins & Beacom 2006; Villar et al. 2008, Sobral et al. 2009), reaches a peak around and declines to higher redshifts (Madau et al. 1998; Pérez-González et al. 2008; Bouwens et al. 2008).
A number of studies have shown that the decline in the comoving cosmic SFR density from to the present is not due to a decline in the major merger rate (Bell et al. 2005; Wolf et al. 2005; Melbourne et al. 2005; Lotz et al. 2008; Sobral et al. 2009). Rather, since the majority of all stars seem to form in galactic disks (at least below ), it is generally believed that the drop in comoving cosmic SFR density from to the present is related to ’quiescent’ processes, e.g., gas consumption and/or a reduced rate of accretion of fresh gas from the cosmic web.
Great progress is currently being made in measuring molecular gas masses in high redshift galaxies (e.g. Tacconi et al. 2006, 2008, 2010; Daddi et al. 2008, 2009b). These studies indicate that the ratio between molecular gas and stellar mass was higher in the past. However, uncertainty in the conversion factor between CO luminosity and molecular gas mass limits the current accuracy of these measurements. In addition there are at present no direct observations of atomic gas masses or gas accretion rates in high redshift galaxies, and thus the origin of the decline in SFRs since is not yet understood.
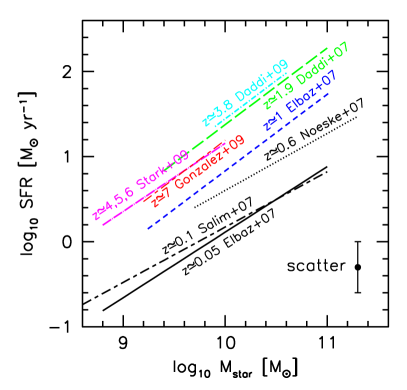
A step forward in the characterization of the evolution of galaxy SFRs was the discovery of a relatively tight correlation between galaxy SFR and stellar mass (), with a slope just below unity and an intrinsic scatter dex (Noeske et al. 2007a; Elbaz et al. 2007; Daddi et al. 2007; Salim et al. 2007). Throughout this paper we refer to this correlation as the SFR sequence. The zero point appears roughly constant from to (Daddi et al. 2009a; Stark et al. 2009; Gonzalez et al. 2009), and evolves to lower SFR from to (Daddi et al. 2007). See Fig. 1 and Table LABEL:tab:obs for a summary of the observational data. The scatter of the SFR sequence appears to be invariant with redshift, while there is some indication that the slope is shallower at lower redshifts.
The two main questions that we address in this paper are:
-
1.
What is the physical cause of the decline in the specific star formation rate (SSFR=SFR/) since ?
-
2.
Why does the SFR sequence have such a small scatter?
A plausible explanation for the decline in SSFR since is a decline in the gas accretion rate onto galaxies. For dark matter haloes the specific accretion rate scales as for (Birnboim, Dekel, & Neistein 2007). Furthermore, scatter in the gas accretion rates from cosmological simulations is about 0.3 dex (Dekel et al. 2009). Thus the decline in SSFR as well as the small scatter could be driven entirely by the properties of gas accretion. However, for this to be the case, a mechanism is needed to explain why the star formation rate should follow the gas accretion rate.
To get some insight into this problem, we assume that the star formation rate surface density follows a Schmidt-Kennicutt (SK, Schmidt 1959, Kennicutt 1998) law:
| (1) |
and that the gas surface density follows an exponential distribution:
| (2) |
where is the central surface density of the gas, and is the scale length of the gas disk. The SFR is then given by
| (3) | |||||
| (4) |
Thus, for , the mechanism which converts higher accretion rates into higher star formation rates is either an increase in the gas masses or an increase in the gas surface densities.
There is a significant scatter ( dex) in the sizes of galactic stellar disks at a given stellar mass or luminosity (e.g. Shen et al. 2003; Courteau et al. 2007), which corresponds to a scatter in disk surface density of dex. If the surface density of gas is correlated with that in stars, then the observed amount of scatter in the surface densities of stellar galactic disks would imply a scatter of 0.14-0.2 dex in SSFR (assuming ), and even larger scatter for a higher . Thus galaxy size could be an important contributor to the scatter in the SFR sequence.
| Redshift | Redshift range | SFR0 | slope | Mass range | original IMF | Reference |
|---|---|---|---|---|---|---|
| 0.06 | 0.015-0.10 | 1.29 | 0.77 | 8.8-11.1 | Salpeter | Elbaz et al. (2007) |
| 0.10 | 0.005-0.22 | 1.48 | 0.65 | 8.0-11.3 | Chabrier | Salim et al. (2007) |
| 0.36 | 0.20-0.45 | 0.67 | 9.7-11.3 | Chabrier | Noeske et al. (2007a) | |
| 0.58 | 0.45-0.70 | 0.67 | 9.7-11.3 | Chabrier | Noeske et al. (2007a) | |
| 0.78 | 0.70-0.85 | 0.67 | 10.0-11.3 | Chabrier | Noeske et al. (2007a) | |
| 0.98 | 0.85-1.10 | 0.67 | 10.0-11.3 | Chabrier | Noeske et al. (2007a) | |
| 1.0 | 0.80-1.20 | 6.80 | 0.90 | 9.3-11.1 | Salpeter | Elbaz et al. (2007) |
| 1.9 | 1.4-2.5 | 23.77 | 0.90 | 9.5-11.1 | Salpeter | Daddi et al. (2007) |
| 3.8 | 3.1-4.4 | 29.3 | 0.90 | 9.9-10.6 | Chabrier | Daddi et al. (2009a) |
| 3.96 | 3.67-4.25 | 8.8-10.3 | Salpeter | Stark et al. (2009) | ||
| 4.79 | 4.54-5.04 | 8.8-10.1 | Salpeter | Stark et al. (2009) | ||
| 6.01 | 5.76-6.26 | 9.1-9.8 | Salpeter | Stark et al. (2009) | ||
| 7.3 | 6.9-7.7 | 15.52 | 9.2-10.0 | Salpeter | Gonzalez et al. (2009) |
In this paper we use the semi-analytic disk galaxy evolution model of Dutton & van den Bosch (2009) to study the evolution and scatter of the SFR sequence. In §2 we give a brief overview of the galaxy evolution model. In §3 we discuss the evolution of the zero point of the SFR sequence, and whether it is driven by gas accretion rate, gas fractions or gas density. The scatter in the SFR sequence is addressed in §4, while §5 discusses why the SFR sequence is independent of feedback. We summarize our results in §6.
2 Disk Galaxy Evolution Model
Here we give a brief overview of the disk galaxy evolution model used in this paper. A more detailed description of this model is given in Dutton & van den Bosch (2009; hereafter DB09).
The key difference with traditional semi-analytic models (e.g. Kauffmann et al. 1993; Cole et al. 1994,2000; Somerville & Primack 1999; Hatton et al. 2003; Cattaneo et al. 2006; Croton et al. 2006) is that in this model the inflow (due to gas cooling), outflow (due to supernova driven winds), star formation rates, and metallicities, are all computed as a function of radius, rather than being treated as global parameters. This allows us to follow self consistently the growth of gaseous and stellar galactic disks, and to split the gas disk into atomic and molecular phases. Our model should thus be considered in the context of previous models of this type (e.g. Kauffmann 1996; Avila-Reese et al. 1998; Firmani & Avila-Reese 2000; van den Bosch 2001,2002).
The main assumptions that characterize the framework of our models are the following:
-
1.
Dark matter haloes around disk galaxies grow by the smooth accretion of mass which we model with the Wechsler et al. (2002) mass accretion history (MAH). The shape of this MAH is specified by the concentration of the halo at redshift zero;
-
2.
Dark matter haloes are assumed to be spherical and to follow a density distribution given by the NFW profile (Navarro, Frenk, & White 1997), which is specified by two parameters: mass and concentration. However, halo concentration is known to be correlated with halo mass, and we use mass dependence and evolution of the concentration parameter given by the Bullock et al. (2001a) model with parameters (Macciò et al. 2008) for a WMAP 5th year cosmology (Dunkley et al. 2009);
-
3.
Gas that enters the halo is shock heated to the virial temperature, and acquires the same distribution of specific angular momentum as the dark matter (van den Bosch et al. 2002). We use the angular momentum distributions of the halo as parametrized by Bullock et al. (2001b) and Sharma & Steinmetz (2005);
-
4.
Gas cools radiatively, conserving its specific angular momentum, and forms a disk in centrifugal equilibrium. Cooling rates are computed using the cooling functions of Sutherland & Dopita (1993) under the assumption of collisional ionization equilibrium;
-
5.
Star formation is assumed to take place in dense molecular gas. In order to compute the density of molecular gas, we follow Blitz & Rosolowsky (2006) and relate the molecular gas fraction to the midplane pressure in the disk. For completeness, a detailed description of our star formation prescription is given in Appendix A, where we show that it yields a SK star formation law that is truncated at low , in good agreement with observations;
-
6.
Supernova (SN) feedback re-heats some of the cold gas, ejecting it from the disk and halo. We assume that ejected gas is lost forever. We consider two feedback models, one driven by energy (e.g. Dekel & Silk 1986), the other by momentum (e.g. Murray, Quataert, & Thompson 2005). For both models we assume that the outflow moves at the local escape velocity of the disk-halo system, . The key difference between these two models is the dependence of the mass loading factor, (ratio between outflow mass rate and star formation rate), on wind velocity. For the energy driven wind , whereas for the momentum driven wind . Note that since the escape velocity typically varies with galacto-centric radius, so do does the mass loading factor.
-
7.
Stars eject metals into the inter-stellar medium, enriching the cold gas;
-
8.
Bruzual & Charlot (2003) stellar population synthesis models are convolved with the star formation histories and metallicities to derive photometric fluxes in different pass bands.
Each model galaxy consists of five mass components: dark matter, hot halo gas, disk mass in stars, disk mass in cold gas, and ejected gas. The dark matter and the hot gas are assumed to be distributed in spherical shells, the disk mass is assumed to be in infinitesimally thin annuli. Throughout this paper we refer to as radius, as time (where is defined as the Big Bang) and as redshift.
For each galaxy we set up a radial grid with 200 bins quadratically sampled from between 0.001 and 1 times the redshift zero virial radius. As described in DB09 for the purpose of conserving angular momentum it is more convenient to use a grid in specific angular momentum, . We convert the initial grid in , to a grid in using , where is the halo mass enclosed within a sphere of radius . We follow the formation and evolution of each galaxy using 400 redshift steps, quadratically sampled from to . For each time step we compute the changes in the various mass components in each radial bin.
2.1 Limitations of the Model
Our model makes several simplifying assumptions about the physical processes that occur during disk galaxy formation (mergers, gas accretion, star formation, feedback, adiabatic contraction). In some cases it is because the correct physics is unknown, in other cases it is because modeling all of the details adds extra complication to the model without necessarily improving our understanding. A discussion of these assumptions and the limitations they imply to our model are given in DB09. Here, and in Appendix B, we focus on the issue of gas accretion, and specifically the differences between the classical “hot mode” vs. the new “cold mode” accretion models.
Our assumption about the way gas is accreted into galaxies (by a cooling flow of shock heated has) is likely incorrect. Simulations suggest that disk galaxies accrete most of their mass through cold flows, and that in the absence of extra heating or outflows the baryon fraction of galaxies is close to the universal value (Birnboim & Dekel 2003; Keres et al. 2005; Dekel & Birnboim 2006). As we discuss in Appendix B, for haloes with masses below , the cooling time is short compared to the free fall time, and thus the accretion rates onto the central galaxy are the same in the classical cooling model as in the cold mode model. The key difference between these two accretion models occurs for high mass haloes at high redshifts. In this regime the accretion rates are low in the classical cooling model because cooling is inefficient, but the accretion rates can be high in the cold mode model because accretion rates are dominated by cold streams penetrating the hot halo (Dekel et al. 2009). Thus our results for the cold gas accretion rates onto galaxies with stellar masses less than about are not expected to be effected by us ignoring the phenomenon of cold streams.
It is possible that the angular momentum acquired by galaxies may be different in the hot mode and cold mode accretion models. However, non-radiative cosmological hydrodynamical simulations (e.g. van den Bosch et al. 2002; Sharma & Steinmetz 2005) have shown that the specific angular momentum of the gas and dark matter halo are very similar, which can be understood from the fact that both have experienced the same torques. Thus as long as most of the baryons accrete onto the central galaxy (as is the case for galaxies in haloes below ) then the available angular momentum is expected to be the same in the hot mode and cold mode accretion models.
2.2 Overview of model parameters
In this paper we consider three models that only differ in their treatment of feedback and the amount of angular momentum loss. In addition to a model without feedback (NFB), we consider a model with energy driven feedback (EFB) and one with momentum driven feedback (MFB). The parameters of these models have been tuned as little as possible. The NFB model has no tuning. The MFB and EFB models have their respective feedback efficiencies and amount of angular momentum loss tuned to reproduce the zero points of the rotation velocity - stellar mass and stellar disk size - stellar mass relations at redshift zero. For the MFB model this results in maximal feedback and no angular momentum loss, for the EFB model this results in 25% feedback efficiency and 30% angular momentum loss. Details of these models, as well as the resulting galaxy scaling relations (rotation velocity - stellar mass, stellar disk size - stellar mass, gas fraction - stellar mass, gas metallicity - stellar mass) and disk structural properties, are discussed in DB09 and Dutton (2009). As a summary, the MFB and EFB models reproduce the scaling relations reasonable well, while the NFB model does not reproduce any of the scaling relations.
The input parameters of our models are as follows.
(1) Cosmology: , , , , . In this paper we adopt a flat cosmology motivated by the 5th year WMAP results (Dunkley et al. 2009). In particular, we adopt , , and .
(2) Dark Halo structure: . We assume that the concentrations of dark matter haloes of a given mass, , follow a log-normal distribution with median from the Bullock et al. (2001a) model, parametrized by and , and scatter . Whenever this model yields we set . This parametrization nicely reproduces the distribution of halo concentrations of relaxed dark matter haloes in cosmological N-body simulations (e.g. Wechsler et al. 2002; Macciò et al. 2007, 2008; Zhao et al. 2009).
(3) Angular momentum distribution: , , , . We assume that the spin parameters of dark matter haloes of a given mass, , follow a log-normal distribution with median and scatter (Bullock et al. 2001b). For our models with no outflows and momentum driven outflows we adopt the cosmological value for relaxed haloes (Macciò et al. 2008), while for our model with energy driven outflows we assume that 30% of the angular momentum has been lost, so that . This choice of is made to reproduce the zero point of the stellar disk size - stellar mass relation (see DB09), and is motivated by the fact that baryons tend to lose specific angular momentum in hydrodynamical cosmological simulations (e.g. Navarro & Steinmetz 2000; Piontek & Steinmetz 2009). We assume that the specific angular momentum distribution of both dark matter and gas in a halo of given mass and spin parameter is given by the fitting function presented in Sharma & Steinmetz (2005), which is parametrized by a single parameter, . Based on their numerical simulations, we assume that the distribution of is log-normal, with a median and scatter . We note that the parametrization of the angular momentum distribution by Bullock et al. (2001b), which is specified by , results in very similar disk density profiles as the Sharma & Steinmetz (2005) parametrization, except for the extremes of the distribution of and (see Dutton 2009).
(4) Star formation: . Our star formation prescription (see Appendix A), is parametrized by a single free parameter, , which sets the normalization of at a given surface density of dense molecular gas. We tune this parameter so that we reproduce the normalization of the empirical SK star formation law, which gives .
(5) Feedback: , , , , . For the energy driven wind model the mass loading factor is given by , while for the momentum driven wind model . We adopt an energy per supernova of erg, a momentum per supernova of , and a supernova rate of per Solar mass of stars formed. For our energy driven outflow model we adopt (i.e. 25% of the SN energy ends up in the outflow) and for our momentum driven outflow model we adopt (i.e. 100% of the SN momentum ends up in the outflow). The no feedback model has .
(6) Stellar populations and chemical enrichment: , and the choice of initial mass function (IMF). We assume that the baryonic gas that is accreted by a dark matter halo has a Helium mass abundance of 0.25 and an initial metallicity of . Contrary to DB09, where we adopted the instantaneous recycling approximation (IRA), here we calculate the amount of recycled gas as a function of time by convolving the star formation history with the return fractions from the BC03 models. At low redshifts this makes no difference to the final stellar masses, but at high redshifts the IRA over-estimates the return fraction and hence under-estimates the stellar masses. For simplicity, we still use the IRA for the chemical evolution, using a stellar yield of appropriate for the Chabrier (2003) IMF adopted throughout.
3 Origin of the Zero-Point Evolution of the SFR Sequence
3.1 Summary of observations
The observational measurements of the SFR sequence from low to high redshifts that we use in this paper are summarized in Table LABEL:tab:obs and Fig. 1. The slope of the SFR sequence defined as is . Shallower slopes tend to be measured at low redshifts (Elbaz et al. 2007; Noeske et al. 2007; Salim et al. 2007; Schiminovich et al. 2007; Bothwell et al. 2009). Studies above tend to find steeper slopes of around 0.9, in particular the recent study by Pannella et al. (2009) finds a slope of at for stellar masses in the range . It is not clear if this implies an evolution of the slope, or is due to a systematic difference in SFR indicators or sample selection used at different redshifts. The intrinsic scatter is somewhat uncertain, but is estimated to be dex (e.g. Noeske et al. 2007a; Elbaz et al. 2007; Daddi et al. 2007). The zero-point evolves by a factor of from redshift to , but is roughly constant from to . Note, though, that the high redshift data have not been corrected for extinction as observations indicate that there is little or no extinction in these galaxies (Gonzalez et al. 2009). Nevertheless, we caution that the observed SFRs at may have been underestimated.
These relations assumed either a Salpeter IMF or a Chabrier (2003) IMF, as indicated in Table LABEL:tab:obs. For consistency, we correct the stellar masses and SFRs to a Chabrier (2003) IMF by subtracting 0.25 dex (e.g. Gonzalez et al. 2009). Given that the slope of the SFR sequence is close to unity, both Salpeter and Chabrier (2003) IMF’s result in very similar zero-points to the SFR sequence.
3.2 Comparison with observations
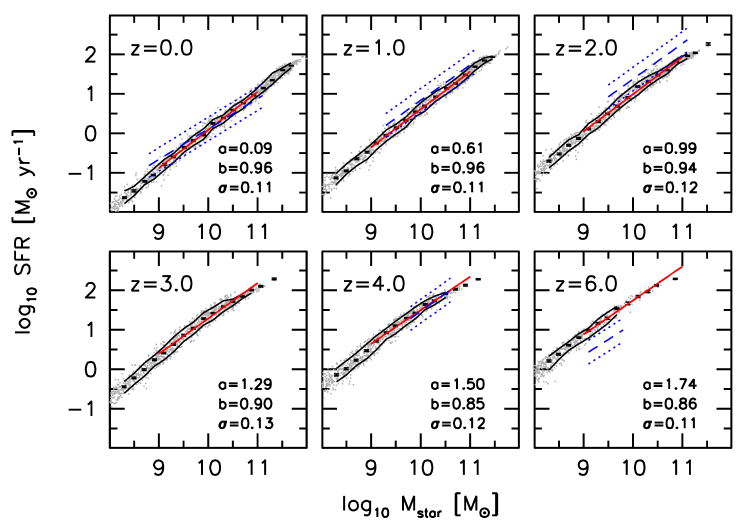
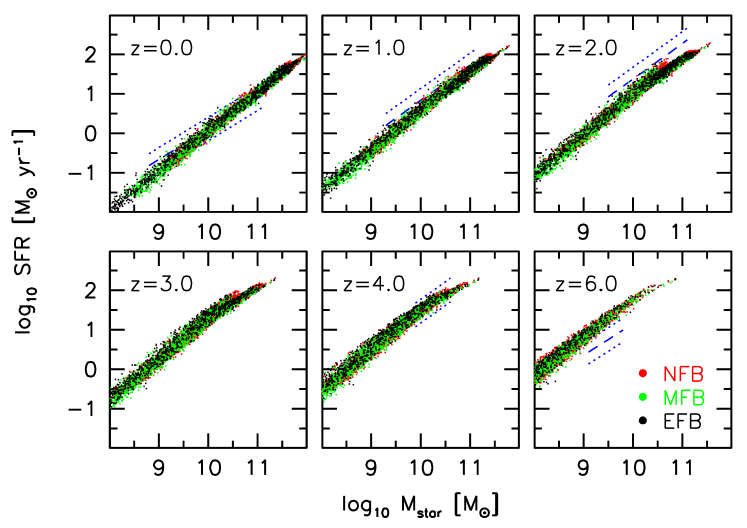
Fig. 2 shows the SFR sequence at redshifts and for our model with energy driven feedback (EFB). The red solid lines show power-law fits to the SFR sequence for stellar masses between , with slope (), zero point () and scatter () as indicated. The black error bars show the median SFR in stellar mass bins of width 0.2 dex. The solid black lines enclose 68% of the model data in each stellar mass bin, and indicate that the scatter in independent of mass. The model galaxies have been uniformly sampled in redshift zero halo mass (with ). At high redshifts the tail of galaxies to high stellar masses is caused by scatter in the MAH. In particular, the highest mass galaxies at high redshifts () are all in early forming (high concentration) haloes.
The observed relations are shown by blue lines. Dashed lines show the mean, dotted lines show the scatter, where we have adopted a scatter of 0.3 dex. Note that the model scatter is significantly smaller than this ( dex), but is independent of mass and redshift. We do not consider this a serious problem for the model, given that the systematic uncertainties in the data are likely to be significant (i.e., the observed scatter has to be considered an upper limit on the intrinsic scatter). In addition, it is likely that our model underestimates the true scatter due to our simplified treatment of the halo mass accretion history (i.e. the assumption that there is a one-to-one relation between MAH and halo concentration). For example cosmological hydrodynamical simulations find a scatter of about 0.3 dex in the gas accretion rates in haloes of mass at (Dekel et al. 2009). Such a scatter in gas accretion rates would explain the full observed scatter in the SFR sequence.
The slope of the SFR sequence in our model is close to but less than unity, and evolves to slightly lower values at higher redshifts. In fact, the model slope seems to be somewhat too steep compared to the data at . It remains to be seen whether this discrepancy holds up with better data coming available.
Fig. 3 shows the SFR sequence for our three feedback models: no feedback (red); momentum driven feedback (green); and energy driven feedback (black). This shows that the slope, zero point and scatter of the SFR sequence are all independent of the feedback model! This feature is remarkable because every other galaxy scaling relation depends quite significantly on the detailed treatment of feedback (e.g. van den Bosch 2002; DB09; Dutton 2009). The origin of this intriguing characteristic of the SFR sequence is discussed in §5 below.
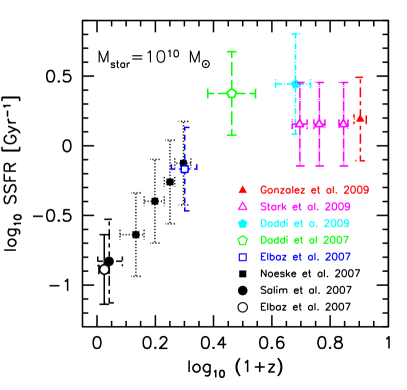
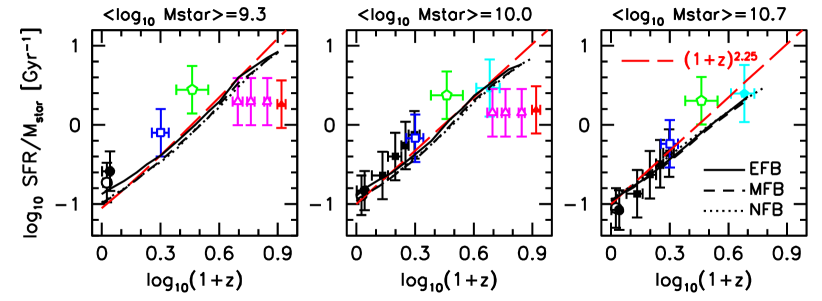
Fig. 4 shows the evolution in the specific star formation rate (SFR/) at three stellar masses: (left-hand panel), (middle panel), and (right-hand panel). The data (described above) are shown as symbols, while the black lines indicate our models (solid line, EFB; dashed line, MFB; dotted line, NFB). Note that the models predict substantial evolution in the SSFRs, in rough overall agreement with the data, and that there is very little difference between the three different models (as also seen in Fig. 3). There is some indication that the models systematically under predict the SSFRs at , especially for the less massive galaxies. This may signal a potential shortcoming of the models, though it seems also possible that the observations have over-estimated the SSFRs due to sample selection effects or other systematics (see Davé 2008 for a discussion of systematic effects in SFRs and stellar masses).
The discrepancies between the SSFRs in our models and the data at are of similar (but smaller) magnitude and direction as found by Davé (2008), using cosmological hydrodynamical simulations. Davé (2008) proposed that an evolving IMF could reconcile the data with theory. A key prediction of this evolving IMF model is that the discrepancy between the observed and predicted (with fixed IMF) SSFRs should increase monotonically with redshift. However, since the work by Davé (2008) a number of observational studies have presented SSFRs at (Daddi et al. 2009a; Stark et al. 2009; Gonzalez et al. 2009). In particular, the study of Daddi et al. (2009a) measured the SFR sequence for B-band dropouts at , which were found to be only marginally higher than those measured at . Our models match this data point remarkably well. This suggests that the discrepancy at is not due to a variable IMF, at least not as in the model advocated by Davé (2008).
Current observations indicate that the SSFRs are constant from redshifts to . This is on stark contrast with our models, which predict that the SSFRs decrease monotonically with decreasing redshift. Even though the models reproduce the observed SSFRs at , at the discrepancy between the models and the observations is a factor of . As mentioned in §3.1 these very high-redshift data have not been corrected for dust extinction, and thus if there is substantial extinction in very high redshift galaxies (as there is in lower redshift galaxies), then this could reconcile observation with theory.
3.3 What drives the evolution in the zero point of the SFR sequence?
Having established that our models reproduce the decrease in SSFRs by a factor of from redshifts to , we now address the question: what drives this evolution?
3.3.1 Gas accretion rate?
It has been pointed out by previous authors (e.g. Noeske et al. 2007b) that the decline of the SFRs at a given is compatible with the cosmological decline in the accretion rate onto dark matter haloes, which scales roughly as at a fixed halo mass (Birnboim, Dekel, & Neistein 2007). Note that the actual slope of the specific accretion rate varies from 2 at to 2.5 at high redshift (Neistein & Dekel 2008).
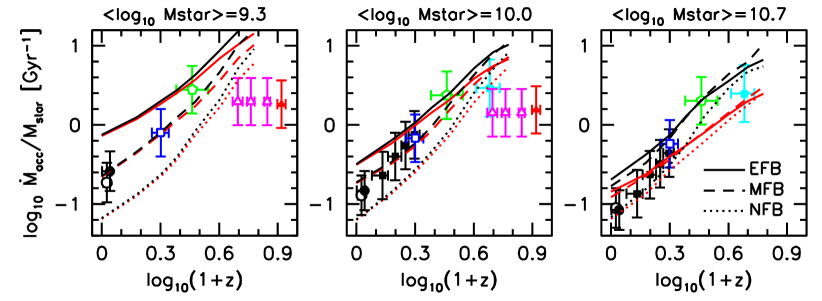
Fig. 5 shows the evolution of the baryon accretion rate onto the halo () vs. redshift (black lines) and the evolution of the cold gas accretion rate onto the galaxy () (red lines). As expected from Figs. 17 & 18, these two curves only differ significantly at high stellar masses (), where the cooling time becomes larger than the free fall time. We note that cold streams are likely to eliminate this difference. For comparison, the observed evolution in star formation rates are shown as colored symbols (as in Fig. 4). The main outcome is that the evolution in the baryon/cold gas accretion rate closely follows the evolution in the star formation rate (both for the models as well as in the data). This confirms that a plausible explanation for the decline in the SSFRs of galaxies is simply a decline in the specific gas accretion rate. However, the zero point is dependent on the feedback model, especially for lower stellar masses. This is because feedback is more efficient at removing baryons from lower mass haloes. For a given stellar mass, the halo mass will be higher for models with stronger feedback. Since higher mass haloes have higher baryon accretion rates (in absolute terms), the models with stronger feedback have higher specific baryon accretion rates.
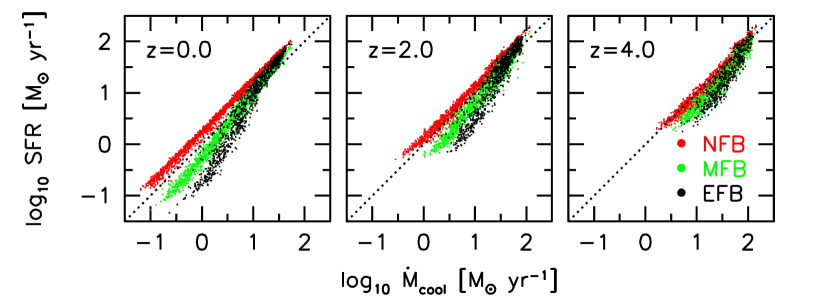
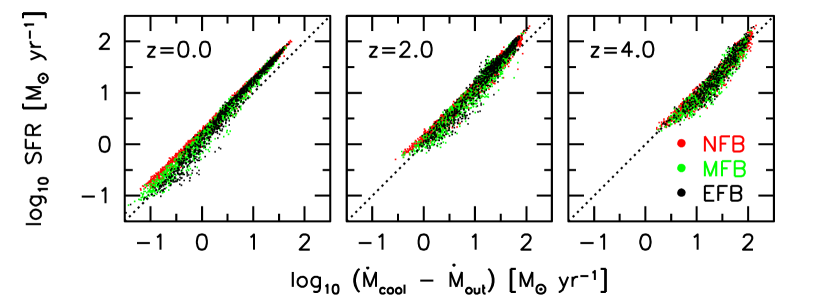
The upper panels of Fig. 6 show the SFR vs. the cold gas accretion rate onto the galaxy, , for our three feedback models. For the NFB model without outflows, there is an almost 1:1 correspondence between the SFR and inflow rate. However, for models with outflows (MFB and EFB), the relation between SFR and inflow rate has a slope greater than unity, with a steeper slope for the EFB model than for the MFB model. The differences between the three models are largest at low accretion rates, which correspond to low mass haloes, and hence where the specific outflow rates are highest. This suggests that the net inflow rate might correlate better with the SFR. This is indeed the case, as shown in the lower panels of Fig. 6. Thus we conclude that galaxy disks are in a steady state in which the star formation rate is roughly equal to the net gas inflow rate. This conclusion can also be derived by solving the differential equation for change in gas mass with time (Bouche et al. 2009).
3.3.2 Gas masses or gas densities?
We have shown that the decline in net gas accretion rate can explain why SSFRs decline with time, but this does not explain how the decline in gas accretion rate is converted into a decline in the SSFRs. Recall that, as discussed in the introduction, the evolution of the star formation rate at a given stellar mass is expected to depend on the change in gas mass and/or gas density at that stellar mass. A factor 20 decrease in SFR needs a factor 20 decrease in gas mass, or a factor 400 decrease in gas surface density (assuming a SK star formation law with ) or factor of 20 decrease in gas surface density (for a SK law with ). Note that while the global SK law has a slope of , for spiral galaxies the spatially resolved SK law typically has (Bigiel et al. 2008, and references therein) as thus it may be the more appropriate value to use to estimate the required evolution in gas disk density.
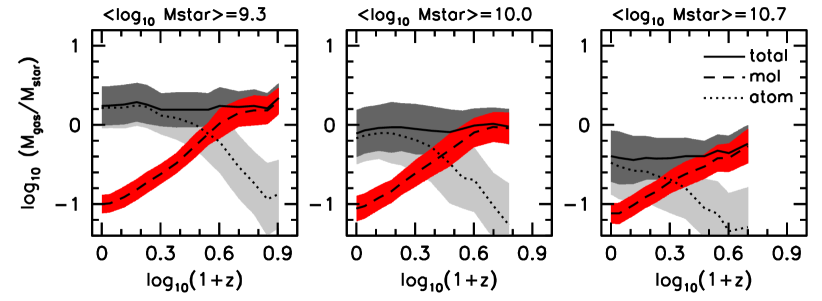
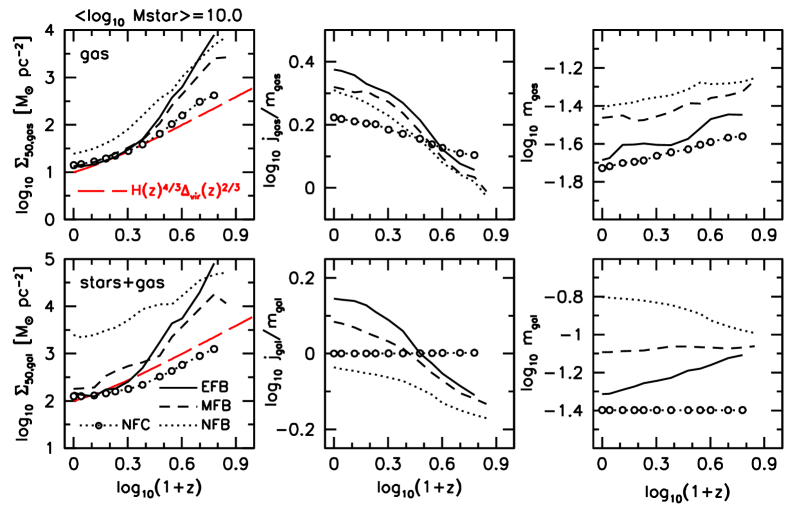
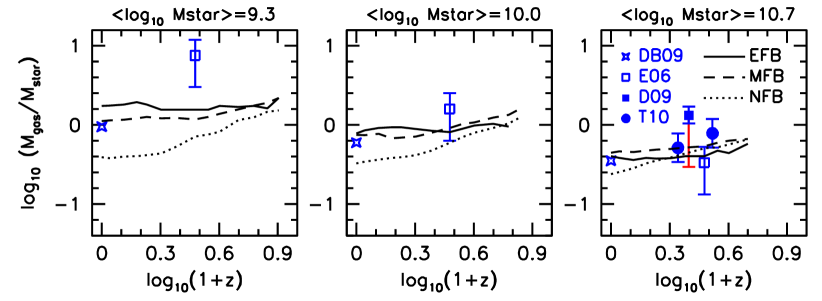
Fig. 7 shows the evolution in the cold gas to stellar mass ratio, , where cold gas is both atomic and molecular. In all models the evolution is weak, especially for the two models with outflows (solid and dashed lines). The outflow models also reproduce the cold gas fractions at redshift , whereas the no feedback model (dotted lines) systematically under-predicts the cold gas masses at all stellar masses. At high redshifts the observations are not direct and thus carry significant uncertainties. At , Erb et al. (2006) derive gas masses from the SK star formation law. In addition to the systematic uncertainties (such as uncertainties in gas disk sizes, star formation rates, and stellar masses) inherent in these measurements there are concerns about sample selection. Since the Erb et al. (2006) sample is UV selected, it may be biased towards gas rich, high star formation rate galaxies, especially at lower stellar masses. Given these uncertainties, we consider our models are not necessarily in disagreement with the observations.
At , Daddi et al. (2009b) detected the CO[2-1] line for 6 star forming galaxies, and inferred a mean gas mass fraction of . These gas fractions are higher than predicted by our model. However, there is a large uncertainty (a factor of ) in the conversion factor, , between CO luminosity and molecular gas mass. Daddi et al. (2009b) attempt to infer using dynamical models, but these involve many assumptions, including the (unknown) dark matter fraction, and thus do not robustly constrain . We note that even with the high advocated by Daddi et al. (2009b) this only results in a factor of decrease in gas masses between and . A factor of decrease in gas masses is required for change in gas fractions to explain the factor of decrease in SSFR between and .
More recent observations (Tacconi et al. 2010) have detected the CO[3-2] line for 19 massive () star forming galaxies at redshifts and , finding mean molecular gas fractions of and , respectively. These measurements fall between those of Erb et al. (2006) and Daddi et al. (2009b), and are thus also consistent with our models.
We conclude that the current observations of gas fractions are consistent with weak or no evolution between and , as our models predict. But obviously this needs to be confirmed with direct observations of atomic and molecular gas masses at high redshifts, for larger samples of star forming galaxies and over a wider range of stellar masses.
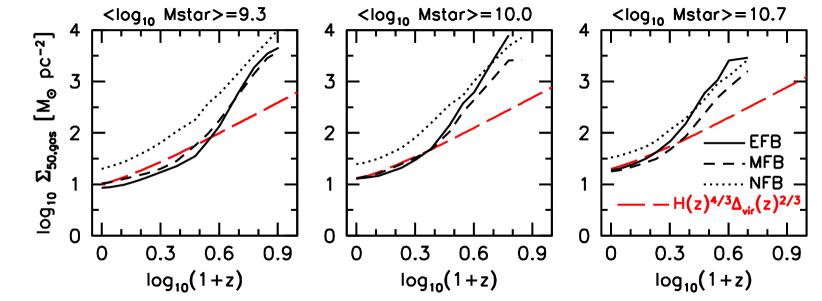
Fig. 8 shows the evolution in the effective gas surface density, which we define as the mean gas density within the radius enclosing half of the cold gas mass: , where is the half mass radius of the gas. In our models the gas density shows very strong evolution: a factor of from to , and a factor of from to . It is thus the increase in the density of the gas that provides the mechanism for turning the higher net gas accretion rates at high redshifts into higher star formation rates, at least in our models.
3.3.3 Why are high redshift disks denser?
Obviously this poses the question why gas disks at higher redshifts have higher surface densities. A crude approximation to the evolution of disk sizes, , can be made by assuming that 1) galaxies have flat rotation curves and 2) that the disk spin parameter, , is independent of redshift. In that case, the disk size scales with the size of the dark matter halo according to (Mo, Mao, & White 1998). The size of the halo scales with mass and redshift as . Here is the Hubble parameter and is the overdensity of the halo with respect to the critical density of the Universe. Thus if the size and mass of the gas disk are proportional to those of the halo, then the density of the gas disk scales as at fixed halo mass. This scaling is shown (with arbitrary normalization) as the red long-dashed lines in Fig. 8. Our model roughly follows this scaling at (depending on stellar mass). For higher redshifts, however, our model predicts an evolution in density that is significantly stronger. This indicates that there are other effects in our model that drive the evolution of gas densities besides simply halo density evolution. As discussed in Appendix C the predominant additional effect is a decrease in the disk specific angular momentum at high redshifts.
It should be noted that in our models the gas densities are higher at higher redshift because the half mass radii are smaller. An equivalent effect could in principle be achieved if gas disks at high redshift were considerably more clumpy than low redshift gas disks of the same stellar mass. The clumpiness could result in a larger fraction of the gas disk being above the threshold for efficient molecular gas formation, and thus result in higher molecular gas masses and higher star formation rates, even though the sizes of the gas disks may not be significantly smaller than at lower redshifts. This may be relevant given recent observational and theoretical evidence for clumpy disks at high redshifts (e.g. Elmegreen et al. 2007; 2009; Agertz, Teyssier, & Moore 2009; Ceverino, Dekel, & Bournaud 2009; Dekel, Sari, & Ceverino 2009).

3.3.4 Molecular vs. atomic gas
We have shown that while the gas fractions show only weak evolution with redshift, gas densities are much higher at higher redshift. Hence, one would expect that the molecular gas fractions will also be higher at higher redshift. Fig. 9 shows the ratios of total, atomic and molecular gas to stellar mass for the EFB model as functions of redshift. As expected, at a fixed stellar mass, the molecular gas masses increase by an order of magnitude from low to high redshift, whereas the atomic gas masses decrease by a corresponding amount. Recent observations of molecular gas masses in star forming galaxies at redshifts support this result (Daddi et al. (2009b); Tacconi et al. 2010). Given that the Schmidt star formation law for molecular gas has a slope (e.g. Bigiel et al. 2008), this implies that the SFRs are roughly proportional to molecular gas mass (Eq.4). Thus the increase in molecular gas fraction provides the fuel for the higher star formation rates at higher redshifts.
Fig. 10 shows the evolution in the effective gas surface density for the EFB model. The solid line corresponds to the total gas as in Fig. 8. The dashed lines show the molecular gas density, while the dotted lines show the atomic gas density. The molecular gas density shows a strong evolution with redshift, whereas the atomic gas density remains roughly constant at all the way from to .
In the near future the Atacama Large Millimeter/submillimeter Array (ALMA) will have the sensitivity to test our theoretical prediction that the molecular gas densities and molecular gas fractions of disk galaxies increase strongly with redshift. A test of our predictions for the evolution of the mass fractions and densities of atomic gas, however, most likely will have to wait for the Square Kilometer Array (SKA), which is currently scheduled to start operation no earlier than 2018. In the meantime, measurements of HI column densities from damped Ly systems (DLAs) provide a means of measuring the atomic gas content of high redshift galaxies. The analysis of 738 DLAs by Prochaska & Wolfe (2009) suggests that HI disks have not evolved significantly since . Although in agreement with our model predictions, a more detailed comparison between the observed DLA column densities and our model predictions is needed to assess whether they are indeed consistent with each other.
In summary, the increase in net gas accretion rate from low to high redshift provides the means for the SFRs to increase at a fixed stellar mass. The mechanism for converting this elevated gas accretion rate into an elevated star formation rate is an increase in gas density, not an increase in gas mass. Increased gas density, mainly due to the fact that haloes are denser at higher redshifts, results in increased molecular gas fractions, which provides the increased fuel supply for the higher SFRs at high redshifts.
4 Origin of scatter in the SFR sequence
In this section we address the question of why the scatter in the SFR sequence is so small. In our model there are 3 sources of scatter: halo concentration, , halo spin, , and halo AMD, . We assume the scatter in these three parameters are independent of each other, and independent of redshift.
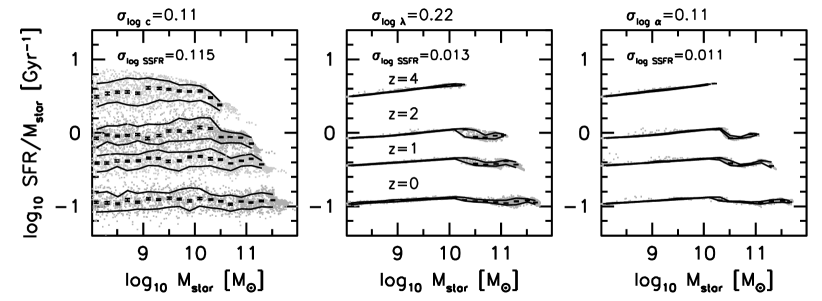
Fig. 11 shows the SFR sequence (expressed in terms of SSFR vs. ) at redshifts , and for the EFB model. Each model has only one source of scatter: halo concentration (0.11 dex) halo spin (0.22 dex), halo AMD (0.11 dex). This shows that the scatter in the SFR sequence, at all redshifts is dominated by the scatter in halo concentration, and rather remarkably, shows only a very weak dependence on halo spin or AMD.
4.1 Why does the scatter in the SFR sequence depend on halo concentration?
In our model the concentration of the dark halo is directly coupled to the mass accretion history (MAH) of the dark matter halo (see DB09 for details). In order to assess the relative importance of scatter in MAH vs. scatter in halo concentration, we have also run models in which the concentration is decoupled from the MAH. These show that scatter in the halo concentration parameter contributes only a small amount to the scatter in the SFR sequence. Thus it is mainly the variations in the MAHs that dominates the scatter in the SFR sequence, at least in our models. Higher concentration halos have MAHs shifted to earlier times (i.e., these haloes assemble their mass earlier), and vice versa for lower concentration halos. An earlier MAH results in higher baryon accretion rates at high redshifts, which in turn implies higher SFRs, but also a larger stellar mass.
In our model the scatter in MAH is determined by scatter in halo concentration, which is 0.14 dex of all haloes (Bullock et al. 2001a) and just 0.11 dex for relaxed haloes (Wechsler et al. 2002; Macciò et al. 2007). Since we adopt a smooth MAH, and we assume a one-to-one correspondence between halo concentration and formation redshift, it is likely that our model underestimates the true scatter in baryon accretion rates onto central galaxies. Determining the true scatter requires cosmological hydrodynamical simulations. The simulations used in Dekel et al. (2009) find a scatter of about 0.3 dex in the gas accretion rates onto galaxies in haloes of mass at . Assuming this scatter translates linearly into scatter in SSFR (as in our models) this would reproduce the full observed scatter in the SFR sequence. Further studies are needed to quantify the mass and redshift dependence of this scatter.
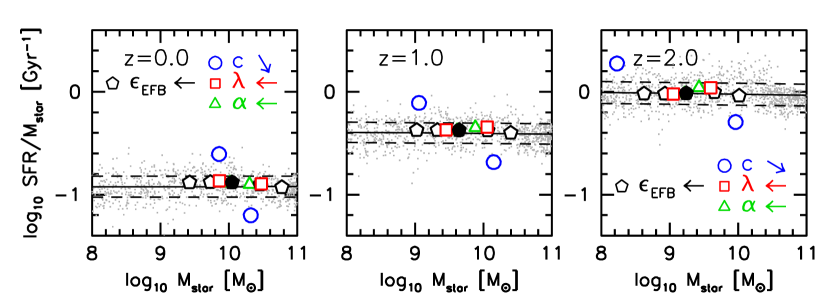
The upper panels of Fig. 12 show the effect of varying halo concentration (and thus also the MAH), halo spin parameter, , and AMD, , on the SFR sequence. The solid black circle shows a model with median , and , and with energy driven feedback with . The open blue circles show models with variation in . The direction the model moves for increasing is given by the blue arrows. This shows that galaxies that form in haloes with higher concentrations (i.e. earlier MAHs) lie below the SFR sequence (i.e. lower SFR at fixed ), while galaxies that form in haloes with lower concentrations lie above the SFR sequence (i.e. higher SFR at fixed ). This implies that the normalization of the SFR sequence depends on the cosmological parameters, in particular , with higher resulting in lower SFR at a given (see § 5.3)


4.2 Why is the scatter in the SFR sequence independent of halo spin?
The red open squares in Fig. 12 show models with variation in , while the green open triangles show models with variation in . As for the concentrations, the direction the model moves for increasing and is indicated by the red and green arrows, respectively. This shows that both SFR and depend on the halo angular momentum parameters, and spin in particular, but that the changes move galaxies along the SFR sequence: lower and both result in higher SFR and higher .
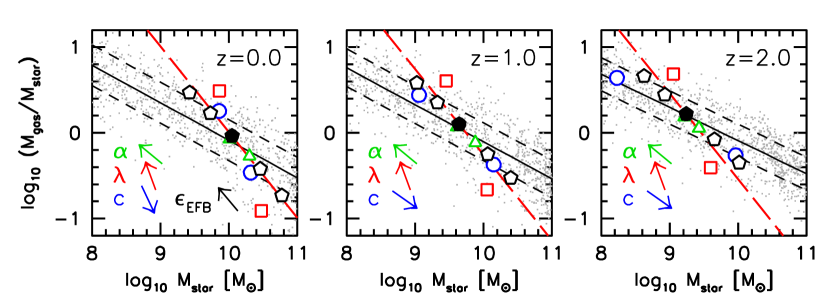
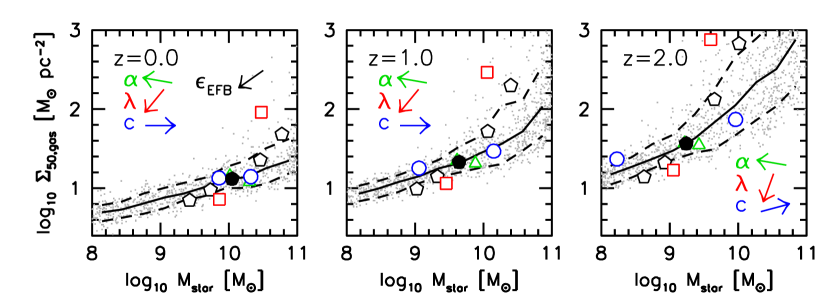
The middle and lower panels of Fig. 12 show the effect of variation in , , and , on the relation between stellar mass and the gas-to-stellar mass ratio (middle panels) and between stellar mass and gas density (lower panels). The scatter in these two relations is dominated by , with a sub-dominate component, and a marginal component. Changes in (AMD) only have a very small effect, which explains why in many cases you can only see one green triangle (that for low values of ). Smaller values for result in higher gas densities, which result in more efficient star formation, and hence higher SFRs, higher , and lower . This explains why the SFR sequence is invariant under changes in .
4.3 Independence of the SFR sequence to disk size
In our model the scatter in disk sizes, at fixed stellar mass, is dominated by scatter in the spin parameter. Scatter in halo concentration (which is coupled to scatter in MAH) also contributes, but to a much lesser extent (see for example Dutton et al. 2007, Fig.7). Thus we would expect that the SFR sequence is also independent of disk size. In Fig. 13 we show that this is indeed the case. This figure shows the scatter in SSFR at fixed stellar mass vs. the scatter in disk size at fixed stellar mass, for galaxies in the EFB model with stellar masses between . We get similar results, i.e. no correlation, for our other feedback models. In the upper panels the disk size is the stellar half mass radius, while in the lower panels the disk size is the cold gas half mass radius. The left panels show results at redshift , the middle panels and the right panels .
We now return to the line of reasoning from the introduction, that suggested that scatter in disk size would be expected to result in scatter in the SFR sequence, and explain why it is false (at least in our model). Recall that for a SK star formation law with the SFR depends linearly on gas mass and gas disk size. Thus for fixed gas mass, one expects that galaxies with smaller gas disks should have higher SFRs. If stellar mass is proportional to gas mass, and stellar disk sizes are proportional to gas disk sizes, then one would expect that at fixed stellar mass, scatter in stellar disk sizes to result in scatter in SFRs. The reason that this is not the case in our models is that the scatter in the relation between gas mass and stellar mass depends on disk size. At a fixed stellar mass, galaxies with smaller disks have lower gas fractions, and galaxies with larger disks have higher gas fractions. These two effects cancel out, leaving the SFR unchanged.
Another way to think about this is that at fixed halo mass there is a spread in disk sizes. Galaxies with smaller disks do have higher SFR, but at the same time they also have higher stellar masses (and lower gas fractions). Thus scatter in disk sizes creates a SFR sequence at fixed halo mass.
The lack of a correlation we find between scatter in SSFR and scatter in disk size (both stellar and gas) at fixed stellar mass should be testable using existing and future data. Indeed, correlations between SSFR and stellar surface density have been studied by Franx et al. (2008) and Williams et al. (2009). These authors have shown that there is a strong correlation between SSFR and stellar surface density, such that galaxies with higher stellar densities have lower SSFR. Williams et al. (2009) also studied the galaxy half light radius - stellar mass relation as a function of SSFR from redshifts to . At a fixed stellar mass, there is a clear trend for smaller galaxies to have lower SSFR. These observations may seem at odds with the predictions from our models. However, our predictions are for galaxies on the SFR sequence, and not for galaxies in general. Thus it is plausible that the stellar surface density is important for determining whether a galaxy is on or off the SFR sequence. But that for galaxies on the SFR sequence, the stellar density does not correlate with the SSFR, as in our models. Another caveat is that the sizes measured by Franx et al. (2008) and Williams et al. (2009) are global half light sizes, whereas our model sizes are disk sizes. Global sizes do not distinguish between bulges and disks. Since disks tend to be larger than bulges as well as having higher SSFRs, a variation of bulge fraction at fixed stellar mass will naturally result in a correlation between galaxy half light radius and SSFR, even if no such correlation exists between disk size and SSFR. Thus averaging bulges and disks together may be hiding some important clues to the strength and nature of the correlation between SSFR and stellar surface density. Future observational studies will be able to address these issues.
5 Robustness of the SFR sequence
5.1 Dependence on feedback
The black open pentagons in the upper panels of Fig. 12 show the effect of varying the energy feedback efficiency, , from 0 to 1 on the SFR sequence ( increases from right to left as indicated by the black arrow). Varying moves galaxies along the SFR sequence, in the sense that models with stronger feedback have both lower stellar masses and lower SFRs, but the same SSFR. Increased feedback efficiency results in lower gas densities (lower panels), and hence less efficient star formation (upper panels), and higher gas-to-stellar mass ratios (middle panels).
The fact that feedback results in higher cold gas fractions might seem counter-intuitive, as feedback blows cold gas out of the system which lowers the cold gas to halo mass fraction. However, the outflows in our model occur over an extended period of time, and thus the galaxy has time to adjust to them. Outflows reduce the baryonic masses, while at the same time increasing the specific angular momentum of the remaining baryons (Maller & Dekel 2002; Dutton & van den Bosch 2009). These two effects cause the density of the gas disk to decrease, resulting in less efficient star formation and hence higher cold gas fractions for the remaining baryons. In fact, it is interesting to note that varying the feedback efficiency moves galaxies roughly along a line of constant gas mass (red long-dashed line in Fig. 12).
5.2 Dependence on star formation efficiency
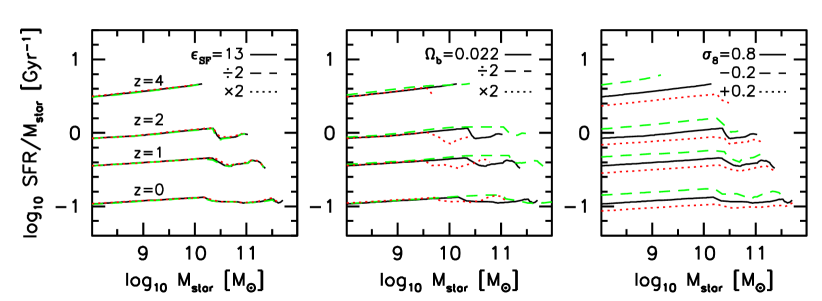
One of the uncertainties in our star formation law is the normalization, which depends on amongst other things, the stellar IMF. The right panel of Fig. 14 shows that the SFR sequence is independent to changes in the star formation efficiency parameter () by a factor of 2. Furthermore, for individual galaxies, SFR and are insensitive to . This is because changes (e.g. an increase) in are offset by changes (e.g. a decrease) in gas masses and gas densities, i.e. star formation is self-regulating. Thus differences in IMF, such as between Salpeter and Chabrier (2002), do not impact on the SFR sequence in our models.
5.3 Dependence on cosmological parameters
As discussed in §4.1 the SFR sequence depends on the MAH of the baryons, which is cosmology dependent. The MAH can be described to lowest order by a normalization, and a formation redshift.
We simulate variation in the normalization by changing the cosmological baryon fraction by plus or minus a factor of 2. As shown in the middle panel of Fig. 14 this has no effect on the normalization of the SSFRs. The only effect is to change the mass scale at which cooling becomes inefficient, which occurs because changing the baryon fraction changes the density of the hot halo gas, and hence the cooling efficiency.
We simulate variation in the formation redshift of the haloes by varying the normalization of the power spectrum, . Higher results in earlier forming haloes, and hence an earlier MAH. The right panel of Fig. 14 shows the impact on the SFR sequence of varying from 0.6 to 1.0. The SSFRs are higher for lower , and lower for higher .
Thus the zero point and evolution of the SFR sequence appears to depend only on the time dependence of the gas mass accretion history. This is a result of galaxies being in a quasi steady state between gas accretion rate and star formation rate, which in turn is the result of the self-regulating nature of star formation in galaxy disks. This suggests that in order to change the slope or time evolution of the SFR sequence relation, it is necessary to change the gas accretion history, rather than the details of how gas is converted into stars.
5.4 Is the SFR sequence special?
We have shown that the SFR sequence in our models is independent of the feedback efficiency, and has small scatter. We now consider relations between the SFR and other masses, to see if the SFR sequence is special.
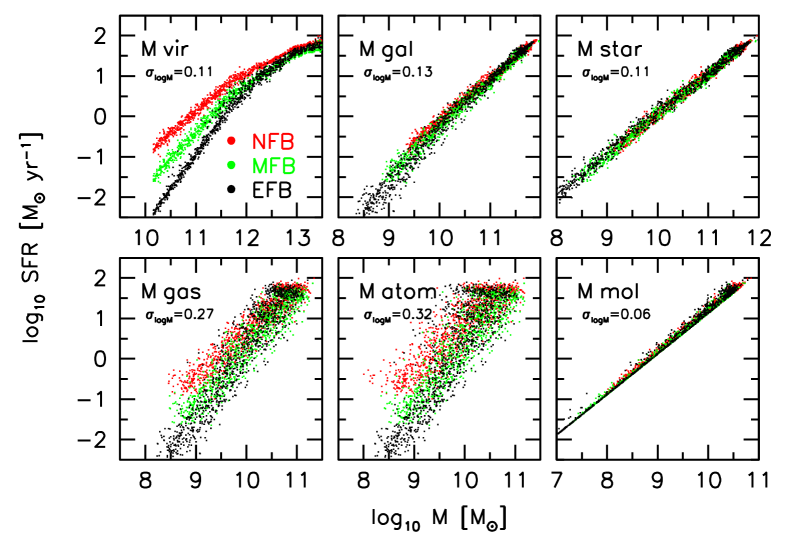
Fig. 15 shows the SFR - relations at redshift , where is the virial mass (), galaxy mass (), stellar mass (), cold gas mass (), cold atomic gas (), and cold molecular gas (). In each panel results are shown for all three models; NFB, EFB and MFB (as indicated). As we have already seen, the SFR sequence (upper right panel) has small scatter (0.11 dex in at SFR to ) and a slope that is independent of mass and feedback. The SFR - relation (upper middle panel) has a slightly larger scatter (0.12 dex), which increases at the low mass end, and has a slope that is weakly dependent on mass and feedback. The SFR - relation (upper left panel) has a slightly smaller scatter (0.10 dex) than the SFR sequence, but the slope is strongly dependent on mass and the feedback model. The SFR - relation (lower left panel) has a large scatter (0.26 dex), and a slope that depends on the feedback model. The SFR - relation (lower middle panel) has the largest scatter (0.32 dex) and also has a slope that depends on feedback. Finally, the SFR - relation (lower right panel) has the smallest scatter (0.06 dex) and is independent of feedback.
The origin of the tight relation between SFR and is due to our effective star formation law, , with a Schmidt-law index of . Thus from Eq.(4), the integrated SFR of a galaxy (which reflects its stellar mass) is proportional to the total molecular gas mass.
6 Summary
We have used a disk galaxy evolution model to investigate the origin of the zero point evolution and small scatter of the star formation rate sequence — the tight correlation between galaxy star formation rate (SFR) and stellar mass (). In our model the mass accretion histories of the dark matter haloes are smooth (i.e. there are no mergers), gas accretes onto the central galaxy via “hot mode” accretion (i.e. gas that enters the halo shock heats to the virial temperature, cools radiatively, and then accretes onto the central galaxy in a free fall time), the cold gas density profile is determined by detailed conservation of specific angular momentum, the radially dependent molecular gas fraction is taken to depend on the mid-plane pressure in the disk, and star formation occurs at a rate that is governed by the local surface density of the molecular gas. We summarize our results as follows:
-
•
The slope, zero point and scatter of the SFR sequence are independent of our feedback model. This is because feedback effects the SFRs and such that galaxies are shifted along the relation, rather than perpendicular to it.
-
•
The zero point of the SFR sequence in our models evolves strongly, and in good agreement with observations between to . However, the models under predict the SFRs at , in qualitative agreement with the hydrodynamical simulations of Davé (2008), who argued for evolution in the IMF in order to reconcile his simulations with the data. However, our model fits the data at , disfavoring such an evolving IMF model.
-
•
In our model the evolution in the zero point of the SFR sequence closely follows the evolution in the gas accretion rate. However, at a fixed stellar mass the absolute value of specific gas accretion rate depends strongly on the feedback model. There is a better correlation between the star formation rate and the net gas inflow rate (inflow - outflow). The high (central) densities of haloes and the relatively low values of the spin parameter aspire to assure that the majority of (centrifugally supported) disks always attain sufficiently high gas densities for star formation to be efficient, and thus for a steady state to exist in which the star formation rate follows the net inflow rate of cold gas.
-
•
Our models predict that the SSFR should decrease monotonically from redshifts to , whereas the current observations favor no evolution over this redshift range. At the discrepancy between models and observation is a factor of . Thus, if the observations are correct, this indicates that the star formation rate no longer follows the gas accretion rate in high redshift () galaxies, as we infer that it does in low redshift () galaxies.
-
•
At a fixed stellar mass, gas masses evolve only very weakly in our model, whereas gas densities evolve strongly. Thus the higher SSFRs in higher redshift galaxies is due to higher gas densities, and perhaps surprisingly, not due to higher total cold gas masses (as is often claimed e.g. Daddi et al. 2009b). The higher gas densities are driven by the higher densities of haloes at higher redshifts coupled to a decrease in disk specific angular momentum at higher redshifts.
-
•
The increased gas densities at higher redshifts result in higher molecular gas masses. At a fixed stellar mass, the molecular gas masses are a factor of higher at compared to . This thus provides the increased fuel for the higher SSFRs in high redshift galaxies.
-
•
At fixed stellar mass, the molecular gas densities in our model increase strongly with increasing redshift, whereas the atomic gas densities are roughly independent of redshift, with an effective HI surface density of . This is basically a reflection of the fact that at HI surface densities higher than this, the atomic gas is efficiently converted into molecular gas (see also Martin & Kennicutt 2001; Wong & Blitz 2002; Bigiel et al. 2008).
-
•
The scatter in SFR at fixed in our models is dex. The source of this scatter is the variance in mass accretion histories for haloes of a given virial mass, which in our model is coupled to the halo concentration. Scatter in halo spin contributes negligibly, because spin scatters galaxies along the SFR sequence. Note that the dex scatter in our models is less than the observed scatter ( dex), as it should be given that the observed scatter is likely to be dominated by observational uncertainties. However, it is likely that our model underestimates the scatter due to our simplified treatment of the halo mass accretion history. It remains to be determined whether the true intrinsic scatter is indeed as small as predicted by our models, or whether additional sources of intrinsic scatter are required.
-
•
Relations between SFR and other masses (halo virial mass, galaxy mass, gas mass, atomic gas mass) exist, but have either larger scatter, or a slope that is dependent on mass and/or the feedback model. The tightest correlation is between SFR and molecular mass, which is a manifestation of the approximately linear relation between SFR surface density and molecular gas surface density which is built into our models.
While our model is conceptually very simple, it reproduces the main features of the observed SFR sequence: strong zero point evolution, small scatter, and a slope that is close to unity. In detail, though, there seem to be three potential failures: (i) the model slope appears somewhat too steep at , (ii) the model underpredicts the SSFRs at , and (iii) the model overpredicts the SSFRs at . Better data is required in order to asses the severity of these potential shortcomings.
A key prediction of our model that will soon be testable observationally (with ALMA) is that, at fixed stellar mass, the molecular gas densities and molecular gas masses should be substantially (by at least an order of magnitude) higher at than they are for present-day disk galaxies. Results for small numbers of disk galaxies at lend support to our predictions (Daddi et al. 2009b; Tacconi et al. 2010), though these results need to be verified with larger samples and more robust measurements.
Acknowledgements
A.A.D thanks Sandra Faber for asking the question that started this paper. A.A.D. acknowledges financial support from the National Science Foundation grant AST-0808133, from Hubble Space Telescope grant AR-10965.02-A, and from a CITA National Fellowship. A.D. acknowledge support from an ISF grant, from GIF I-895-207.7/2005, from German-Israeli Project Cooperation grant STE1869/1-1.GE625/I5-1, from France-Israel Teamwork in Sciences, from the Einstein Center at HU, and from NASA ATP NAG5-8218 at UCSC.
References
- Agertz et al. (2009) Agertz, O., Teyssier, R., & Moore, B. 2009, MNRAS, 397, L64
- Avila-Reese et al. (1998) Avila-Reese, V., Firmani, C., & Hernández, X. 1998, ApJ, 505, 37
- Bell et al. (2005) Bell, E. F., et al. 2005, ApJ, 625, 23
- Bigiel et al. (2008) Bigiel, F., Leroy, A., Walter, F., Brinks, E., de Blok, W. J. G., Madore, B., & Thornley, M. D. 2008, AJ, 136, 2846
- Birnboim & Dekel (2003) Birnboim, Y., & Dekel, A. 2003, MNRAS, 345, 349
- Birnboim et al. (2007) Birnboim, Y., Dekel, A., & Neistein, E. 2007, MNRAS, 380, 339
- Blitz & Rosolowsky (2004) Blitz, L., & Rosolowsky, E. 2004, ApJL, 612, L29
- Blitz & Rosolowsky (2006) Blitz, L., & Rosolowsky, E. 2006, ApJ, 650, 933
- Bothwell et al. (2009) Bothwell, M. S., Kennicutt, R. C., & Lee, J. C. 2009, MNRAS, 400, 154
- Bouche et al. (2009) Bouche, N., et al. 2009, arXiv:0912.1858
- Bouwens et al. (2008) Bouwens, R. J., Illingworth, G. D., Franx, M., & Ford, H. 2008, ApJ, 686, 230
- Bruzual & Charlot (2003) Bruzual, G., & Charlot, S. 2003, MNRAS, 344, 1000
- Bullock et al. (2001) Bullock, J. S., Kolatt, T. S., Sigad, Y., Somerville, R. S., Kravtsov, A. V., Klypin, A. A., Primack, J. R., & Dekel, A. 2001a, MNRAS, 321, 559
- Bullock et al. (2001) Bullock, J. S., Dekel, A., Kolatt, T. S., Kravtsov, A. V., Klypin, A. A., Porciani, C., & Primack, J. R. 2001b, ApJ, 555, 240
- Cattaneo et al. (2006) Cattaneo, A., Dekel, A., Devriendt, J., Guiderdoni, B., & Blaizot, J. 2006, MNRAS, 370, 1651
- Ceverino et al. (2009) Ceverino, D., Dekel, A., & Bournaud, F. 2009, arXiv:0907.3271
- Chabrier (2003) Chabrier, G. 2003, PASP, 115, 763
- Cole et al. (1994) Cole, S., Aragon-Salamanca, A., Frenk, C. S., Navarro, J. F., & Zepf, S. E. 1994, MNRAS, 271, 781
- Cole et al. (2000) Cole, S., Lacey, C. G., Baugh, C. M., & Frenk, C. S. 2000, MNRAS, 319, 168
- Courteau et al. (2007) Courteau, S., Dutton, A. A., van den Bosch, F. C., MacArthur, L. A., Dekel, A., McIntosh, D. H., & Dale, D. A. 2007, ApJ, 671, 203
- Croton et al. (2006) Croton, D. J., et al. 2006, MNRAS, 365, 11
- Daddi et al. (2007) Daddi, E., et al. 2007, ApJ, 670, 156
- Daddi et al. (2008) Daddi, E., Dannerbauer, H., Elbaz, D., Dickinson, M., Morrison, G., Stern, D., & Ravindranath, S. 2008, ApJL, 673, L21
- Daddi et al. (2009) Daddi, E., et al. 2009a, ApJ, 694, 1517
- Daddi et al. (2009) Daddi, E., et al. 2009b, arXiv:0911.2776
- Davé (2008) Davé, R. 2008, MNRAS, 385, 147
- Dekel & Silk (1986) Dekel, A., & Silk, J. 1986, ApJ, 303, 39
- Dekel & Birnboim (2006) Dekel, A., & Birnboim, Y. 2006, MNRAS, 368, 2
- Dekel et al. (2009) Dekel, A., et al. 2009, Nature, 457, 451
- Dekel et al. (2009) Dekel, A., Sari, R., & Ceverino, D. 2009, ApJ, 703, 785
- Dunkley et al. (2009) Dunkley, J., et al. 2009, ApJS, 180, 306
- Dutton (2009) Dutton, A. A. 2009, MNRAS, 396, 121
- Dutton & van den Bosch (2009) Dutton, A. A., & van den Bosch, F. C. 2009, MNRAS, 396, 141
- Elbaz et al. (2007) Elbaz, D., et al. 2007, A&A, 468, 33
- Elmegreen (1993) Elmegreen, B. G. 1993, ApJ, 411, 170
- Elmegreen et al. (2007) Elmegreen, D. M., Elmegreen, B. G., Ravindranath, S., & Coe, D. A. 2007, ApJ, 658, 763
- Elmegreen et al. (2009) Elmegreen, D. M., Elmegreen, B. G., Marcus, M. T., Shahinyan, K., Yau, A., & Petersen, M. 2009, ApJ, 701, 306
- Erb et al. (2006) Erb, D. K., Steidel, C. C., Shapley, A. E., Pettini, M., Reddy, N. A., & Adelberger, K. L. 2006, ApJ, 646, 107
- Firmani & Avila-Reese (2000) Firmani, C., & Avila-Reese, V. 2000, MNRAS, 315, 457
- Franx et al. (2008) Franx, M., van Dokkum, P. G., Schreiber, N. M. F., Wuyts, S., Labbé, I., & Toft, S. 2008, ApJ, 688, 770
- Garnett (2002) Garnett, D. R. 2002, ApJ, 581, 1019
- Gao & Solomon (2004) Gao, Y., & Solomon, P. M. 2004, ApJ, 606, 271
- Gonzalez et al. (2009) Gonzalez, V., Labbe, I., Bouwens, R. J., Illingworth, G., Franx, M., Kriek, M., & Brammer, G. B. 2009, arXiv:0909.3517
- Hatton et al. (2003) Hatton, S., Devriendt, J. E. G., Ninin, S., Bouchet, F. R., Guiderdoni, B., & Vibert, D. 2003, MNRAS, 343, 75
- Hopkins & Beacom (2006) Hopkins, A. M., & Beacom, J. F. 2006, ApJ, 651, 142
- Kauffmann et al. (1993) Kauffmann, G., White, S. D. M., & Guiderdoni, B. 1993, MNRAS, 264, 201
- Kauffmann (1996) Kauffmann, G. 1996, MNRAS, 281, 475
- Kennicutt (1998) Kennicutt, R. C. 1998, ApJ, 498, 541
- Keres et al. (2005) Keres, D., Katz, N., Weinberg, D. H., & Davé R. 2005, MNRAS, 363, 2
- Krumholz et al. (2009) Krumholz, M. R., McKee, C. F., & Tumlinson, J. 2009, ApJ, 699, 850
- Lilly et al. (1996) Lilly, S. J., Le Fevre, O., Hammer, F., & Crampton, D. 1996, ApJL, 460, L1
- Lotz et al. (2008) Lotz, J. M., et al. 2008, ApJ, 672, 177
- Macciò et al. (2007) Macciò, A. V., Dutton, A. A., van den Bosch, F. C., Moore, B., Potter, D., & Stadel, J. 2007, MNRAS, 378, 55
- Macciò et al. (2008) Macciò, A. V., Dutton, A. A., & van den Bosch, F. C. 2008, MNRAS, 391, 1940
- Madau et al. (1998) Madau, P., Pozzetti, L., & Dickinson, M. 1998, ApJ, 498, 106
- Maller & Dekel (2002) Maller, A. H., & Dekel, A. 2002, MNRAS, 335, 487
- Martin & Kennicutt (2001) Martin, C. L., & Kennicutt, R. C. Jr. 2001, ApJ, 555, 301
- Melbourne et al. (2005) Melbourne, J., Koo, D. C., & Le Floc’h, E. 2005, ApJL, 632, L65
- Mo et al. (1998) Mo, H. J., Mao, S., & White, S. D. M. 1998, MNRAS, 295, 319
- Murray et al. (2005) Murray, N., Quataert, E., & Thompson, T. A. 2005, ApJ, 618, 569
- Navarro et al. (1997) Navarro, J. F., Frenk, C. S., & White, S. D. M. 1997, ApJ, 490, 493
- Navarro & Steinmetz (2000) Navarro, J. F., & Steinmetz, M. 2000, ApJ, 538, 477
- Neistein & Dekel (2008) Neistein, E., & Dekel, A. 2008, MNRAS, 383, 615
- Noeske et al. (2007) Noeske, K. G., et al. 2007a, ApJL, 660, L43
- Noeske et al. (2007) Noeske, K. G., et al. 2007b, ApJL, 660, L47
- Pannella et al. (2009) Pannella, M., et al. 2009, ApJL, 698, L116
- Pérez-González et al. (2008) Pérez-González, P. G., et al. 2008, ApJ, 675, 234
- Piontek & Steinmetz (2009) Piontek, F., & Steinmetz, M. 2009, arXiv:0909.4156
- Prochaska & Wolfe (2009) Prochaska, J. X., & Wolfe, A. M. 2009, ApJ, 696, 1543
- Salim et al. (2007) Salim, S., et al. 2007, ApJS, 173, 267
- Schiminovich et al. (2005) Schiminovich, D., et al. 2005, ApJL, 619, L47
- Schiminovich et al. (2007) Schiminovich, D., et al. 2007, ApJS, 173, 315
- Schmidt (1959) Schmidt, M. 1959, ApJ, 129, 243
- Sharma & Steinmetz (2005) Sharma, S., & Steinmetz, M. 2005, ApJ, 628, 21
- Shen et al. (2003) Shen, S., Mo, H. J., White, S. D. M., Blanton, M. R., Kauffmann, G., Voges, W., Brinkmann, J., & Csabai, I. 2003, MNRAS, 343, 978
- Sobral et al. (2009) Sobral, D., et al. 2009, MNRAS, 398, 75
- Somerville & Primack (1999) Somerville, R. S., & Primack, J. R. 1999, MNRAS, 310, 1087
- Somerville et al. (2008) Somerville, R. S., et al. 2008, ApJ, 672, 776
- Stark et al. (2009) Stark, D. P., Ellis, R. S., Bunker, A., Bundy, K., Targett, T., Benson, A., & Lacy, M. 2009, ApJ, 697, 1493
- Sutherland & Dopita (1993) Sutherland, R. S., & Dopita, M. A. 1993, ApJS, 88, 253
- Tacconi et al. (2006) Tacconi, L. J., et al. 2006, ApJ, 640, 228
- Tacconi et al. (2008) Tacconi, L. J., et al. 2008, ApJ, 680, 246
- Tacconi et al. (2010) Tacconi, L. J., et al. 2010, arXiv:1002.2149
- van den Bosch (2001) van den Bosch, F. C. 2001, MNRAS, 327, 1334
- van den Bosch (2002) van den Bosch, F. C. 2002, MNRAS, 332, 456
- van den Bosch et al. (2002) van den Bosch, F. C., Abel, T., Croft, R. A. C., Hernquist, L., & White, S. D. M. 2002, ApJ, 576, 21
- Villar et al. (2008) Villar, V., Gallego, J., Pérez-González, P. G., Pascual, S., Noeske, K., Koo, D. C., Barro, G., & Zamorano, J. 2008, ApJ, 677, 169
- Wechsler et al. (2002) Wechsler, R. H., Bullock, J. S., Primack, J. R., Kravtsov, A. V., & Dekel, A. 2002, ApJ, 568, 52
- Williams et al. (2009) Williams, R. J., Quadri, R. F., Franx, M., van Dokkum, P., Toft, S., Kriek, M., & Labbe, I. 2009, arXiv:0906.4786
- Wolf et al. (2005) Wolf, C., et al. 2005, ApJ, 630, 771
- Wong & Blitz (2002) Wong, T., & Blitz, L. 2002, ApJ, 569, 157
- Wu et al. (2005) Wu, J., Evans, N. J., II, Gao, Y., Solomon, P. M., Shirley, Y. L., & Vanden Bout, P. A. 2005, ApJL, 635, L173
- Zhao et al. (2009) Zhao, D. H., Jing, Y. P., Mo, H. J., Börner, G. 2009, ApJ, 707, 354
Appendix A Overview of our Star Formation Law
Here we give an overview of the star formation law used in our models.
Following Blitz & Rosolowsky (2006) we assume that star formation takes place in dense molecular gas, traced by the Hydrogen Cyanide molecule (HCN), with a constant star formation efficiency:
| (5) |
where (Gao & Solomon 2004, Wu et al. 2005). Expressing this equation in terms of the total gas content:
| (6) |
where is the ratio between the dense molecular gas (as traced by HCN) and the total molecular gas, and is the molecular gas fraction.
The fraction of gas that is molecular, , can be defined in terms of the mass ratio between molecular and atomic gas, by
| (7) |
Empirically Wong & Blitz (2002) and Blitz & Rosolowsky (2004; 2006) have argued that is determined to first order by the mid plane pressure, . We adopt the relation from Blitz & Rosolowsky (2006):
| (8) |
where is Boltzmann’s constant, and is in cgs units. For a gas plus stellar disk the mid plane pressure is given, to within 10%, by (Elmegreen 1993)
| (9) |
where and are the velocity dispersions of the gas and stellar disk, respectively. For simplicity, we will assume .
Based on the arguments and references in Blitz & Rosolowsky (2006) we adopt the following fitting function for
| (10) |
In the low pressure regime, , , and , and thus in terms of total gas or atomic gas Eq. (5) asymptotes to
| (11) |
Or in terms of the molecular gas, Eq. (5) asymptotes to
| (12) |
In the high pressure regime, , , and , and eq.(5) asymptotes to the familiar SK relation
| (13) |
Furthermore, with , we recover the coefficient of of the standard SK relation222Note that the coefficient of from Kennicutt (1998) does not account for Helium in the gas masses. Correcting for Helium with a factor of 1.36 results in .
We implement the star formation recipe given by Eq.(5) as follows. At each time step and annulus in the disk, we calculate the star formation rate. Then we use the following approximation (valid for times steps small compared to the star formation time scale) to calculate the mass of newly formed stars
| (14) |
with the area of the annulus, and the time step interval. Note that is not a constant in our model, it varies from at high redshifts to at low redshifts (green dotted line in Fig. 17).
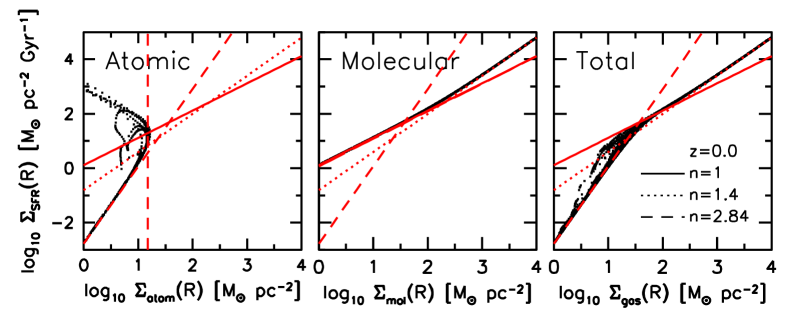
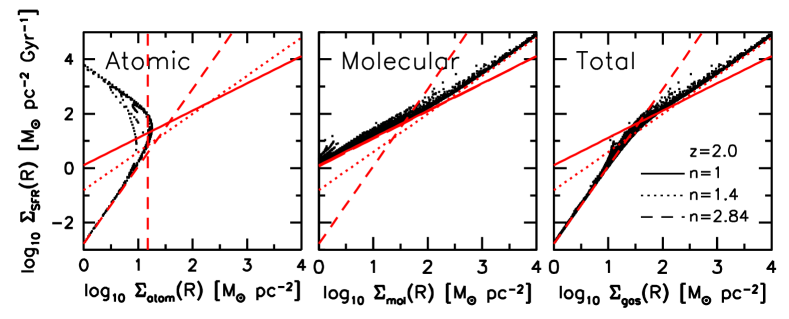
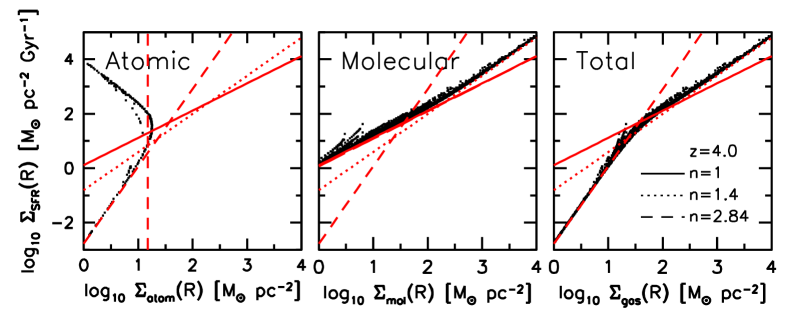
Fig. 16 shows the radially resolved star formation law from 100 randomly selected galaxies from our model with energy driven outflows (EFB) at redshifts . Each dot corresponds to the star formation rate surface density and gas surface density of a single radial bin in a single galaxy. Each galaxy has 10’s of such bins. The red lines show the asymptotic behaviour expected from our model in the high and low pressure regimes. In the high pressure regime , and so the star formation law () for the molecular and total gas have the same slope of (dotted lines). In the low pressure regime the star formation law for the molecular gas has a slope of (solid lines), while that of the atomic and total gas have a slope of (dashed lines). The panels on the left show that there is a maximum surface density that atomic gas reaches (see Dutton (2009) for examples of atomic and molecular gas density profiles from our models). This causes the relation between and to steepen around , and for the slope to reverse sign for . This regime corresponds to small galactic radii, where the atomic gas densities decrease towards the center of the galaxy, but the molecular gas densities and star formation rate densities are increasing. The features of our star formation laws closely resemble the observed relations between local star formation rate surface density and atomic, molecular, and total gas density as measured by Bigiel et al. (2008), as well as the theoretical model of Krumholz, McKee, & Tumlinson (2009).
Appendix B Hot Mode vs. Cold Mode Accretion
It has recently become clear that the way we model the accretion of gas into galaxies (via a cooling flow of shock heated gas), is not entirely correct. Birnboim & Dekel (2003) and Dekel & Birnboim (2006) argued that in haloes below a characteristic mass of , galaxies accrete most of their gas via “cold flows”, in which the gas is never heated to the virial temperature of the halo. This has subsequently been confirmed in cosmological, hydrodynamical simulations (e.g., Keres et al. 2005). According to Davé (2008), the defining features of cold mode accretion are that it is (i) rapid, (ii) smooth, and (iii) steady. Rapid because it is limited by the free fall time, rather than the cooling time, smooth because most (more than 90%, Dekel et al. 2009) of the accretion occurs in small lumps and not through major mergers, and steady because it is governed by the gravitational potential of the slowly growing halo.
What differentiates the cold mode accretion model from the classical hot mode accretion model? In the hot mode model, gas that enters the halo is shock heated to the virial temperature. The hot gas then cools radiatively, and the cold gas accretes onto the central galaxy on a timescale that is the maximum of the cooling time or the free fall time. In cold mode accretion there is either no virial shock, or cold streams penetrate the hot halo, and gas accretes onto the central galaxy on a free fall time.
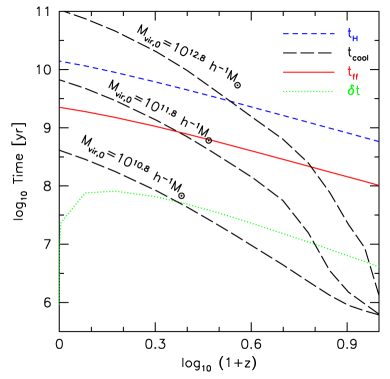
Fig. 17 shows the cooling times (, black long-dashed lines) and free fall times (, red solid line) versus redshift for three halo masses () in our adopted cosmology. This shows that for a given halo, both the cooling time and free fall time decrease to higher redshift, but that the cooling time decreases faster. Thus at high redshifts, the free fall time is the limiting factor in the cold gas accretion rate. For typical halo masses of star forming galaxies () the cooling time is shorter than the free fall time for most redshifts.

The impact of this competition between the cooling time and free fall time on the accretion rates is shown in Fig. 18. This shows the accretion ratio vs. halo mass at redshifts to . The accretion ratio is defined as the ratio between the accretion rate of cold gas onto the galaxy, , and the baryon accretion rate into the halo, , at that redshift. As expected from Fig. 17, at low halo masses and high redshifts haloes are in the fast cooling regime (), and thus the accretion ratio is close to unity (deviations from unity arise because of the exponential mass accretion histories adopted here). Hence, although we do not explicitly model cold accretion flows, effectively the model yields cold gas accretion rates that are indistinguishable from those expected from cold flows.
Above a halo mass of , the haloes are in the slow cooling regime (), and the accretion ratio drops sharply. It has been argued that in haloes above this mass range at high redshifts (), the cold gas accretion rates are dominated by cold streams penetrating the hot halo (Dekel et al. 2009). This aspect of gas accretion is not captured by our cooling/accretion treatment, which may impact the formation of massive galaxies at . Apart from this specific case, the classical hot mode cooling model that we adopt in this paper, reproduces the defining features of cold mode accretion: rapid, smooth, and steady (e.g. Davé 2008). We note that while we refer to cold accretion as smooth, it can also be described as clumpy in the sense that the accretion is made up of many small lumps, rather than a diffuse structureless medium.
Appendix C Why are high redshift disks denser?
As discussed in §3.3.3 the evolution of the densities of gas disks in our model is stronger than predicted by the simple halo density scaling. To understand what causes this deviation we first discuss what causes the evolution in the surface densities of the baryonic disks in our model. Since we assume that the disks are in centrifugal equilibrium, the evolution in the density of the disk is determined by the evolution of: 1) the concentration of the halo, ; 2) the ratio between the disk mass and total mass, ; and 3) the ratio between the spin parameter of the disk and the spin parameter of the halo (i.e. the ratio between the specific angular momentum of the disk and the specific angular momentum of the halo), . Higher , higher and lower all result in higher density disks.
To isolate the effects of evolution in from that of and , we introduce a new model, labeled NFC, in which we have turned the feedback and cooling calculations off. In this model we assume that the ratio between the baryonic mass and virial mass, , independent of redshift. To implement this, at each time step, we set the baryonic mass that accretes onto the galaxy to be times the total mass (baryons plus dark matter) accreted into the virial radius during that time step. In this model we also assume that the spin parameter of the halo is independent of redshift, with a median value of , and that the spin parameter of the disk is equal to the spin parameter of the halo, i.e. .
The evolution of the surface density of the baryonic disks in the NFC model is shown as open circles in the lower left panels of Fig. 19. This evolution follows the virial scaling for redshifts , but for redshifts the evolution is weaker. The weak evolution at low redshifts is due to the evolution in the halo concentration (see Somerville et al. 2008).
The middle and right panels in Fig. 19 show the evolution of and . By construction the NFC model (open circles) shows no evolution in these parameters. The other three models result in decreasing with increasing redshift. For the NFB model the evolution in is due to the inside-out nature of the cooling and accretion of the hot halo gas in our model. As shown in Fig. 17, at high redshifts the cooling time of the hot halo gas is less than the free fall time, and thus there is a delay between when baryons enter the halo, and when they reach the central galaxy. At roughly 60% of the baryons that accreted into the halo have cooled and reached the central galaxy. Since the mass of the halo is more centrally concentrated than the angular momentum, by only accreting the inner 60% of the hot halo baryons, the gas that reaches the disk has lower specific angular momentum than the halo. By redshift , , and . For the NFB model decreases to higher redshifts, which should result in higher density disks. However, also decreases to higher redshifts, which counteracts this effect. This explains why the evolution of the disk density in the NFB model follows the evolution of the virial scaling.
At high redshifts all three models with cooling (EFB, MFB, NFB) result in similar and . This is because outflows are inefficient in high redshift galaxies due to the deep potential wells. However, outflows do occur at high redshifts, which result in the EFB model having lower and higher than the MFB and NFB models. Outflows result in higher because gas is preferentially removed from small radii (where the stars are preferentially forming due to the density dependent star formation law). At lower redshifts, the galaxies are less dense, escape velocities are lower, and thus outflows are more efficient. For the EFB model this results in decreasing with decreasing redshift. Thus the combined effects of lower specific angular momentum and higher mass fractions in higher redshift disks result in the disk densities increasing faster than the virial scaling.
Now we return to the evolution of the gas densities. The evolution of the gas density for the NFC model is shown in the upper left panel in Fig. 19. This shows a similar, but slightly stronger evolution than the virial scaling. This deviation is qualitatively explained by the spin parameter of the gas decreasing with increasing redshift and the gas mass fraction increasing with increasing redshift (upper middle panel). The evolution of the gas densities in the NFB, MFB and EFB models is stronger than that of the NFC model because the specific angular momentum of the disk evolves faster with redshift in these models. Thus in our model the gas densities evolve more strongly than the virial scaling because the spin parameters of the gas (and baryons) decrease to higher redshifts.