Stealth Galaxies in the Halo of the Milky Way
Abstract
We predict that there is a population of low-luminosity dwarf galaxies orbiting within the halo of the Milky Way that have surface brightnesses low enough to have escaped detection in star-count surveys. The overall count of stealth galaxies is sensitive to the presence (or lack) of a low-mass threshold in galaxy formation. These systems have luminosities and stellar velocity dispersions that are similar to those of known ultrafaint dwarf galaxies but they have more extended stellar distributions (half light radii greater than about 100 pc) because they inhabit dark subhalos that are slightly less massive than their higher surface brightness counterparts. As a result, the typical peak surface brightness is fainter than 30 mag per square arcsec. One implication is that the inferred common mass scale for Milky Way dwarfs may be an artifact of selection bias. If there is no sharp threshold in galaxy formation at low halo mass, then ultrafaint galaxies like Segue 1 represent the high-mass, early forming tail of a much larger population of objects that could number in the hundreds and have typical peak circular velocities of about 8 and masses within 300 pc of about 5 million solar masses. Alternatively, if we impose a low-mass threshold in galaxy formation in order to explain the unexpectedly high densities of the ultrafaint dwarfs, then we expect only a handful of stealth galaxies in the halo of the Milky Way. A complete census of these objects will require deeper sky surveys, 30m-class follow-up telescopes, and more refined methods to identify extended, self-bound groupings of stars in the halo.
Subject headings:
cosmology: theory — dark matter — galaxies: formation — galaxies: halos — methods: -body simulations1. Introduction
Approximately twenty-five new dwarf galaxy companions of the Milky Way (MW) and M31 have been discovered since 2004, more than doubling the known satellite population in the Local Group in five years Willman et al. (2005); Zucker et al. (2006); Grillmair (2006); Majewski et al. (2007); Belokurov et al. (2007); Grillmair (2009); Belokurov et al. (2009); Martin et al. (2009). The majority of these newly-discovered dwarfs are less luminous than any galaxy previously known. The most extreme of these, the ultrafaint MW dwarfs, have luminosities smaller than an average globular cluster L L⊙, and were discovered by searches for stellar overdensities in the wide-field maps of the Sloan Digital Sky Survey (SDSS) and the Sloan Extension for Galactic Understanding and Exploration (SEGUE). Follow-up kinematic observations showed that these tiny galaxies have surprisingly high stellar velocity dispersions for their luminosities and sizes (, Martin et al., 2007; Simon & Geha, 2007; Geha et al., 2009) and subsequent mass modeling has shown that they are the most dark matter dominated galaxies known (Strigari et al., 2008; Wolf et al., 2010). Remarkably, these extreme systems are not only the faintest, most dark matter dominated galaxies in the universe but they are also the most metal poor stellar systems yet studied (Kirby et al., 2008; Geha et al., 2009).
Perhaps the most exciting aspect of these recent discoveries is that they point to a much larger population. Detection in the SDSS is complete only to kpc for the least luminous dwarfs (Koposov et al., 2008; Walsh et al., 2009) and straightforward cosmologically motivated luminosity bias and coverage corrections suggest that there are between and ultrafaint dwarf galaxies within 400 kpc of the Milky Way (Tollerud et al., 2008), with an ever increasing number beyond. Importantly, the luminosity-distance detection limits only apply for systems with peak surface brightness obeying mag arcsec-2 (Koposov et al., 2008). Any satellite galaxy with a luminosity of and a projected half-light radius larger than about 100 pc would have evaded detection with current star-count techniques regardless of its distance from the Sun.
Here we argue that there is likely a population of dwarf galaxies surrounding the Milky Way (and by extension, throughout the universe) that are so diffuse in stellar density that they would have thus far avoided discovery. Our predictions rely on the fact that the effective radius of a dark matter dominated, dispersion-supported galaxy with fixed stellar velocity dispersion will increase as its dark matter halo mass decreases. One implication of this idea is that the known ultrafaint dwarf spheroidals (dSphs) may represent the high (dark matter) mass tail of a larger distribution of stealth galaxies. These undiscovered systems should preferentially inhabit the smallest dark matter subhalos that host stars (with maximum circular velocities ) and their possible presence should be accounted for in models that attempt to understand the satellite-subhalo problem in Cold Dark Matter (CDM) models (Klypin et al., 1999; Moore et al., 1999; Bullock et al., 2000; Stoehr et al., 2002; Zentner & Bullock, 2003; Kravtsov et al., 2004b; Strigari et al., 2007b; Macciò et al., 2009; Busha et al., 2009; Kravtsov, 2010; Okamoto & Frenk, 2009).
The link between subhalo mass and galaxy surface brightness may be particularly important for the quest to identify ‘fossils’ of the reionization epoch in the local universe (e.g. Ricotti et al., 2002; Ricotti & Gnedin, 2005; Gnedin & Kravtsov, 2006; Orban et al., 2008; Ricotti et al., 2008; Madau et al., 2008; Bovill & Ricotti, 2009; Muñoz et al., 2009; Ricotti, 2010). The smallest halos () are the ones that experience suppression after reionization. Before reionization, stars can form in these systems via H2 cooling provided sufficient H2 is available. Conclusive identification of these H2-cooling fossils in the Local Group would provide present-day laboratories for studying first-light star formation. Unfortunately, according to our estimates below, these low-mass, first-light fossils will likely be too diffuse to discover readily in star-count surveys. Indeed, Bovill & Ricotti (2009) have shown that low-luminosity fossil dSph galaxies produced in self-consistent cosmological simulations do tend to have very low surface brightness, such that they would not have been discovered in current surveys.
Stellar kinematic samples in dSph satellte galaxies provide a means to directly constrain total dark matter halo masses or values on an object by object basis. Unfortunately, this task is not straightforward because dSph dark matter halos are expected to extend well beyond their stellar radii. Nevertheless, by constraining the mass of a galaxy within its stellar extent, one can estimate (for example) a value by imposing a prior assumption that their density profiles behave as predicted for subhalos in CDM simulations (Zentner & Bullock, 2003; Hayashi et al., 2003; Kazantzidis et al., 2004; Peñarrubia et al., 2008a). Remarkably, these studies indicate that all of the known MW dSph satellite galaxies with well-studied kinematic samples are embedded within massive dark matter subhalos (; Wolf et al., in preparation; Peñarrubia et al., 2008a), and this includes ultrafaint dwarfs. Keep in mind, however, that these determinations rely on significant extrapolations: the rotation curve of a subhalo typically peaks at a radius of pc (Springel et al. 2008; Diemand et al. 2008). The median three-dimensional half-light radius for the sample of dSphs we consider here (see Wolf et al. 2010, Table 1) is about 300 pc, therefore the extrapolation is fairly large.
Another way to study dSph halo potential well depths is to consider masses within central radii that are similar in extent to the stars in the galaxies (Strigari et al., 2007a) but still large enough that they can be resolved directly in numerical simulations (Strigari et al., 2007b, 2008). Today’s state-of-the art N-body simulations cannot resolve subhalo densities below about 300 pc (Springel et al. 2008; Diemand et al. 2008). As a fortunate coincidence, 300 pc is also the median half-light radius for the population of MW dSphs with well-studied kinematic samples (Strigari et al., 2008; Wolf et al., 2010). For these practical (not physical) reasons Strigari et al. (2008) studied the integrated mass within 300 pc () for all of the MW dSphs with large stellar kinematic samples. They found and no evidence for a relationship between halo and total luminosity: . The implication is that the tiniest satellite galaxies have dark matter densities indicative of dark matter halos that are at least as massive as those of systems 10,000 times more luminous.
The normalization of the Strigari et al. relation at is indicative of the central densities of massive dark matter subhalos (). As alluded to above, this mass-scale is fairly easy to explain in CDM models (Strigari et al., 2008; Macciò et al., 2009; Busha et al., 2009; Muñoz et al., 2009; Kravtsov, 2010; Li et al., 2009; Okamoto & Frenk, 2009; Stringer et al., 2009). However, the lack of observed correlation between and mass is quite unexpected. To put the lack of measured slope in the relation in perspective, consider the relationship between dark matter halo and galaxy luminosity required to match the faint-end slope of the galaxy luminosity function: with (Busha et al., 2009). Tully-Fisher studies suggest a relation that is even less steep for more massive systems, with (e.g., Stark et al., 2009; Courteau et al., 2007; McGaugh & Wolf, 2010). For dark matter halos of interest, with maximum circular velocities , we expect (assuming NFW fits to halos in Springel et al., 2008) such that the observed trend would naively imply with . This is a much steeper relationship than we expect from more luminous systems. The lack of inferred relationship between dSph luminosity and total halo mass is not an artifact of the specific choice of 300 pc for the mass comparison. If one performs the same comparison between galaxies using a smaller benchmark radius (100 pc, Strigari et al., 2008) or using the 3d half-light radius for each galaxy (Wolf et al., 2010) or using the 3d mass within the 2d half-light radius of each galaxy (Walker et al., 2009) then one reaches the same conclusion: there is no observed trend between inferred total halo mass (or ) and luminosity. 111Note that there is an observed trend between the mass within the half-light radius of each galaxy and the galaxy’s luminosity, but this simply reflects the fact that brighter galaxies have larger half-light radii. This trend is perfectly consistent with each of the galaxies being embedded within halos of approximately the same total mass (Walker et al., 2009; Wolf et al., 2010).
One possible explanation for this lack of mass trend is that it reflects a scale in galaxy formation, where the scatter in at fixed becomes very large, as might possibly be explained by feedback due to photoionization or suppression below the atomic cooling limit (Ricotti et al., 2008; Strigari et al., 2008; Macciò et al., 2009; Okamoto & Frenk, 2009; Stringer et al., 2009, and §3 below). Another possibility, outlined below, is that the lack of an observed trend between mass and luminosity is the product of selection bias: most ultrafaint galaxies do inhabit halos with , but they are too diffuse to have been discovered.


In the next section, we explain why we expect surface brightness selection bias to limit the discovery of satellite galaxies in small subhalos. In §3 we use a simple model to estimate the number of low surface brightness stealth galaxies within the vicinity of the Milky Way. Our estimates rely on the public subhalo catalogs provided by the Via Lactea 2 (VL2) N-body simulation group (Diemand et al., 2008). We explore two models. Our Fiducial Scenario connects each subhalo’s mass and accretion time to a galaxy luminosity by extrapolating the halo mass-light relationship required to match the asymptotic slope of the galaxy stellar mass function (Moster et al., 2009). Our secondary model (Threshold Scenario) explores a scenario where galaxy formation is truncated sharply below a characteristic dark halo mass scale. We present our findings in §4 and conclude in §5.
One of the goals of our model is to investigate how surface brightness detection limits can affect our interpretation of dwarf subhalo mass-luminosity trends. We will use as our primary mass variable for characterizing subhalo masses. As discussed earlier, can be measured directly for the N-body subhalos, but requires less extrapolation than when comparing to observational data. For the observational comparisons, we will use values derived by Strigari et al. (2008) for MW dwarfs. We emphasize that the choice of 300 pc is a practical one, with no special physical meaning, other than 300 pc is the median half-light radius of the dSph galaxies in our sample. Integrated masses within smaller radii cannot be resolved in the simulation. Eight of the nineteen galaxies we consider have 3d half-light radii smaller than 290 pc and there are four galaxies that do not have at least one kinematic stellar tracer beyond this radius. In these cases we are relying on the CDM-motivated prior of Strigari et al. (2008) to extrapolate masses out to 300 pc. Such an extrapolation is perfectly reasonable (and inevitable because of resolution) as long as our aim is to compare to predictions from the same theory that motivates the prior (as is the case here). The assigned error bars on the measured take into account uncertainties in the extrapolation encompassed by the theory, including an allowance for exponential mass truncation because of tides. We note that the instantaneous tidal radius of the closest dSph, Segue 1, is much larger than 300 pc (Geha et al. 2009). Moreover, by examining the orbits of subhalos in VL2, Rocha et al. (2010, in preparation) find that subhalos chosen to have radii and masses consistent with Segue 1, have past orbital trajectories and measured tidal radii that are larger than pc in the vast majority of cases.
2. Motivations
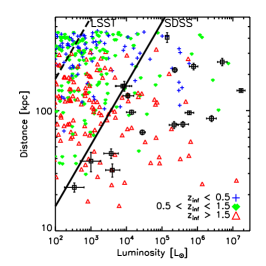
The left panel of Figure 1 shows the MW dSphs as tabulated in Wolf et al. (2010) plotted in the plane of helio-centric distance vs. V-band luminosity. The solid line (labeled SDSS) illustrates the distance to which dwarfs of a given luminosity can be detected in SDSS with 90% efficiency from Walsh et al. (2009). Similar results were presented by Koposov et al. (2008). The upper line shows the same limit adjusted up by scaling to the limiting magnitude of the full co-added LSST survey (Tollerud et al., 2008; Ivezic et al., 2008). Clearly, the known dwarf galaxies cluster at the current completeness edge of the diagram, indicating a high likelihood for future discoveries (Koposov et al., 2008; Tollerud et al., 2008; Walsh et al., 2009).
The distance-luminosity completeness limits presented by Walsh et al. (2009) and Koposov et al. (2008) are only applicable for systems with surface brightness brighter than mag arcsec-2 (Koposov et al., 2008, and G. Gilmore, M. Geha, and B. Willman, private communications). Systems more diffuse than this limit cannot be detected in SDSS with current methods, no matter their helio-centric distance. This phenomenon is illustrated qualitatively in the right panel of Figure 1, which presents the same set of MW dSphs in the plane of vs. . The solid line shows a constant peak (central) surface brightness for a Plummer profile
| (1) |
and corresponds to mag arcsec-2 for solar absolute magnitude . As in the distance-luminosity figure, the tendency for many of the fainter dwarfs to “pile up” near the surface brightness detection limit is suggestive. There is nothing ruling out the presence of a larger population of more extended systems that remain undetected because of their low surface brightness.
If a large number of diffuse, undetected galaxies do exist, they are likely associated with low-mass dark matter subhalos. One can understand this expectation by considering an spherically-symmetric galaxy that is in equilibrium with stellar density distribution and radial velocity profile that is embedded within a gravitationally-dominant dark matter halo mass profile . The Jeans equation is conveniently written as
| (2) |
where characterizes the tangential velocity dispersion and and . If we make the simplifying assumption that and constant, with then . For a fixed velocity dispersion, a more spatially extended profile (smaller ) requires a lower mass at fixed radius.
The same basic expectation follows in a more general context from the recent work of Wolf et al. (2010), who showed 222Under the assumption that the observed stellar velocity dispersion remains fairly flat with projected radius, as is the case with all of the well-studied systems. that the total mass of a quasi-spherical dSph galaxy within its 3d half-light radius may be determined accurately from the luminosity weighted line-of-sight velocity dispersion for general : . Mass determinations at larger and smaller radii require an extrapolation of the mass profile from that point, but given a theoretical prediction for the mass profile shape one can perform this extrapolation by simply normalizing at .
It is useful to rewrite the Wolf et al. (2010) mass estimator in terms of the implied circular velocity at :
| (3) |
Consider then a galaxy with velocity dispersion and luminosity embedded within a gravitationally-dominant dark matter halo described by a circular velocity curve that increases with radius as an approximate power law: . Equation 3 implies . As an example, for an NFW halo (Navarro et al., 1997) with we have and . Clearly, the galaxy becomes puffier as we decrease or . One implication is that if a galaxy has a stellar density that is just large enough to be detected, another galaxy with identical and will be undetectable if it happens to reside within a slightly less massive halo.
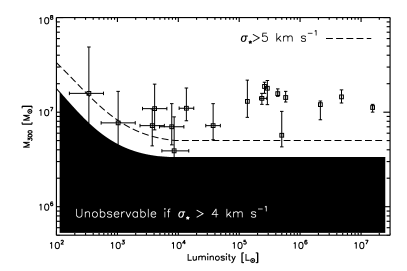
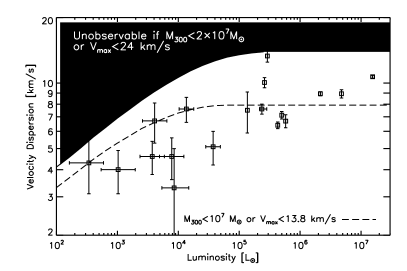
Figure 2 provides a more detailed exploration of the relationship between halo mass parameters ( or ) and associated dSph observables , , and . Points in the left panel of Figure 2 present vs. for MW dSph galaxies, with masses from Strigari et al. (2008) and luminosities updated as in Wolf et al. (2010). The right panel shows vs. for the same galaxies culled from Table 1 of Wolf et al. (2010).
The shaded bands and dashed lines in each panel of Figure 2 illustrate the way in which surface brightness incompleteness may affect these diagrams. In determining these regions we have assumed each dSph is dark-matter dominated, such that its gravitating mass profile produces an NFW circular velocity curve . Given the NFW shape, the rotation curve is fully specified by its peak value and the radius where the peak occurs (e.g., Bullock et al., 2001). We assume for simplicity that subhalos of a given map in a one-to-one way to a rotation curve shape using , which is indicative of median subhalos in high-resolution N-body simulations (intermediate between the normalizations of Springel et al. 2008 and Diemand et al. 2008). With this assumption in place, given a halo mass variable (e.g., or ), we may determine the implied half-light radius associated with any using (Equation 3).
In the right panel of Figure 2, galaxies residing in the shaded region are unobservable if they sit within dark matter halos less massive than or (equivalently for our assumptions) with peak circular velocity smaller than . Similarly, galaxies residing above the dashed line are too diffuse to be detected if they have or . Galaxies need to have deep potential wells if they are to remain observable at low luminosity for . If there are low-luminosity galaxies with values smaller than they would remain hidden as long as they have stellar velocity dispersions comparable to those of the known dwarfs. 333In deriving these regions, we have explicitly assumed that the stellar systems are dark-matter dominated within their half-light radii. The same arguments cannot be applied to globular cluster systems, some of which do inhabit the shaded regions in the right panel of Figure 2 without any discernible dark matter halo. These systems have large velocity dispersions simply because they have very high stellar densities.
A related set of limits in the – plane is depicted in the left panel of Figure 2. Galaxies sitting in the shaded band will have too large to be observable if they have . Slightly hotter galaxies, with will be unobservable if they sit below the dashed line. As expected, the hotter the galaxy, the deeper the potential well needs to be in order keep the stars confined to an observable surface brightness. We see that galaxies with residing in a halos less massive than will be too diffuse to be seen if they have . Note that for the constraint on allowed values is flat with because halos smaller than this value are kinematically forbidden via Equation 3. Specifically, kinematic mass determinations demand .
Implicit in the above discussion is the idea that a galaxy’s can be considered independently of its halo mass. Dynamically, the only constraint is that (Equation 3). One is more inclined to suspect that in an ultrafaint dSph is governed by star formation and galaxy formation processes, with an absolute minimum set by the effective temperature of the star forming ISM. Even for a very cold primordial effective ISM temperature, K, we expect , and this ignores turbulent and magnetic pressure terms. The vast majority of globular clusters have stellar velocity dispersions larger than this (Pryor & Meylan, 1993). Moreover, dark matter halos of all masses are expected to have experienced significant mergers in their early histories (e.g., Stewart et al., 2008). These mergers would have heated (the oldest) stars beyond any primordial pressurized motions, and this effect is indeed seen in cosmological simulations of dwarf galaxy formation (Ricotti, 2010).
In the next section we consider the implications of a model where is correlated with luminosity in a way that tracks the observed relationship (right panel of Figure 2). In principle, there could be a floor in the values allowed for dwarf galaxies. We do not impose such a floor in our calculations, but if one does exist, then our estimates could under-predict the fraction of stealth galaxies at low luminosities.
3. Model
We rely on the publicly released subhalo catalogs of the Via Lactea II N-body simulation (VL2 hereafter) as described in Diemand et al. (2008). The simulation adopts cosmological parameters from WMAP3 (Spergel et al., 2007) and tracks the formation of a Milky Way size dark matter halo with a highest particle-mass resolution of and force resolution of pc. The main halo has a radius of kpc, defined to enclose a mean density that is times the mean matter density of the universe, and an associated mass of . The public subhalo catalogs include , , and parameters for each bound system, as well as merger history information that allows us to track the redshift of infall for each subhalo and to determine its maximum attained mass prior to infall. Tests by the VL2 team suggest that the measured masses are good to about (random) owing to resolution effects (J. Diemand, private communication).
We assign light to each of our accreted dark matter subhalos by assuming that at each redshift there is a monotonic relationship between halo mass and galaxy stellar mass . This general approach is motivated by its demonstrated success in producing the clustering properties of galaxies larger than (Kravtsov et al., 2004a; Tasitsiomi et al., 2004; Vale & Ostriker, 2004; Conroy et al., 2006; Berrier et al., 2006; Purcell et al., 2007; Marín et al., 2008; Stewart et al., 2009; Conroy & Wechsler, 2009). Of course, cosmological abundance matching cannot be applied directly at the smallest stellar masses because of completeness issues. In our Fiducial Scenario we simply adopt the asymptotic – relationship suggested by the most complete stellar mass functions, which effectively assumes that there is no new (or abrupt) mass scale that truncates galaxy formation in small halos. We also explore a Threshold Scenario that imposes such a truncation scale (see below).
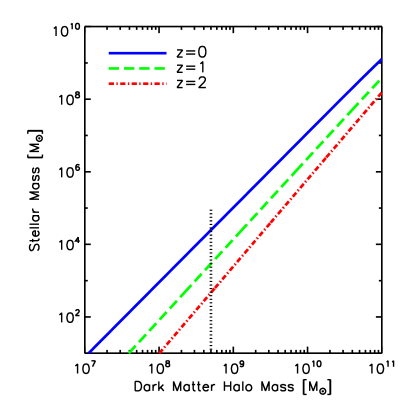
For our Fiducial Scenario, we assign to each subhalo by extrapolating the fitting formula presented by Moster et al. (2009) to small stellar masses. Moster et al. (2009) derived the relationship using N-body halo catalogs together with observationally inferred stellar mass functions for galaxies out to redshift . The implied (extrapolated) relationship between stellar mass and dark halo mass is presented in Figure 3 for three example redshifts. We see that must decrease at high redshift for a fixed in order to explain the evolving stellar mass function. Low-mass halos at high redshift have not had time to form as many stars as their counterparts. For our Threshold Scenario we adopt the same mapping for massive halos but we impose a sharp truncation in the - relation at (dotted line in Figure 3).
We assume that star formation is quenched in each subhalo at a time after the redshift of accretion into the VL2 host. Specifically, subhalo light content is determined at redshift (set at a time after the accretion redshift) using the appropriate Moster et al. (2009) mapping with , the maximum mass each subhalo progenitor obtained prior to infall. If the subhalo is accreted at a time less than before we adopt the Moster et al. (2009) relation at . For the figures we present below we use a quenching timescale that is roughly a dynamical time for the host halo Gyr. We find that the value of only affects our predictions for the largest satellites . For example, if we set , we under-predict the number of luminous satellites by a few, but the low-luminosity satellite count is largely unaffected. The main conclusions of this paper regarding the least luminous, stealth satellites are not sensitive to the choice of . For all satellites, we convert from stellar mass to V-band luminosity using , which is typical for Milky Way dSphs according to Martin et al. (2008) for a Kroupa IMF.
In assigning luminosities to dark matter subhalos at the time of infall, we are effectively assuming that the majority of surviving dark matter halos in our model have lost very little stellar mass after infall (though almost all of them lose dark matter mass). We do make a crude self-consistency check for stellar tidal mass loss below, but find that it is not significant in most cases. The idea that stellar mass loss has been minimal for dense, bound dark substructures in the halo is difficult to test empirically with existing dwarf data (e.g., Peñarrubia et al., 2009). Therefore, in order to check whether this assumption is reasonable (at least in the context of the CDM-based model we explore here), we examined the output the Bullock & Johnston (2005) simulations, which modeled hundreds of satellite accretions each for 11 CDM merger histories using cosmologically-derived accretion times and orbits, set within an evolving Milky-Way-like disk and dark halo potential. We found that the overwhelming majority of satellite-subhalos that survived with bound dark matter halo cores ( km s-1) experienced no stellar mass loss. Indeed, 93% of the surviving dwarf galaxies in the Bullock & Johnston (2005) simulations lost less than 10% of their initial stellar material. The only surviving systems that show any stellar mass loss are those that have lost more than 90% of their initial dark matter mass. Stellar mass loss becomes typical (affecting more than 50% of systems) only in the minority of subhalos that have lost more than 95% of their initial dark matter mass. Moreover, we find no significant trend between current Galacto-centric distance and stellar mass loss in the simulated satellites. These facts provide encouraging support to the simple assumptions we adopt here.
Once is determined for each subhalo, we assign a stellar velocity dispersion by adopting the empirical relation shown in the right panel of Figure 2:
| (4) |
with a log normal scatter of at fixed L (as measured in the data). 444We do not account for any systematic surface brightness bias that would lead to high systems being missed (as these are the systems that will have large ). By ignoring this effect we are systematically under-estimating the possible number of stealth galaxies. Here, we are assigning stellar velocity dispersions to our subhalos at z = 0 using a relation measured for real Milky Way dSphs. This means that the assignment is reasonable for subhalos, modulo the concern discussed above regarding stellar mass loss. 555Of course, if there is stellar mass loss, the least-bound (hottest) stars are stripped first, and this causes the velocity dispersion and luminosity to evolve in concert, as detailed in Peñarrubia et al. (2008b) for several example orbits.
Once is assigned, we determine using (Equation 2). The and values that define are those measured for each subhalo in the simulation (at the present day, not at the time of infall). Specifically, we are extrapolating the density profiles of the subhalos to radii pc that are not well resolved in the simulation. While this extrapolation is reasonable, it means that our derived values are reliant on this assumption.

For simplicity, we assume that each dwarf galaxy follows a Plummer profile, with a peak surface density given by Equation 1. As discussed above, galaxies with are assumed to be undetectable with standard techniques. We note that if we impose a floor in allowed velocity dispersions near then our results do not change dramatically.
The final step in our procedure is a self-consistency check to see if our implied values are small enough for the galaxies to be relatively unaffected by tidal stripping. In order to do this we estimate a tidal radius for each galaxy and remove galaxies from our catalogs if on the assumption that most of their stars will have been tidally liberated (even though a dark matter core remains bound). It is well known that a subhalo’s rotation curve should decline more rapidly than an NFW profile for because of tidal effects (Kazantzidis et al., 2004). This means that provides a reasonable estimate for the gravitational tidal radius of a galaxy embedded within that subhalo. We find that 2% (10%) of our galaxies with (10 ) have , and that the majority of these systems have lost more than 90% of their dark matter mass since falling into the host. Physically, these objects with represent systems that are losing stellar material. We will not explore the observational implications of this evaporating population here, but this definition may prove useful for future theoretical explorations aimed at predicting the fraction of dwarf satellites that should be showing signs of ongoing stellar stripping. By excluding these stripped galaxies with large values from our estimates we are being conservative in the sense that we are under-estimating the stealth population by 10% for . Peñarrubia et al. (2008b) have argued that systems that are losing stellar material such as these can actually evolve towards higher mass to light ratios once the total bound mass within the stellar core decreases by . The central surface brightness typically drops by about 2 magnitudes during the process as the stellar system expands to adjust for the loss of central mass. Further investigation of this possibility and its implications for the stealth galaxy population is warranted, but beyond the scope of this paper.
Before moving on to our results, we mention that the halo finder and the associated definition of halo mass used by Moster et al. (2009) in our stellar mass assignment differ slightly from those used in the VL2 catalogs. We estimate that this amounts to a difference in dark matter halo mass association for any individual object, a difference that is not significant given the exploratory nature of this work.
4. Results
Figure 4 provides a summary of our fiducial model predictions compared to current observations: galaxy vs. luminosity (left), helio-centric distance vs. luminosity (middle), and cumulative number vs. luminosity (right). The small colored symbols in the left and middle panels are model galaxies, with color and symbol type indicating three infall redshift bins with (red triangles), (green diamonds), and (blue plusses). The larger, black squares reproduce the MW dSph data from Figure 1. In the middle panel, the helio-centric distance for model galaxies is measured from an arbitrary point 8 kpc from the host dark matter halo center. Our gross results are independent of this choice for solar location.
Model galaxies above the solid line in the left panel of Figure 4 are too diffuse to have been detected. Clearly, this population is significant. At fixed luminosity, systems above the solid line ( mag arcsec-2) tend to have been accreted more recently (blue plusses were accreted since ). This trend follows directly from our redshift-dependent mapping between and halo mass – at fixed stellar mass, the required halo mass increases with redshift (Figure 3) and, as discussed above, more massive halos tend to host more concentrated stellar distributions for a given and . We note that for brighter luminosities our systems tend to be smaller in physical size than the observed MW dwarfs. As discuss below, this is related to the fact that they inhabit more massive dark matter subhalos () than than appears to be the case for the MW dwarfs. The right panel of Figure 4 reveals that there is a slight tendency for early-accreted galaxies (red triangles with ) to be closer to the Sun than more recently-accreted galaxies (middle panel). This biases them to host older stellar populations.
The dotted line in the right panel of Figure 4 shows the predicted luminosity function of satellites that are observable for an SDSS-like survey covering the full sky according to the luminosity-distance completeness limits of Walsh et al. (2009). This should be compared to the data points, which reflect the current MW satellite population corrected for sky-coverage as in Tollerud et al. (2008). The uncertainty in the sky-coverage correction (associated with the possibility of an anisotropic satellite distribution on the sky) is similar to the size of the points (Tollerud et al. 2008). We see that the predicted and observed populations are roughly consistent. The solid line shows the predicted luminosity function for all satellites within 400 kpc, without any allowance for observational incompleteness. The dashed line, on the other hand, shows the subset of those galaxies that have peak stellar surface densities that are bright enough to be discovered with standard techniques. We see that roughly half of the systems that are in principle luminous enough to be detected with deep surveys like LSST (with ) have peak surface densities that are too diffuse to be seen. Specifically, even a survey like LSST, with a very deep limiting magnitude, will have difficulties detecting these systems without new observing strategies.
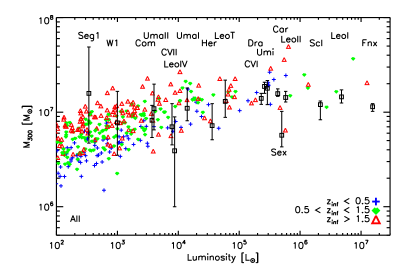
Figure 5 explores how detection bias affects the Strigari plot. In the upper panel, we show vs. for all model satellites within 400 kpc of the Sun (color/type scheme is the same as in Figure 4) compared to the MW dSphs (black squares). We see that unlike the data, there is a significant population of predicted galaxies with low central densities for . Moreover, while the data follow a nearly common-mass relation for vs. , the model points prefer a steeper trend: with (as expected from abundance matching). The model predictions are very similar to those presented in many past CDM-based explorations of satellite values (e.g. Busha et al., 2009; Muñoz et al., 2009). The similarity between our model results and those of Muñoz et al. (2009), in particular, are encouraging. These authors use the same VL2 catalog that we use, but they explored a more sophisticated model for assigning light to subhalos. Generally, a population of satellite galaxies with seems to be a fairly robust expectation for hierarchical models, especially if cooling plays a role in the formation stars in surviving galaxy halos at (Muñoz et al., 2009).
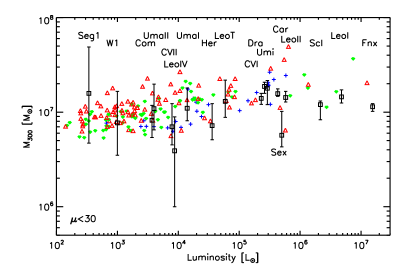
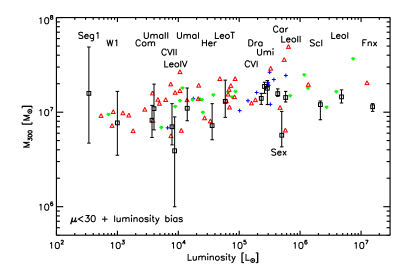
The middle panel of Figure 5 includes only those model galaxies that have peak surface brightness mag arcsec-2. We see that this requirement immediately removes the population of objects. The lower panel includes only those galaxies that meet both the surface brightness requirement and the luminosity-distance requirement for SDSS discovery. We see that the resultant population of observable model galaxies has values that are very much in line with those of the known MW dSphs. The model we have adopted therefore reproduces both the luminosity function and something close to the mass-luminosity trend seen for Milky Way dwarfs, once all of the relevant selection bias effects are taken into account.
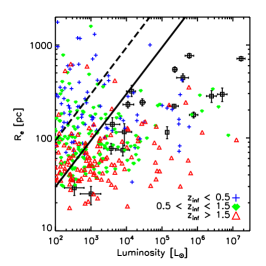
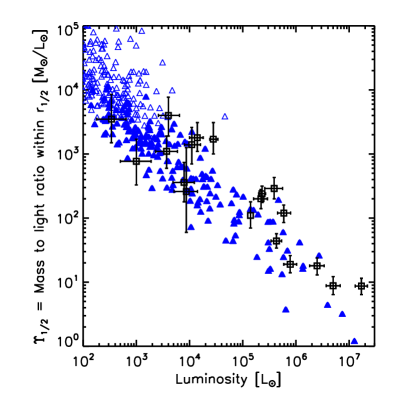
While we predict that stealth galaxies reside within dark matter subhalos that have the smallest total mass (as characterized by or ), this does not mean that these systems will have small dark matter fractions within their stellar extents. On the contrary, stealth galaxies have large half-light radii for their luminosities, and therefore sample a large portion of their dark matter halos. Indeed stealth galaxies should be more dark matter dominated within their stellar radii than higher surface brightness ultra-faint dwarfs. It is straightforward to understand this by considering the integrated mass within its 3d half-light radius (Wolf et al. 2010): . For a fixed velocity dispersion (which we assume is dictated, on average, by luminosity) systems with larger half-light radii will have proportionally larger half-light masses. Without some theoretical prior, this mass by itself tells us little about the total dark matter halo mass of the dSph host subhalo, but it does enable an easy measure of the mass-to-light ratio within the half-light radius .
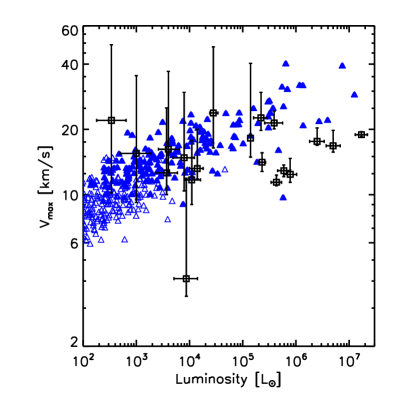
The left panel of Figure 6 shows vs. L for the MW dwarfs (open squares from Wolf et al., 2010) compared to our Fiducial model galaxies (filled and open triangles). The right panel of Figure 6 shows the same simulation data with the same symbol types but now with halo vs. L. The MW dwarf estimates are obtained with a CDM subhalo prior as described in Wolf et al. (in preparation). The solid triangles correspond to predicted galaxies that are concentrated enough to be detected by current methods and open triangles show predicted stealth galaxies ( mag arcsec-2). As expected, the stealth galaxies are biased to more dark matter dominated within than are their higher surface brightness counterparts. The implication is that stealth galaxies should have integrated mass-to-light ratios upwards of . Again, this is a direct result of the fact that they have large half-light radii. As illustrated in the right panel, the same galaxies actually reside within subhalos that are less massive overall, with values that are systematically smaller than km s-1. It is important to remind the reader that the precise values of for pc in the theory points are derived by extrapolating the subhalo profiles inward to radii that are not well-resolved in the simulation. On the other hand, the values for the data are extrapolated outward from . So while neither comparison is ideal, the approximations are reasonable, and the qualitative behavior that distinguishes stealth galaxies from more readily observable galaxies is expected to be robust. Note that the predicted galaxies at the bright end of the luminosity distribution are both too small (with lower values than the data in the left panel) and too massive (higher values than the data in the right panel). This is the same problem discussed above in association with Figure 4, and stems from the fact that the VL2 simulation contains several subhalos that are more massive than any of the dSph satellites of the Milky Way.
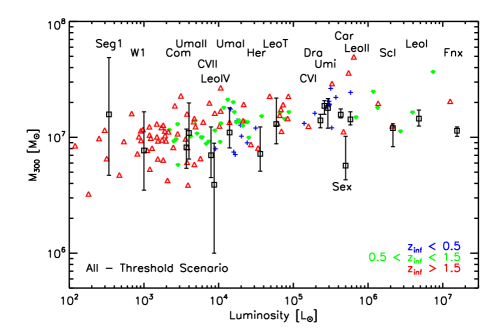

Of course, if the smallest dark matter halos do not contain galaxies at all, then the likelihood for a significant stealth galaxy population is much reduced. We explore this expectation with our Threshold Scenario, which imposes a sharp scale in galaxy formation at . Below this scale dark matter halos are completely devoid of stars (vertical line in Figure 3). The resultant Strigari plot and luminosity functions for this model are shown in Figure 7. Like the Fiducial Scenario, the Threshold Scenario also reproduces the observed satellite luminosity function (right panel). However, unlike in the Fiducial Scenario, we now expect only a handful of stealth galaxies that remain undiscovered (solid vs. dashed lines). The Threshold case also yields a Strigari relation that is in reasonable agreement with the data (left panel), without appealing to any selection bias. Another distinct difference in the Threshold Scenario is that all of the low-luminosity galaxies are expected to be quite old (or at least to have been accreted early ).
One problem with both of our models is that they produce too many massive dwarf satellites with compared to the data (Figures 5, 6, and 7). This has nothing to do with our method of light assignment. There are simply too many massive subhalos in the VL2 halo when compared to the MW satellite population. The same problem is responsible for the fact that our model galaxies tend to be too small at compared to the data in the left panel of Figure 4. These model galaxies reside in subhalos that are more massive than the subhalos that host the brightest galaxies in the Milky Way, and this confines their stars to a characteristically smaller radius. Of course, this issue may simply reflect cosmic variance in the subhalo populations from galaxy to galaxy, but it could be attributed to the fact that VL2 represents a slightly more massive halo than the Milky Way’s dark matter halo.
It is important to mention that the masses in Figures 2, 5 and 7 are taken directly from the spherical Jeans modeling of Strigari et al. (2008). A more recent analysis of membership in the Hercules dwarf (labeled Her in Figures 5 and 7) by Adén et al. (2009) suggests that the actual mass for this system is about a factor of lower than the value we have used. Though this result does not change the fact that there is no strong observed trend between and in the data, it does make the mass of Hercules more difficult to explain in our model (and in almost all CDM-based models to date). In the right panel of Figure 2, the Adén et al. (2009) velocity dispersion for Hercules would shift the point at down to the edge of its error-bar – clearly low enough that this system would not be expected to be stealth according to our definition. The fact that the velocity dispersion shifts this much by removing or adding a few stars suggests that there is a large membership-related systematic error that needs to be taken into account in the mass modeling. 666This is not the only systematic uncertainty. As the most elongated of the dSphs known, Hercules is not particularly well suited for spherical Jeans modeling in the first place. More work on the issue of membership and mass modeling in this interesting object is certainly warranted.
5. Conclusions and Discussion
We have argued that there is likely a population of low-luminosity satellite galaxies orbiting within the halo of the Milky Way that are too diffuse to have been detected with current star-count surveys, despite the fact that they have luminosities similar to those of known ultrafaint MW dSphs. These stealth galaxies should preferentially inhabit the smallest dark matter subhalos that host stars (). One implication is that selection bias (Figures 2 and 5) may play a role explaining the apparent common mass scale for MW dSph galaxies (Strigari et al., 2008; Peñarrubia et al., 2008a; Walker et al., 2009; Wolf et al., 2010). It also implies that searches for the lowest mass ‘fossil’ galaxies left over from reionization may be hindered by surface brightness limits. This latter point was made earlier by Bovill & Ricotti (2009). According to our fiducial estimates, potentially half of several hundred satellite galaxies that could be observable by surveys like LSST are stealth (Figure 4).
We developed a plausible estimate for the number and character of MW stealth satellites using the subhalo catalogs of the VL2 simulation (Diemand et al., 2008). We assigned light to subhalos by extrapolating the dark matter mass-light relationship required to reproduce bright galaxy number counts (Moster et al., 2009) and we assigned stellar velocity dispersions to each system by adopting the empirical relationship between and for known Milky Way dwarfs. Finally, galaxy sizes were computed using the dynamical relationship between and for the measured dark matter halo densities in each subhalo (Equation 3). The resultant model galaxy population includes a substantial fraction of ultrafaint galaxies that are stealth, with peak surface brightness mag arcsec-2.
We also explored the possibility that there is a sharp threshold in galaxy formation at a halo mass of . This idea follows from the common mass conjecture in Strigari et al. (2008) and remains viable since it reproduces the observed Milky Way satellite luminosity function as well as a fairly weak vs. trend without appealing to selection bias (Figure 6). In this scenario, all satellite galaxies are born within halos that are quite dense, and therefore the number of predicted stealth galaxies (which preferentially inhabit the smallest dark matter halos) is significantly reduced (Figure 6). Moreover, we expect that all of the low-luminosity satellites will have been accreted since (Figure 6) and that they will all host old stellar populations. This is not necessarily the case in our Fiducial Scenario, where the most distant and low-mass subhalos may host ultrafaint galaxies that contain intermediate-age stars.
A significant shortcoming in our approach is the complete lack of accounting for the effect of baryons on the density structure, distribution, and number counts of dwarf galaxy subhalos. The VL2 simulation that we have used is purely dissipationless, and therefore lacks a central disk component, which would act to enhance subhalo mass loss and selectively eliminate subhalos that cross near the disk region (D’Onghia et al., 2010; Penarrubia et al., 2010). At the same time, it also lacks the inclusion of any gasdynamical effects such as adiabatic contraction, which can increase the central densities of subhalos with stars. In fact, Wadepuhl & Springel (2010) found that subhalo values tend to increase for the most luminous satellites () in cosmological simulations. Their simulations self-consistently form a central galaxy and produce a satellite population that matches the bright end of the luminosity function of Milky Way dSphs, so the direction of the effect needs to be taken seriously. However, the degree to which baryons can enhance the densities of massive subhalos is uncertain and model specific, as certain wind models can also act to evacuate mass from the centers of dwarf galaxies (Governato et al., 2010). All of these concerns emphasize the need for further work in the attempt to make sense of observed dwarf galaxy structural properties. At this time it is difficult to know how baryons would affect our estimates for stealth galaxy counts. For the faint galaxies of concern, there is very little baryonic material left to have driven contraction, while significant central mass loss from winds or global dark matter mass loss from tides are both possible. For systems that remain bound, these effects will increase the likelihood for them to be low surface brightness, as galaxies will tend to expand as their global dark matter potential depth decreases. On the other hand, mass loss also enhances the rate of disruption, and can deplete the overall number of satellites. Given that our current model seems to reproduce the observed luminosity function (and mass function) fairly well, one could argue that depletion has not been too much of an issue.
It is well known that galaxy formation has a primary scale – the scale that gives rise to the cutoff in galaxy counts at the bright end of the luminosity function. We do not know if there is a second scale that operates at the low-luminosity end. One implication of our findings is that a complete search for very low surface brightness satellite galaxies of the Milky Way can help determine whether or not there is a second scale in galaxy formation. If very few stealth galaxies are discovered, this will be an indication that there are no very low mass halos that host stars. A similar effect would be seen if there were simply a truncation in the power spectrum, as might be expected in KeV WDM models (Strigari et al., 2008; Macciò & Fontanot, 2009). In this sense, the discovery of many stealth galaxies in the halo would provide a means to constrain dark matter particle properties in addition to galaxy formation physics.
Kollmeier et al. (2009) have performed kinematic follow-up observations of the Pices Overdensity (also called Structure J) at a distance of kpc and have argued that it may be a very low surface brightness dwarf galaxy. If this is true then it represents the first detection of a stealth dwarf galaxy in the halo of the Milky Way. Unlike the well-known ultrafaint dSphs of the Milky Way, which were discovered as overdensities in RGB or MS turnoff stars, this system was discovered as an excess in RR Lyrae variables in the multi-epoch SDSS Stripe-82 (Watkins et al., 2009; Sesar et al., 2007). We caution that one potential problem with the stealth-galaxy interpretation of the Pices Overdensity comes from Sharma et al. (in preparation), who have used 2MASS data to show that this structure is consistent with being part of a larger overdensity of stars, in which case it is unlikely to be a bound dwarf. Deeper, wide-field imaging and spectroscopic follow-up will be required to determine the nature of this interesting structure.
It is reassuring to note that upcoming deep, time-resolved sky surveys and associated follow-up campaigns with 30m-class telescopes offer significant hope for the discovery of hundreds of new dwarf galaxy companions of the Milky Way (Tollerud et al. 2008). Repeated sky surveys like Pan-STARRS and LSST may provide the best hope for discoveries in the future. Not only will they allow the identification of variable tracers, but they will also enable concurrent use of bulk proper motions. Confident searches within these data offer a means to limit the overall count of stealth galaxies that lurk at very low surface brightness and to provide unparalleled constraints on the efficiency of galaxy formation in the smallest dark matter halos.
References
- Adén et al. (2009) Adén, D., Wilkinson, M. I., Read, J. I., Feltzing, S., Koch, A., Gilmore, G. F., Grebel, E. K., & Lundström, I. 2009, ApJL, Accepted, ArXiv:0910.1348
- Belokurov et al. (2007) Belokurov, V., et al. 2007, ApJ, 654, 897
- Belokurov et al. (2009) —. 2009, MNRAS, 397, 1748
- Berrier et al. (2006) Berrier, J. C., Bullock, J. S., Barton, E. J., Guenther, H. D., Zentner, A. R., & Wechsler, R. H. 2006, ApJ, 652, 56
- Bovill & Ricotti (2009) Bovill, M. S., & Ricotti, M. 2009, ApJ, 693, 1859
- Bullock & Johnston (2005) Bullock, J. S., & Johnston, K. V. 2005, ApJ, 635, 931
- Bullock et al. (2001) Bullock, J. S., Kolatt, T. S., Sigad, Y., Somerville, R. S., Kravtsov, A. V., Klypin, A. A., Primack, J. R., & Dekel, A. 2001, MNRAS, 321, 559
- Bullock et al. (2000) Bullock, J. S., Kravtsov, A. V., & Weinberg, D. H. 2000, ApJ, 539, 517
- Busha et al. (2009) Busha, M. T., Alvarez, M. A., Wechsler, R. H., Abel, T., & Strigari, L. E. 2009, ApJ, Submitted, ArXiv:0901.3553
- Conroy & Wechsler (2009) Conroy, C., & Wechsler, R. H. 2009, ApJ, 696, 620
- Conroy et al. (2006) Conroy, C., Wechsler, R. H., & Kravtsov, A. V. 2006, ApJ, 647, 201
- Courteau et al. (2007) Courteau, S., Dutton, A. A., van den Bosch, F. C., MacArthur, L. A., Dekel, A., McIntosh, D. H., & Dale, D. A. 2007, ApJ, 671, 203
- Diemand et al. (2008) Diemand, J., Kuhlen, M., Madau, P., Zemp, M., Moore, B., Potter, D., & Stadel, J. 2008, Nature, 454, 735
- D’Onghia et al. (2010) D’Onghia, E., Springel, V., Hernquist, L., & Keres, D. 2010, ApJ, 709, 1138
- Geha et al. (2009) Geha, M., Willman, B., Simon, J. D., Strigari, L. E., Kirby, E. N., Law, D. R., & Strader, J. 2009, ApJ, 692, 1464
- Gnedin & Kravtsov (2006) Gnedin, N. Y., & Kravtsov, A. V. 2006, ApJ, 645, 1054
- Governato et al. (2010) Governato, F., et al. 2010, Nature, 463, 203
- Grillmair (2006) Grillmair, C. J. 2006, ApJ, 645, L37
- Grillmair (2009) —. 2009, ApJ, 693, 1118
- Hayashi et al. (2003) Hayashi, E., Navarro, J. F., Taylor, J. E., Stadel, J., & Quinn, T. 2003, ApJ, 584, 541
- Ivezic et al. (2008) Ivezic, Z., et al. 2008, ArXiv:0805.2366
- Kazantzidis et al. (2004) Kazantzidis, S., Mayer, L., Mastropietro, C., Diemand, J., Stadel, J., & Moore, B. 2004, ApJ, 608, 663
- Kirby et al. (2008) Kirby, E. N., Simon, J. D., Geha, M., Guhathakurta, P., & Frebel, A. 2008, ApJ, 685, L43
- Klypin et al. (1999) Klypin, A., Kravtsov, A. V., Valenzuela, O., & Prada, F. 1999, ApJ, 522, 82
- Kollmeier et al. (2009) Kollmeier, J. A., et al. 2009, ApJ, 705, L158
- Koposov et al. (2008) Koposov, S., et al. 2008, ApJ, 686, 279
- Kravtsov (2010) Kravtsov, A. 2010, Advances in Astronomy, 2010
- Kravtsov et al. (2004a) Kravtsov, A. V., Berlind, A. A., Wechsler, R. H., Klypin, A. A., Gottlöber, S., Allgood, B., & Primack, J. R. 2004a, ApJ, 609, 35
- Kravtsov et al. (2004b) Kravtsov, A. V., Gnedin, O. Y., & Klypin, A. A. 2004b, ApJ, 609, 482
- Li et al. (2009) Li, Y., Helmi, A., De Lucia, G., & Stoehr, F. 2009, MNRAS, 397, L87
- Macciò & Fontanot (2009) Macciò, A. V., & Fontanot, F. 2009, ArXiv:0910.2460
- Macciò et al. (2009) Macciò, A. V., Kang, X., & Moore, B. 2009, ApJ, 692, L109
- Madau et al. (2008) Madau, P., Kuhlen, M., Diemand, J., Moore, B., Zemp, M., Potter, D., & Stadel, J. 2008, ApJ, 689, L41
- Majewski et al. (2007) Majewski, S. R., et al. 2007, ApJ, 670, L9
- Marín et al. (2008) Marín, F. A., Wechsler, R. H., Frieman, J. A., & Nichol, R. C. 2008, ApJ, 672, 849
- Martin et al. (2008) Martin, N. F., de Jong, J. T. A., & Rix, H.-W. 2008, ApJ, 684, 1075
- Martin et al. (2007) Martin, N. F., Ibata, R. A., Chapman, S. C., Irwin, M., & Lewis, G. F. 2007, MNRAS, 380, 281
- Martin et al. (2009) Martin, N. F., et al. 2009, ApJ, 705, 758
- McGaugh & Wolf (2010) McGaugh, S. S., & Wolf, J. 2010, ArXiv e-prints
- Moore et al. (1999) Moore, B., Ghigna, S., Governato, F., Lake, G., Quinn, T., Stadel, J., & Tozzi, P. 1999, ApJ, 524, L19
- Moster et al. (2009) Moster, B. P., Somerville, R. S., Maulbetsch, C., van den Bosch, F. C., Maccio’, A. V., Naab, T., & Oser, L. 2009, ApJ, Submitted, ArXiv:0903.4682
- Muñoz et al. (2009) Muñoz, J. A., Madau, P., Loeb, A., & Diemand, J. 2009, MNRAS, Accepted, ArXiv:0905.4744
- Navarro et al. (1997) Navarro, J. F., Frenk, C. S., & White, S. D. M. 1997, ApJ, 490, 493
- Okamoto & Frenk (2009) Okamoto, T., & Frenk, C. S. 2009, MNRAS, L315+
- Orban et al. (2008) Orban, C., Gnedin, O. Y., Weisz, D. R., Skillman, E. D., Dolphin, A. E., & Holtzman, J. A. 2008, ApJ, 686, 1030
- Peñarrubia et al. (2008a) Peñarrubia, J., McConnachie, A. W., & Navarro, J. F. 2008a, ApJ, 672, 904
- Peñarrubia et al. (2008b) Peñarrubia, J., Navarro, J. F., & McConnachie, A. W. 2008b, ApJ, 673, 226
- Peñarrubia et al. (2009) Peñarrubia, J., Navarro, J. F., McConnachie, A. W., & Martin, N. F. 2009, ApJ, 698, 222
- Penarrubia et al. (2010) Penarrubia, J., Benson, A. J., Walker, M. G., Gilmore, G., McConnachie, A., & Mayer, L. 2010, ArXiv e-prints
- Pryor & Meylan (1993) Pryor, C., & Meylan, G. 1993, in Astronomical Society of the Pacific Conference Series, Vol. 50, Structure and Dynamics of Globular Clusters, ed. S. G. Djorgovski & G. Meylan, 357–+
- Purcell et al. (2007) Purcell, C. W., Bullock, J. S., & Zentner, A. R. 2007, ApJ, 666, 20
- Ricotti (2010) Ricotti, M. 2010, Advances in Astronomy, 2010
- Ricotti & Gnedin (2005) Ricotti, M., & Gnedin, N. Y. 2005, ApJ, 629, 259
- Ricotti et al. (2002) Ricotti, M., Gnedin, N. Y., & Shull, J. M. 2002, ApJ, 575, 33
- Ricotti et al. (2008) —. 2008, ApJ, 685, 21
- Sesar et al. (2007) Sesar, B., et al. 2007, AJ, 134, 2236
- Simon & Geha (2007) Simon, J. D., & Geha, M. 2007, ApJ, 670, 313
- Spergel et al. (2007) Spergel, D. N., et al. 2007, ApJS, 170, 377
- Springel et al. (2008) Springel, V., et al. 2008, MNRAS, 391, 1685
- Stark et al. (2009) Stark, D. V., McGaugh, S. S., & Swaters, R. A. 2009, AJ, 138, 392
- Stewart et al. (2009) Stewart, K. R., Bullock, J. S., Barton, E. J., & Wechsler, R. H. 2009, ApJ, 702, 1005
- Stewart et al. (2008) Stewart, K. R., Bullock, J. S., Wechsler, R. H., Maller, A. H., & Zentner, A. R. 2008, ApJ, 683, 597
- Stoehr et al. (2002) Stoehr, F., White, S. D. M., Tormen, G., & Springel, V. 2002, MNRAS, 335, L84
- Strigari et al. (2007a) Strigari, L. E., Bullock, J. S., & Kaplinghat, M. 2007a, ApJ, 657, L1
- Strigari et al. (2007b) Strigari, L. E., Bullock, J. S., Kaplinghat, M., Diemand, J., Kuhlen, M., & Madau, P. 2007b, ApJ, 669, 676
- Strigari et al. (2008) Strigari, L. E., Bullock, J. S., Kaplinghat, M., Simon, J. D., Geha, M., Willman, B., & Walker, M. G. 2008, Nature, 454, 1096
- Stringer et al. (2009) Stringer, M., Cole, S., & Frenk, C. 2009, ArXiv e-prints
- Tasitsiomi et al. (2004) Tasitsiomi, A., Kravtsov, A. V., Wechsler, R. H., & Primack, J. R. 2004, ApJ, 614, 533
- Tollerud et al. (2008) Tollerud, E. J., Bullock, J. S., Strigari, L. E., & Willman, B. 2008, ApJ, 688, 277
- Vale & Ostriker (2004) Vale, A., & Ostriker, J. P. 2004, MNRAS, 353, 189
- Wadepuhl & Springel (2010) Wadepuhl, M., & Springel, V. 2010, ArXiv e-prints
- Walker et al. (2009) Walker, M. G., Mateo, M., Olszewski, E. W., Peñarrubia, J., Wyn Evans, N., & Gilmore, G. 2009, ApJ, 704, 1274
- Walsh et al. (2009) Walsh, S. M., Willman, B., & Jerjen, H. 2009, AJ, 137, 450
- Watkins et al. (2009) Watkins, L. L., et al. 2009, MNRAS, 398, 1757
- Willman et al. (2005) Willman, B., et al. 2005, ApJ, 626, L85
- Wolf et al. (2010) Wolf, J., Martinez, G. D., Bullock, J. S., Kaplinghat, M., Geha, M., Munoz, R. R., Simon, J. D., & Avedo, F. F. 2010, MRNAS, accepted, ArXiv:0908.2995
- Zentner & Bullock (2003) Zentner, A. R., & Bullock, J. S. 2003, ApJ, 598, 49
- Zucker et al. (2006) Zucker, D. B., et al. 2006, ApJ, 643, L103