Environmental Effects in the Evolution of Galactic Bulges
Abstract
We investigate possible environmental trends in the evolution of galactic bulges over the redshift range 0 0.6. For this purpose, we construct the Fundamental Plane (FP) for cluster and field samples at redshifts = 0.4 and = 0.54 using surface photometry based on imaging and velocity dispersions based on Keck spectroscopy. As a reference point for our study we include data for pure ellipticals, which we model as single-component Sérsic profiles; whereas for multi-component galaxies we undertake decompositions using Sérsic and exponential models for the bulge and disk respectively. Although the FP for both distant cluster and field samples are offset from the local relation, consistent with evolutionary trends found in earlier studies, we detect significant differences in the zero point of 0.2 dex between the field and cluster samples at a given redshift. For both clusters, the environmentally-dependent offset is in the sense expected for an accelerated evolution of bulges in dense environments. By matching the mass range of our samples, we confirm that this difference does not arise as a result of the mass-dependent downsizing effects seen in larger field samples. Our result is also consistent with the hypothesis that – at fixed mass and environment – the star formation histories of galactic bulges and pure spheroids are indistinguishable, and difficult to reconcile with the picture whereby the majority of large bulges form primarily via secular processes within spiral galaxies.
Subject headings:
galaxies: spiral — galaxies: evolution — galaxies: formation — galaxies: stellar content1. Introduction
A spheroid can exist as an independent structure, i.e. a pure elliptical galaxy, or it can be surrounded by a disk component, i.e. the bulges of spiral and lenticular galaxies. Good progress has been achieved in the past decade in constraining the past star formation history of spheroid-dominated E/S0 galaxies through studies of the redshift-dependent Fundamental Plane (FP) - the relation between galaxy size, surface brightness, and stellar velocity dispersion (e.g. Treu et al. 2002; Treu et al. 2005; van Dokkum & van der Marel 2007). More recently, these analyses have been extended to include the bulges of spiral galaxies (MacArthur et al. 2008, hereafter Mac08; Hathi et al. 2009), allowing a direct comparison between the mass assembly history of pure spheroids and those residing in disks. This enables us to test the simple conjecture that galactic bulges share a similar assembly history to isolated spheroids and are not, at least to first order, significantly influenced in their growth by disk-related processes. While the bulge samples remain small and can only currently be compiled to redshifts 1, the general picture that has emerged is that both isolated spheroids and galactic bulges evolved at a similar rate for a given spheroid mass and with similar mass-dependent trends. In particular, for both systems the less massive examples have witnessed more recent activity whereas the most massive ones formed the vast majority of their stars at high redshift ( 2).
A key question of interest for both bulges and isolated spheroids is the role of the local environment. While the influence of the local environment on the morphological mix (Dressler 1980; Smith et al. 2005), colors (Bamford et al. 2009), mass-to-light ratios (Moran et al. 2005; hereafter M05), and star formation rates (Lewis et al. 2002; Kauffmann et al. 2004; Cooper et al. 2008) of galaxies is now well-established, some studies have emphasized the importance of mass as the governing evolutionary factor (e.g. Treu et al. 2005; Mac08). Separating the effects of mass from that of environmental density is thus clearly important. Environmental trends are qualitatively consistent with the predictions of popular structure formation models where growth is accelerated in more massive halos which start their collapse at earlier times (Governato et al. 2008). By contrast, mass-dependent trends require feedback processes which are poorly understood.
For the E/S0 population, the question of the relative importance of the environment is still somewhat open. In contrast to field versus cluster trends found in early work (Treu et al. 2002), van Dokkum & van der Marel (2007) found only marginal differences in the inferred ages for massive galaxies as a function of their environment. However, M05, studying E/S0s spanning a wide range of cluster-centric distance within a single cluster, Cl 0024+17 ( = 0.4), found a significant radial trend. This is in the sense of a decreasing ratio with both cluster-centric distance and local density, so that early-types close to the cluster core have older ages, while those at the periphery are younger, and more similar to field galaxies at a similar redshift. A key concern in attempting to reconcile these various results is the mass range explored in the various samples, as it is known that the mass function depends on environment.
Clearly, it is desirable to characterize the past history of bulges and spheroidal galaxies as a function of both mass and environment. Recognizing this, we extend the scope of our earlier work (Mac08) and present here a comparative field versus cluster FP analysis in two redshift bins defined by the clusters Cl 0024+17 ( = 0.4) and MS 045103 ( = 0.54). FP parameters are derived from Keck/DEIMOS spectroscopy to measure velocity dispersions and imaging for photometric parameters, supplemented with ground based CFHT and SUBARU imaging. For all distance- dependent quantities we adopt a flat cosmological model with = 0.3, = 0.7, and H = 65 km s-1 Mpc-1. All magnitudes are in the AB system (Oke 1974).
2. Data
Imaging data for the field samples is largely taken from the GOODS survey (Giavalisco et al. 2004) which provides deep imaging in four ACS passbands. The broad wavelength coverage permits the derivation of accurate -corrections for the selected galaxies, which all have measured spectroscopic redshifts from the Keck Team Redshift Survey (Wirth et al. 2004). Additional field galaxies were included from the sample of spectroscopically-confirmed non-members located within the two cluster fields (see Moran et al. 2007a).
Imaging data for the cluster samples is available from previous campaigns described fully in Moran et al. (2007b; hereafter M07b). Both clusters were observed in the F814W filter with WFPC2 (for Cl 0024+17) and ACS (for MS 0451-03). Galaxies were selected from the comprehensive spectroscopic survey described by M07b. Accurate -corrections were derived using optical () ground-based imaging from the CFHT and SUBARU telescopes. Due to the inferior resolution of the ground-based data, aperture magnitudes of radius 06 were used for the -corrections. Previous studies have shown (Ellis et al. 2001; Mac08) that disk contamination is minimal within such an aperture.
Both field and cluster galaxies were selected morphologically via visual inspection to a limit of 21.5. Details of the classification and its reliability are presented in Treu et al. (2003) and Bundy et al. (2005) for the cluster and field samples, respectively.
The Keck spectroscopic data arises from a number of independent campaigns. The bulk of the velocity dispersions in the cluster fields derives from a 21.5 sample discussed by M05/M07b. This sample was augmented via an additional observing run in November 2007 dedicated to increasing the cluster samples for this purpose. Here, we selected further cluster galaxies with 21.5 and a bulge/total () fraction 0.2 determined from decompositions of the imaging. The opportunity also enabled us to also enlarge the observed sample in the GOODS-S field with respect with the GOODS field samples presented in Mac08. Typical exposure times on this latest run were 5–6 hrs with seeing conditions in the range 0.6–1.1″.
To facilitate the desired comparison between field and cluster, we defined the GOODS-N/S field samples to be those in the above compilation within the redshift ranges 0.3 0.5 (for comparison with the Cl0024+17 sample) and 0.5 0.7 (for comparison with the MS0451-03 sample). Nine field galaxies were accepted from the clustered fields lying within these relevant boundaries and 4 outside the cluster redshift distribution.
The resulting sample comprises 240 spheroids (133 cluster, 107 field) of which 175 (94 cluster, 81 field) represent bulges in two-component galaxies and 65 (39 cluster, 26 field) represent single-component spheroidal galaxies.
3. Analysis
The derivation of FP parameters from the spectroscopic and photometric data discussed above closely followed the procedures discussed in detail in Mac08 to which the reader is referred. Briefly, size and surface brightness parameters were determined from one-dimensional profiles (see MacArthur, Courteau, & Holtzman 2003 for details) following decomposition of the images into Sérsic bulge and exponential disk components. For pure elliptical galaxies, only a single Sérsic profile was fit. Stellar velocity dispersions were measured from the Keck/DEIMOS spectra using the Gauss-Hermite Pixel Fitting algorithm (van der Marel 1994). By limiting the sample to systems with 0.2, contamination from the disk to the central velocity dispersion measurement is insignificant (Mac08).
While all spectroscopic data sets were obtained with Keck/DEIMOS, there were a few differences in the observational set-up and measurement procedures across the various cluster sub-samples which could affect the field-cluster comparison. These differences reflect the fact that the present bulge comparison was not envisaged when the M05/M07b cluster study was planned (and do not apply to the field samples of Mac08). Two differences are worth considering.
Firstly, the bulk of the early cluster galaxy spectra were taken over restframe 3500–6700 Å with a 600 l/mm grating suitable for E/S0 galaxies, whereas the November 2007 data sampled restframe 3600–5400 Å with a 1200 l/mm grating appropriate for less massive systems. In probing a mixed stellar population, a redder wavelength range might be more sensitive to older stars.
A second difference arises in the extraction of the spectra. All data sets were reduced using the DEEP2 pipeline (Davis et al. 2003) which extracts both a 1-D optimally weighted spectrum, as well as a 2-D spectrum. The M05/M07b analyses used the 1-D spectrum to derive dispersions whereas, for the bulges, only the central bin was used with no co-addition of pixels. The latter data thus have a fixed effective aperture of 035, while the Moran et al. data have a larger, and slightly variable aperture depending on how many pixels were coadded for the 1-D spectrum. Conceivably these aperture differences could lead to subtle biases in our desired comparison.
Fortunately, repeat observations of a number of galaxies between the two samples allows us to constrain this possible bias. For Cl 0024+17, after correcting to a common effective aperture of radius , there is no significant average offset for the 19 galaxies common to both data sets 0.01 0.02 dex. However, for MS 0451-03, after aperture correction, a difference of 0.08 0.02 dex towards larger dispersions for the Moran et al. measurements was found. Although still only a small effect compared to the final differences that we measure between cluster and field, to verify the source of this offset we reanalyzed the Moran et al. data using exactly the technique adopted for the new data. We found that the small offset can, in fact, be attributed to the different wavelength range. In the re-analysis of the Moran et al. data the red end was masked during the fit, producing consistent results. We conclude that the effect is due to the presence of composite stellar populations and can be mitigated by focusing on the same exact wavelength region. Thus, to correct the Moran et al. dispersions in MS 0451-03 to the same scale as the other data, a shift of 0.08 dex was added to them for the current analysis. We stress that this in no way invalidates the earlier discussions of this data which was internally consistent.
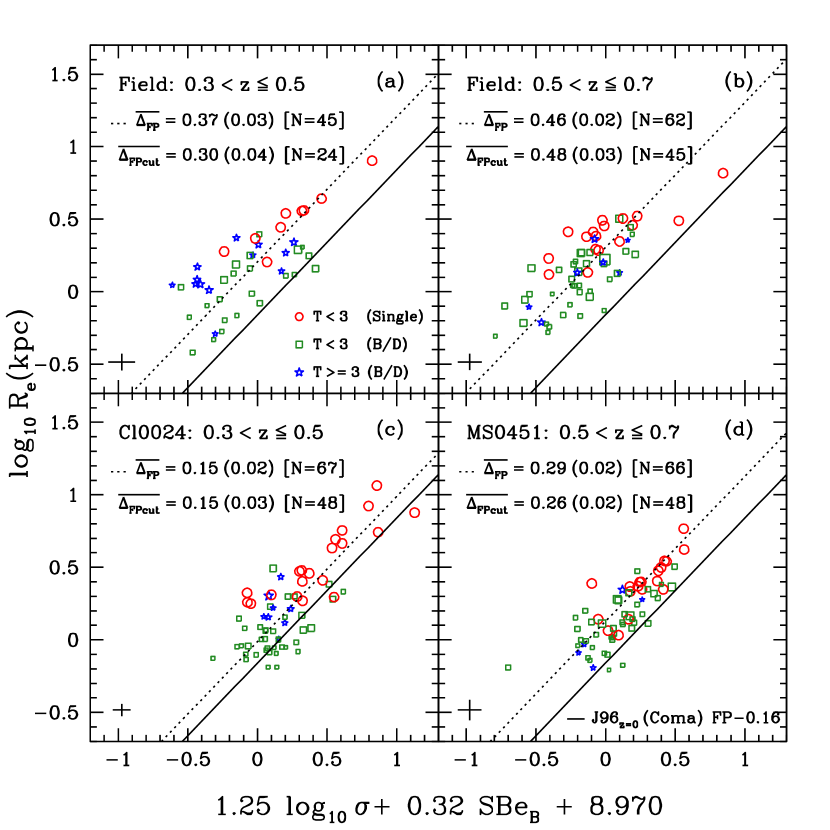
Finally, in order to measure the evolutionary trends, a suitable local reference FP is required. For this we use the relation of Jørgensen, Franx, & Kjaergaard (1996, hereafter J96) for early-type Coma cluster galaxies. This choice does not provide an ideal comparison for the current study as it does not account for structural non-homology or any disk component in their sample galaxies. The effects of this difference were explored in Mac08, revealing an offset (equivalent to 0.16 dex in the local zero point) in the structural parameters from the fixed = 4 single Sérsic fits versus the best-fit Sérsic having also fit a disk component when present. Thus, for a direct comparison with our higher- samples, we adopt the shifted J96 FP as our local zero point.
4. Results
Having established homogeneous data sets of field and cluster spheroids in two redshift bins and a suitable local comparison relation, we make a direct differential comparison of the FP in each bin. In Fig. 1 we plot the FP for our sample separated into two redshift bins for the field (top) and cluster (bottom) samples. The solid line marks the local relation. The comparison of the field versus cluster samples shows a similar difference for the spheroidal FP zero points of 0.22 0.04 dex and 0.17 0.03 dex for the successive redshift bins, in the sense that the cluster spheroidals are systematically fainter at fixed size and velocity dispersion, consistent with older stellar populations.
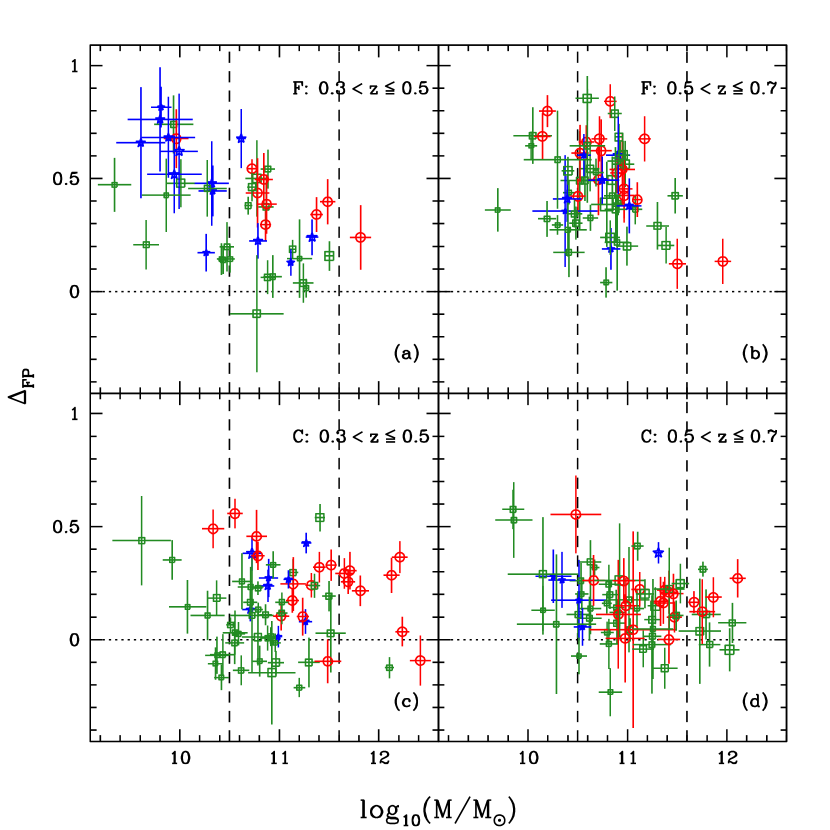
The key bias that could affect the intended analysis is the mass range sampled in each redshift bin. Given our earlier discussion, to isolate environmental effects from those arising as a result of mass-dependent effects (Bundy et al. 2005; Treu et al. 2005; van der Wel et al. 2005; Mac08), it is important to consider carefully the mass range for field and cluster spheroids. We determine the dynamical mass using the relation , where is a profile shape dependent virial coefficient taken from Trujillo et al.(2004). Although such a derived mass is affected by the contribution of the disk and dark matter components, so long as we undertake a differential comparison, we consider this a minor effect.
Fig. 2 shows the dependence of the FP offset derived from Fig. 1 as a function of spheroid mass. Here we see the field samples are indeed more heavily weighted towards lower masses and also show evidence of the downsizing trends discussed, e.g. by Treu et al. (2005). To determine rigorously whether there is an additional environmental trend, we thus recompute the FP offsets restricting both cluster and field samples to lie within the mass interval log() = – (chosen such that both datasets adequately sample the range)111A K-S test confirms the mass distribution is not significantly different for the low- bin, and examination of selection limits as in Fig. 11 in Mac08 confirms no galaxies in the low- bin would have been missed in the high- bin. Additionally, restricting the field bin to as narrow as 0.53 0.56 again does not alter our results.. The new offsets are shown in Fig. 1 as “”. With these refined samples, the new FP zero point shifts become 0.15 0.05 dex and 0.22 0.04 dex for the successive redshift bins. Further restriction on the mass range such that the sampling in the field and cluster bins are matched also does not change the results. In summary, there is a clear environmental effect even when the mass and ranges of the field and cluster spheroid samples are restricted to be the same (i.e. the trend is not driven by selection effects).
5. Discussion
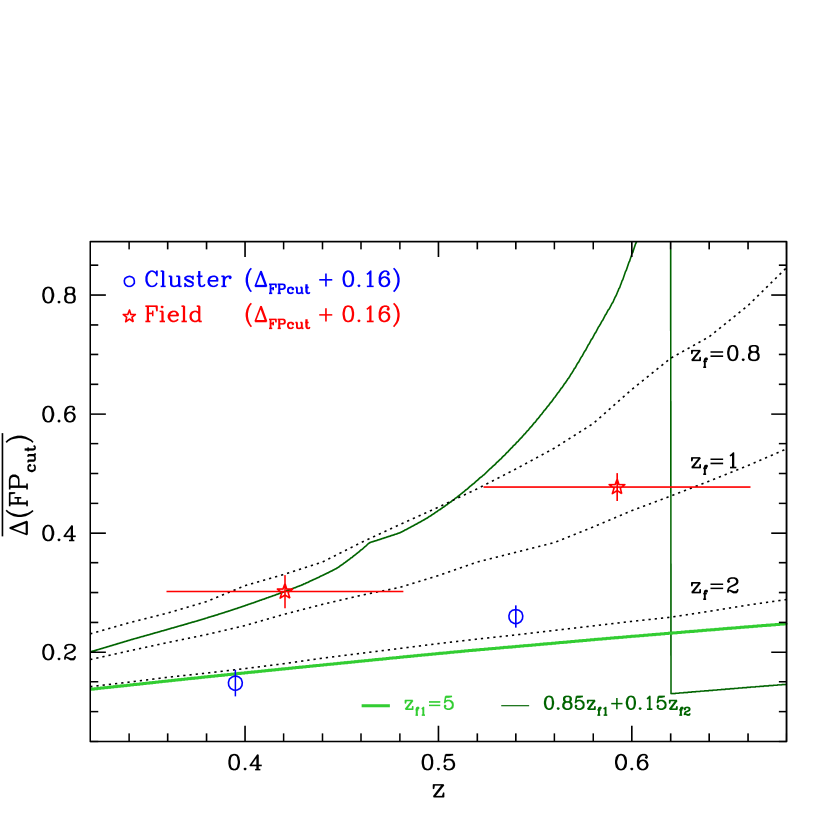
Fig. 3 summarizes the primary result of this paper. We observe a strong environmental signal in both redshift bins for all spheroids with 0.2. This signal is not a manifestation of mass-dependent trends and thus is in addition to the downsizing trends observed before. In terms of star formation history, the observed trends can be interpreted as follows. In the cluster environment, the spheroidal component of galaxies is consistent with having formed very few stars below redshift 2, in agreement with the general trend observed for pure spheroidals of the same mass. In contrast, in the field environment, the evolution of the FP is significantly faster, consistent with a more recent stellar population (a single star formation episode would imply formation redshifts of 0.8). However – as in the case of pure spheroidals (e.g. Treu et al. 2005) – a more likely interpretation of the observed trends is that the majority of the stars are formed at significantly higher redshift, and the integrated stellar populations are then rejuvenated by secondary episodes of star formation below 1. As an illustration, we show the expected evolution for a model where 15% of the stellar mass is formed at = 0.62. The similarity of the star formation histories of galactic bulges and pure spheroids appears difficult to reconcile with the picture whereby the majority of large bulges form primarily via secular processes within spiral galaxies.
In the case of pure spheroidals of high mass, a decisive argument in favor of the secondary bursts model is the relatively slow evolution of their stellar mass function since 1 (Bundy et al. 2005). Unfortunately, no such measurement is currently available for the spheroid and stellar components of galaxies since 1 to break the degeneracy between star formation history and assembly history. The recent growth of the spheroidal component of lenticular galaxies (e.g. Geach et al. 2009) and the observed evolution of the morphology density relation (e.g. Smith et al. 2005) indicate that the pure luminosity evolution is not likely to be an appropriate model for the evolution of the spheroidal component, although at the moment there is not enough information to disentangle the dependency of the demographics of spheroids on mass and environment. A measurement of the evolution of the mass function of bulges and disks as a function of environment is needed to make further progress.
References
- Bamford et al. (2009) Bamford, S. P., et al. 2009, MNRAS, 393, 1324
- Bruzual & Charlot (2003) Bruzual, A. G. & Charlot, S. 2003, MNRAS, 344, 1000 [BC03]
- Bundy et al. (2005) Bundy, K., Ellis, R. S., & Conselice, C. J. 2005, ApJ, 625, 621
- Cooper et al. (2008) Cooper, M. C., et al. 2008, MNRAS, 383, 1058
- Davis et al. (2003) Davis, M., et al. 2003, Proc. SPIE, 4834, 161
- Dressler (1980) Dressler, A. 1980, ApJ, 236, 351
- Ellis et al. (2001) Ellis, R. S., Abraham, R. G., & Dickinson, M. 2001, ApJ, 551, 111
- Hathi et al. (2009) Hathi, N. P., Ferreras, I., Pasquali, A., Malhotra, S., Rhoads, J. E., Pirzkal, N., Windhorst, R. A., & Xu, C. 2009, ApJ, 690, 1866
- Jørgensen et al. (1996) Jørgensen, I., Franx, M., & Kjaergaard, P. 1996, MNRAS, 280, 167 [J96]
- Kauffmann et al. (2004) Kauffmann, G., White, S. D. M., Heckman, T. M., Ménard, B., Brinchmann, J., Charlot, S., Tremonti, C., & Brinkmann, J. 2004, MNRAS, 353, 713
- Lewis et al. (2002) Lewis, I., et al. 2002, MNRAS, 334, 673
- MacArthur et al. (2003) MacArthur, L. A., Courteau, S., & Holtzman, J. A. 2003, ApJ, 582, 689
- MacArthur et al. (2008) MacArthur, L. A., Ellis, R. S., Treu, T., U, V., Bundy, K., & Moran, S. 2008, ApJ, 680, 70 [Mac08]
- Moran et al. (2005) Moran, S. M., Ellis, R. S., Treu, T., Smail, I., Dressler, A., Coil, A. L., & Smith, G. P. 2005, ApJ, 634, 977 [M05]
- Moran et al. (2007a) Moran, S. M., Miller, N., Treu, T., Ellis, R. S., & Smith, G. P. 2007a, ApJ, 659, 1138
- Moran et al. (2007b) Moran, S. M., Ellis, R. S., Treu, T., Smith, G. P., Rich, R. M., & Smail, I. 2007b, ApJ, 671, 1503 [M07b]
- Oke (1974) Oke, J. B. 1974, ApJS, 27, 21
- Smith et al. (2005) Smith, G. P., Treu, T., Ellis, R. S., Moran, S. M., & Dressler, A. 2005, ApJ, 620, 78
- Treu et al. (2003) Treu, T., Ellis, R. S., Kneib, J.-P., Dressler, A., Smail, I., Czoske, O., Oemler, A., & Natarajan, P. 2003, ApJ, 591, 53
- Treu et al. (2002) Treu, T., Stiavelli, M., Casertano, S., Møller, P., & Bertin, G. 2002, ApJ, 564, L13
- Treu et al. (2005) Treu, T., et al. 2005, ApJ, 633, 174
- Trujillo et al. (2004) Trujillo, I., Burkert, A., & Bell, E. F. 2004, ApJ, 600, L39
- van der Marel (1994) van der Marel, R. P. 1994, MNRAS, 270, 271
- van Dokkum & van der Marel (2007) van Dokkum, P. G., & van der Marel, R. P. 2007, ApJ, 655, 30
- Wirth et al. (2004) Wirth, G. D., et al. 2004, AJ, 127, 3121