Accretion-Driven Turbulence and the Transition to Global Instability in Young Galaxy Disks
Abstract
A simple model of gas accretion in young galaxy disks suggests that fast turbulent motions can be driven by accretion energy for a time where is the fraction of the accretion energy going into disk turbulence, and are the galaxy mass and rotation speed, and is the accretion rate. After , accretion is replaced by disk instabilities as a source of turbulence driving, and shortly after that, energetic feedback by young stars should become important. The star formation rate equilibrates at the accretion rate after 1 to 2 , depending on the star formation efficiency per dynamical time. The fast turbulence that is observed in high redshift starburst disks is not likely to be driven by accretion because the initial phase is over by the time the starburst is present. However, the high turbulent speeds that must have been present earlier, when the observed massive clumps first formed, could have been driven by accretion energy. The combined observations of a high relative velocity dispersion in the gas of clumpy galaxies and a gas mass comparable to the stellar mass suggests that either the star formation efficiency is fairly high, perhaps higher than in local galaxies, or the observed turbulence is powered by young stars.
1 Introduction
Deep surveys have detected Milky-Way-size galaxy disks at redshift that contribute a large fraction of the stellar mass density and have star formation rates of order 100 yr-1 (Daddi et al. 2004, 2007; Förster-Schreiber et al. 2006; Erb et al. 2006a,b; van Dokkum et al. 2006). They appear to be highly turbulent with gas velocity dispersions of 40-80 km s-1 (Förster-Schreiber et al. 2006, 2009; Genzel et al. 2006, 2008; Cresci et al. 2009). They form stars in a small number of clumps with masses of around the turbulent Jeans mass, which is (Elmegreen & Elmegreen 2005; Bournaud et al. 2007, 2008). They are also gas-rich, with gas-to-star mass fractions of order 30-60% (Tacconi et al. 2009). These features are in contrast to present-day disk galaxies that are relatively quiescent by comparison, having turbulent velocities of order 10 km s-1 (Dib et al. 2006), star-forming complexes typically smaller than , and star formation rates of order 1-3 yr-1.
The presence of gas does not necessarily imply star formation. Certain conditions have to be met before gas can become unstable to form self-gravitating clouds (e.g., Toomre 1964; Goldreich & Lynden-Bell 1965), and other conditions are required before these clouds can cool enough to condense into stellar objects (e.g., Elmegreen & Parravano 1994; Schaye 2004; Krumholz, McKee, & Tumlinson 2009; Prochaska & Wolfe 2009). These conditions have the effect of delaying the onset of star formation in a young galaxy, allowing the gas mass to build up without attrition until it reaches a tipping point, after which the conditions change and star formation is fast. The observed star-formation rate of yr-1 corresponds to nearly a whole galaxy disk of gas, several , being converted into stars in only a few orbit times, which is several yrs. If the gas accretion rate is comparable to this star formation rate, then the initial build up of a disk is fast and star formation has to be very efficient, with a shorter gas consumption time than in local galaxies by a factor of . If the accretion rate is less than the star formation rate, then there was probably a prior phase when most of the gas assembled before the star formation began.
The properties of galaxy disks during the initial accretion and starburst phase are not understood. The large masses of star-forming clumps suggest that the gas was highly turbulent before the clumps formed. In this case, the primary source of turbulent energy would seem to be the accretion itself (e.g., Elmegreen & Elmegreen 2005; Förster-Schreiber et al. 2006; Genzel et al. 2008; Dekel et al. 2009; Khochfar & Silk 2009; Klessen & Hennebelle 2009). After the disk becomes unstable, further energy can come from disk self-gravity (Burkert et al. 2009; Bournaud et al. 2009). Here we investigate the duration of the initial turbulent phase when most of the energy comes from cosmological accretion, and we consider the cooling that leads to instabilities and star formation. We write equations for energy, mass, and star formation in dimensionless form, and then normalize these equations in a way that is independent of the gas accretion rate and the efficiency of conversion from galaxy potential energy to disk turbulent energy. The equations are in Section 2, the solutions are in Section 3, and a comparison with observations is in Section 4.
2 An Accretion-Dissipation Equation
We simplify a galaxy during the short phase of initial accretion by considering a constant gas accretion rate into a disk with fixed radius within a fixed potential . The energy accretion rate is approximately multiplied by the depth of the potential well, , assuming the thermal speed in the accretion flow is small compared with . We let be the efficiency of conversion of accretion energy into turbulent energy, , in the disk. If , then some of the potential energy from accretion is lost to shocks and thermal radiation before it drives disk turbulence. The rate of input of turbulent energy is . If dark matter accretes along with the gas, then will increase with time. This is considered in Section 4.
An accreting disk dissipates turbulent energy at a rate approximately equal to the current energy divided by the perpendicular crossing time (e.g., Mac Low et al. 1998; Stone, Ostriker & Gammie 1998). This crossing time is for disk scale height . The turbulent speed is denoted by and the accreted disk mass is . Thus the dissipation rate is . Putting accretion and dissipation together, the time-dependent equation for turbulent energy is
| (1) |
The last term is the energy lost by locking up interstellar matter with velocity dispersion into stars at a rate . This counts for energy lost from the gas phase; i.e., the total gas energy decreases from this effect at a rate equal to the rate of conversion of gas into stars multiplied by the energy content of that gas.
Star formation converts disk gas into stars. We take the disk gas mass to be and the disk star mass to be , so that . No gas or stars are assumed to be ejected from the disk. The star formation rate is taken to be times the gas mass multiplied by the growth rate of a gravitational instability, which is in the linear instability theory. The coefficient is an efficiency of star formation in a dynamical time; it is observed to be on a variety of scales (Kennicutt 1998; Krumholtz & Tan 2007) reflecting the small fraction of cloud mass that is dense enough to form stars and the rapid disruption of star-forming cores. The total star formation rate in the galaxy is then
| (2) |
Note that accretion followed by disk shrinkage at constant causes the gas surface density to increase and the radius in this equation to decrease. Shrinkage is expected if gravitational instabilities drive turbulence, because then turbulent energy is taken from gravitational binding energy, and the dissipation of this energy requires settling of the gas to a smaller radius. In the following discussions, the length scales will be normalized to the galaxy radius . Then disk shrinkage should be viewed as a larger effective value of , according to equation (2).
Because of star formation, the gas mass in the disk varies with time as
| (3) |
and the star mass varies as
| (4) |
.
We now normalize the important physical parameters, writing time in units of , gas or disk mass in units of galaxy mass, , and energy in units of . Geometric terms of order unity are ignored, as are variations throughout the disk. There are two parameters in this model, and . We can absorb them into our new variables to write the equations independent of them. Then we get general solutions to the equations that are independent of all parameters. The gas accretion rate is dimensional, so we introduce the dimensionless accretion rate, , and define:
We also define the useful quantities
Here is the Toomre instability parameter for epicyclic frequency in a flat rotation curve and mass column density . The unstable Jeans mass is . The growth rate was given above. All primed quantities are independent of and . Note also that .
Equations (5)-(9) were solved numerically. The initial conditions are , , and . The solution is initially dominated by the first terms in equations (5) and (8) so that at first, giving before dissipation becomes important. In this regime, disk turbulence is fast and driven only by gas accretion.
Physical quantities can be determined from the normalized variables if we specify the corresponding galactic environment. Typical high-redshift star-forming galaxies are characterized by 10 kpc and 220 km s-1, which give and Myr. If their accretion rates are 50% of the mass in one orbit time, Myr, then yr-1 and . The efficiency of conversion of infall energy into disk turbulent energy is not well known. Klessen & Hennebelle (2009) suggest is a few percent to 10%. If we adopt , then Myrs, , erg, and km s-1.
3 Results
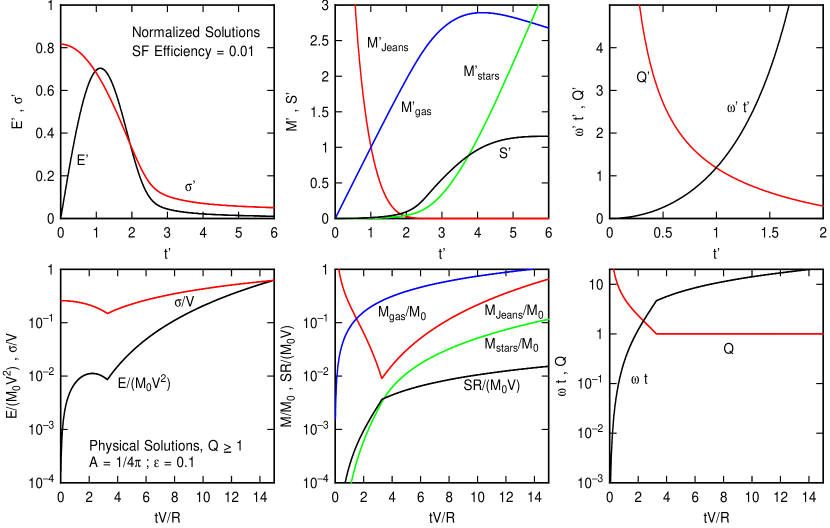
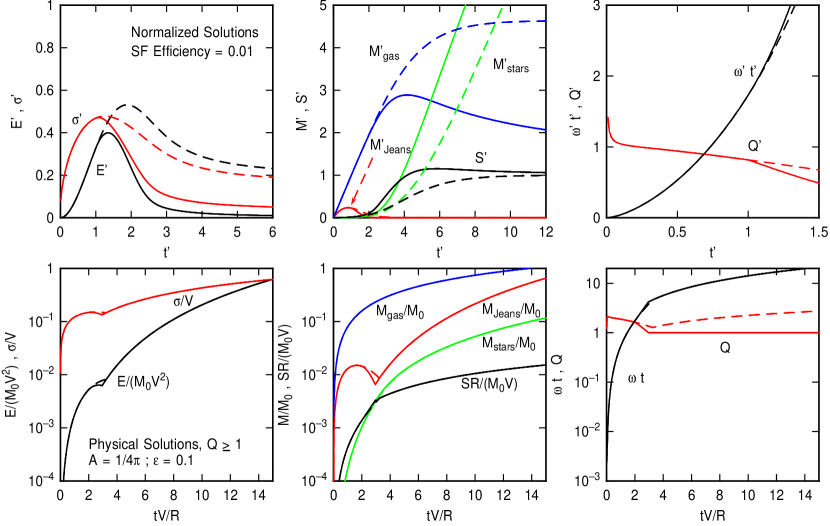
The top panels of Figure 1 show solutions to the normalized equations as functions of normalized time for star formation efficiency . The turbulent energy in the disk increases linearly with time at first and then decreases when the dissipation rate becomes larger than the energy accretion rate at about . The normalized velocity dispersion in the disk starts at a value of unity and decreases when dissipation becomes important. The epoch of significant accretion-driven turbulence is .
The unstable mass in a turbulent disk is the Jeans mass, , which in dimensionless units is written above. The ratio of the Jeans mass to the gas mass is
| (10) |
Initially and no gravitational instabilities are possible. When , instabilities can begin; i.e., each half of the disk can clump into a separate cloud. This condition corresponds to . For and as above, this becomes . In Figure 1, this occurs at 0.94 or Myr with these and .
The time evolution of the normalized instability parameter is shown on the top right in Figure 1. It starts high and decreases as decreases and increases. If significant instabilities occur when , then this corresponds to . With and , this requires , and it occurs in Figure 1 at , or Myr.
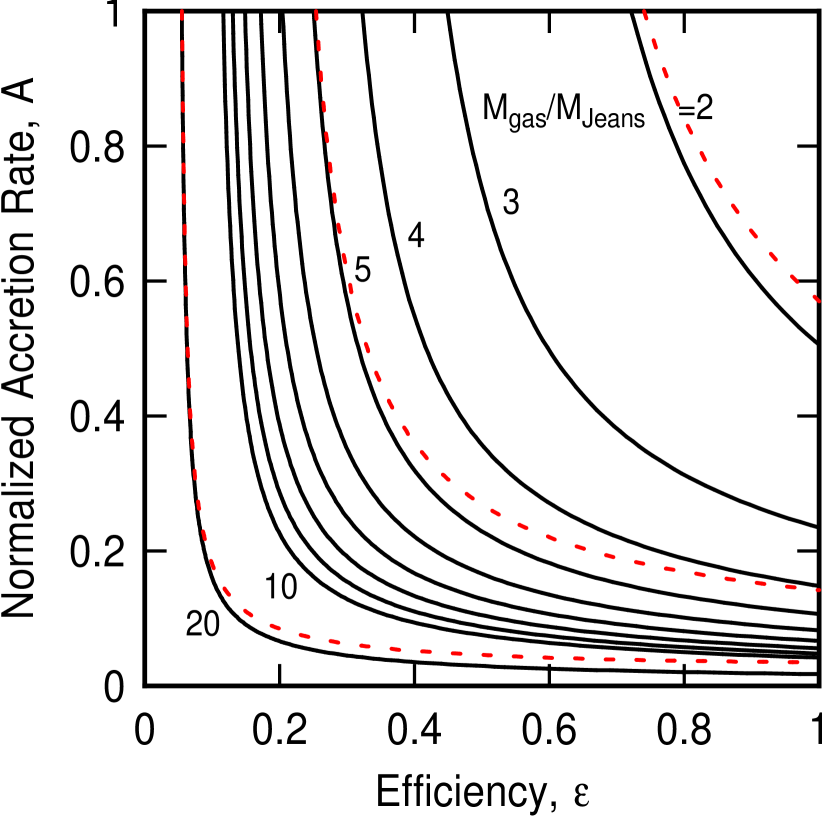
The number of giant clouds that form from the instability equals about . Note that exceeds the minimum likely value, , when the disk is still stable, i.e. when , for these and . Thus as soon as the disk becomes unstable, , there is enough mass in it to form clouds. The condition for instability is therefore the Toomre condition, rather than the Jeans minimum-mass condition, . For most and , this is the case. Figure 2 shows with the top right curve the values of versus for which and occur at the same time. A star formation efficiency is assumed. Values of and below and to the left of this curve have when the disk is still stable. Thus all of this lower-left region in space begins star formation because of the Toomre condition, rather than the Jeans condition. Above and to the right of the curve, the Jeans condition determines the onset of star formation. The other black curves in Figure 2 correspond to values of when the first point of instability occurs, at , also for . Loosely interpreted, these curves give the number of giant clouds that form in the disk. The red dashed curves are for a higher efficiency, , which does not change the values much.
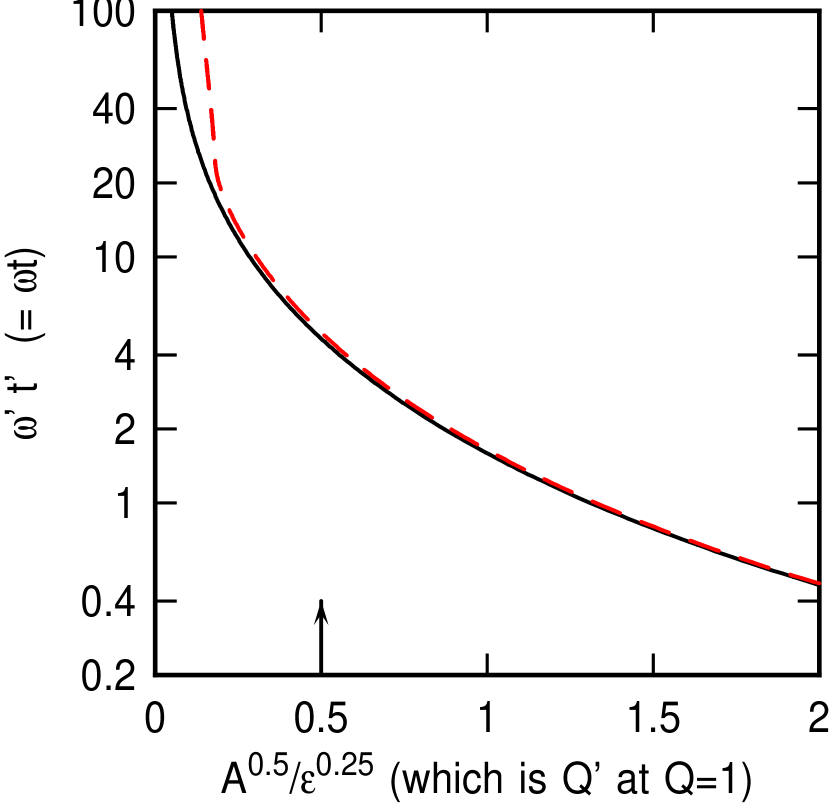
The top right panel of Figure 1 shows the product of the time and the instability growth rate. The product increases and exceeds 1 when . It is generally large by the time . Note that , independent of and , so that when , the unstable growth occurs quickly compared to the age of the galaxy. Such quick growth is generally applicable in our models. The value of at the onset of instability () is shown in Figure 3. The solid black curve uses and the dashed red curve uses . Both assume decreases continuously with turbulent dissipation, i.e., without a floor. What is plotted is versus , which is the value of at ; this is a normalized curve, independent of and . For in the case, at the onset of instabilities. For fiducial and , and , as indicated in the figure by the arrow. The rapid turnup in the case is because levels off faster at late times than in the case as a result of the decrease in that follows from the higher star formation rate with .
The top center panel in Figure 1 shows that the normalized star formation rate approximately equals the gas accretion rate ( for our normalized quantities) after the time , at which point the ratio of the turbulent dispersion speed to the orbit speed has decreased to in this case. Star formation increases so rapidly after that the stellar disk mass soon exceeds the gas mass, which happens at in Figure 1. Then the disk enters a near-steady state with a powerful starburst lasting as long as the high accretion continues. Disk self-gravity should contribute to the turbulent energy after , when disk instabilities become active, and star formation should contribute to the turbulent energy after , when the starburst begins.
A problem with these solutions is that becomes small before the starburst begins and before . Observations suggest the opposite, that is a large fraction of the rotation speed in bursting galaxies with . This problem occurs for pure accretion-driven turbulence, which always dies out after . In a real galaxy, gravitational instabilities and star formation drive turbulence and prevent from dropping much lower than 1 (Burkert et al. 2009; Bournaud et al. 2009; Dekel, Sari, & Cervino 2009). We simulate this here by allowing to decrease as decreases and increases, but when , we stop the decrease in and set , which keeps . This means that decreases at first because of the dissipation of accretion energy, but then it increases in direct proportion to the gas mass in order to keep .
The bottom panels of Figure 1 show the same variables again as in the top panel, but now with this constraint, and also plotted with explicit evaluation of the and dependencies, so that the variables are physical with normalization to , , and R. The curve for shows the effect just discussed: the dispersion decreases at first and then increases once reaches 1 in order to keep , as indicated in the right panel where itself is plotted. The energy decreases at first, from dissipation, but then increases from the assumed gravitational instabilities. While this situation is closer to reality than an ever-cooling disk, the high that results keeps the star formation rate low. Then the stellar mass builds up very slowly and is always much less than the gas mass over the timespan plotted. Note that in the figure barely gets above , whereas the accretion rate in these same units, is . Thus the star formation rate has not yet equilibrated to the accretion rate in this time. Evidently, forcing makes more reasonable for high redshift disks, but then star formation is too slow and the stellar mass does not readily build up to equal the gas mass.
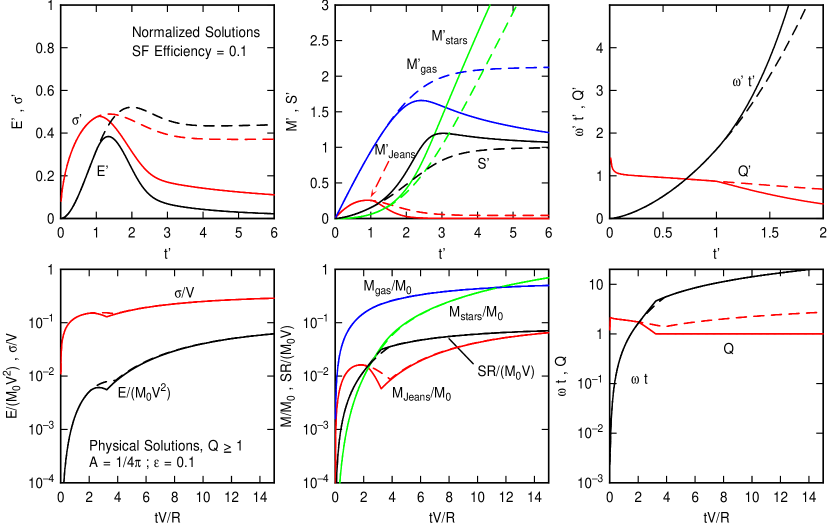
To fix this second problem, we have to increase the efficiency of star formation, . Figure 4 shows the same normalized variables in the top panel as in Figure 1, again without restrictions, and the same physical variables in the bottom panel as in Figure 1, again with , but this time is 10 times larger, . Now the star formation rate gets large quickly, by , it saturates to the gas accretion rate even in the high- case (bottom panels), and the stellar mass becomes equal to the gas mass within the plotted physical time range, at .
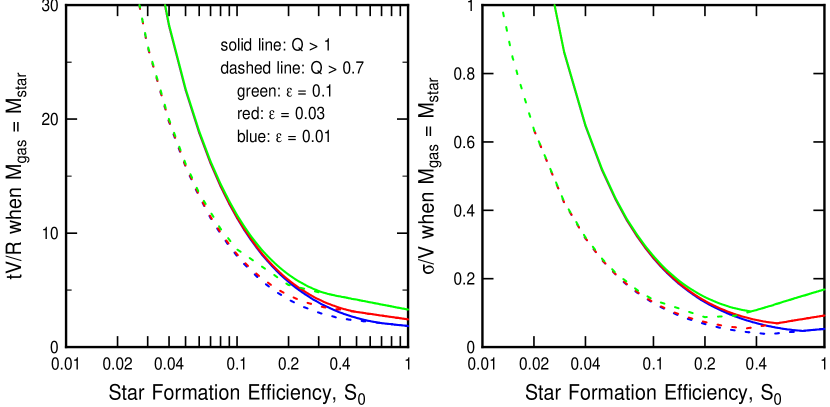
The time when depends on the star formation efficiency. The interesting case is when has a floor value, so we consider that now. Figure 5 shows the physical time, , when , versus the star formation efficiency, , on the left and the ratio at this time versus on the right. The solid curves are for a floor value of and the dotted curves are for a floor value of (beyond which increases proportional to , as discussed above). The different colors are for different turbulence-driving efficiencies, . Both and decrease with higher , and they diverge for low . The divergence at low is because the star formation rate per unit gas mass is so slow with at its floor value that the accretion keeps the gas mass larger than the stellar mass, and our condition for this figure cannot be satisfied. Also at low , when the time for is large, the total gas mass becomes large for the fixed accretion rate and also has to be large to keep constant. There is a sharp turnaround in for (depending on ) with the curves. In this region, the star formation efficiency is so high and so early, that the turbulence is still from gas accretion and has not reached its floor value of unity yet. Increasing beyond 0.4 increases because the time gets shorter in the accretion-dominated turbulent regime. These curves blend smoothly with the curves at (depending on ) because the floor is not reached in either case for large and then the floor does not matter.
4 Time-increasing Potential
The basic equations are modified slightly if the galaxy potential builds up with time along with the gas. If we suppose that the potential is instead of for constant , then equation 5 becomes
| (11) |
where
| (12) |
is the same factor that normalizes compared to (). All of the other equations are the same because they do not involve the potential directly, except for , which becomes
| (13) |
because the square root of the potential appears in the epicyclic frequency, .
Two solutions of these and the other equations given above are shown in Figure 6, which should be compared with Figure 1. One solution, with the solid curves, is for a growth of the potential until , at which point the galaxy mass is the same as in Figure 1, and then after this the galaxy mass remains constant (i.e., the former equations are used again). The second, shown by dashed curves in Figure 6, is for a continuous growth up to arbitrarily large galaxy mass, which uses these new equations for all . The first case is a lot like the previous solution except for , where now the velocity dispersion, , starts at zero instead of . As a result, the Jeans mass is very small throughout this solution and the instability parameter also starts small. The other changes are minor, especially for the bottom row of both figures, which assumes has a minimum value of 1 and plots unprimed quantities with and .
In the second case (dashed lines) where the potential continues to grow, the normalized velocity dispersion stays large for a long time (see top left panel of Fig. 6). The rotation speed is large too at these late times, higher than before by the factor . The increase in causes the star formation rate to increase more slowly than for a constant potential, and the gas mass then gets higher before it equals the stellar mass. The other changes are minor for this second case.
The changes to Figure 4 for a time-changing potential (not shown) are qualitatively the same as the changes to Figure 1 that are shown in Figure 6. The velocity dispersion and start low and the Jeans mass is low throughout. The cases when has a minimum value of 1 are hardly changed at all.
Figure 5, which showed the time and relative velocity dispersion when in the case, is also hardly changed when the potential increases with time. This is characteristic for . However, the ratio of to the full rotation speed is now instead of . This change can be significant, as seen in Figure 7. The left-hand panel is for an increasing potential up to and then a constant . The right hand panel is for a continuously increasing potential, with no limit. The curves in the left panel are almost the same as in Figure 5 because the time when is larger than and then the galaxy mass is the same as before. Recall that , so for and . This means that the time plotted in the left hand panel of Figure 5 should be multiplied by 0.5 to convert to . The curves in the right panel have lower values of because the mass is larger at larger times, and so the rotation speed is larger, when is small. The implication of this change is that observed ratios of dispersion to rotation speed for galaxies with permit smaller star formation efficiencies if the galaxy mass continuously increases during gas accretion. The primary reason is that relative dispersions of several tenths can occur later in galaxies with if the galaxy mass is larger.
5 Comparison with Observations
High redshift galaxies are not yet observed at the phase that is most relevant to this paper, namely, when turbulence is still driven by gas accretion and star formation has not yet begun. Selection effects limit the observation of galaxies to the starburst phase, at which point a significant amount of turbulence should be driven by the dynamics that triggers the star formation, most likely gravitational instabilities, and also by the young stars themselves. Thus the fast turbulence observed in young galaxies so far is probably not from accretion energy, but from gravitational instabilities and young stars. However, the turbulence that was present before the giant star-forming clumps form, which caused the disk Jeans mass to be so large and gave these clumps their enormous masses, could have been accretion energy. We predict that observations of extremely young, gas-dominated disks will show high turbulent speeds even before star formation begins.
In the simple model presented here, accretion energy causes the turbulent motions during the first few rotation times for a steady, high accretion rate. In general terms, this phase lasts for considering that at this time (from Figs. 1 and 4). Writing , the duration becomes for accretion rate in physical units. Thus the accretion-driven turbulence phase lasts longer for higher efficiency and lower accretion rate, and for more massive or larger galaxies at a given rotation speed. For the typical parameter values discussed elsewhere, Myr.
The normalized time when the disk becomes gravitationally unstable, i.e., , which means for and , is found to be ( in Fig. 1 with and in Fig. 4 with ). These are for the cases with no floor in . The normalized gas mass at this time is , (1.62 for and 1.53 for ) which means the physical gas mass is for this normalization. This is the gas mass at the beginning of the starburst phase. By the time the gas and stellar masses are equal, which is appropriate for the current gas observations (e.g., Tacconi et al. 2009), to 5 (5.5 for and 3.12 for ) and to 1.6, respectively, making to . With a floor and (bottom panel of Fig. 4), when , and then .
These gas masses are appropriate for the start of the star formation phase, between the time of first instabilities and the time when the stellar mass has built up to be comparable to the gaseous mass. The masses are large in our model because the young disk is stabilized by turbulence that is driven by accretion energy. This energy source explains how the gas mass can build up to such large values without first turning into stars. The youngest disks require stability like this or else the gas-to-star ratio will always be low. We obtain the observed high ratio and the observed gas masses for reasonable values of the accretion rate and efficiency of turbulence driving. We also obtain the high Jeans masses of the first star-forming events, which is also an indication of fast turbulence.
Our conclusion that accretion dominates turbulence only during the very earliest phase of galaxy growth may be derived most simply from the dimensionless equations in Section 2. From equation 5, we see that energy gains exceed energy dissipation when . From equation 7, . Also at early times, there are not many stars and equation 8 gives . Similarly, from the first term in equation 5, . From all of these we derive when turbulence is driven by accretion. This translates to a physical time , or, after substituting , we get , as derived above.
Dekel, Sari & Ceverino (2009) consider disk turbulence driven by accretion, disk instabilities, disk clump stirring, and star formation. For the accretion-dominant phase, they derive a timescale in their equation 40, which is . This is essentially the same as we get because we both assume equality between the turbulent energy and the accretion energy in this phase. The simple derivation in the previous paragraph eliminates in favor of global galactic quantities because is what we wish to determine. Most of the discussion in Dekel et al. is about disk self-regulation, which is more simply treated in the present paper by assuming the instability parameter has a minimum value of order unity. Self-regulation occurs at a later phase, , when accretion is not strong enough to drive turbulence in comparison to internal disk processes and star formation. Observations so far see primarily this late phase. Lehnert et al (2009) comment on accretion-driven turbulence after observing spectra of redshift galaxies. They note that the observed turbulence is too dissipative to be driven by a reasonable accretion rate and conclude that star formation dominates instead. Our model agrees with their assessment, as the starburst phase occurs much later than the accretion-driven turbulence phase, at (Fig. 1).
Klessen & Hennebelle (2009) suggest that turbulent accretion can power turbulence in a wide variety of conditions, including the outer parts of modern galaxies where the star formation rate is low. For high redshift galaxies, they conclude that the observed turbulence inside individual clumps can be driven by clump gas accretion if the total rate is yr-1. They consider this reasonable as it is comparable to the observed star formation rate. However, they also caution that their model might not apply to the whole disk of a clumpy high redshift galaxy, as clump coalescence and minor mergers might dominate accretion and star formation in that phase.
6 Conclusions
Gas accretion to a young galaxy disk can drive turbulence for a time where is the fraction of the accretion energy going into disk turbulence and is the accretion rate. After this time, disk turbulence should be driven by gravitational instabilities and star formation. The first instabilities should produce only a few giant gas clumps that dominate early star formation until the relative gas fraction in the disk decreases. The star formation rate equilibrates to the accretion rate in 1 or 2 , depending on the star formation efficiency ().
Observations of a relative high turbulent speed compared to the rotation speed, and of a disk gas mass comparable to the disk stellar mass, require that the galaxy-averaged star formation efficiency has to be large compared to the modern galaxy-averaged star formation efficiency. This efficiency is defined here as the star formation rate per unit dynamical time in the disk, and per unit total galaxy area. Thus a high average value means either that the local efficiency is high and the gas area equals the galaxy area, or the local efficiency is more normal and the gas area is smaller than the galaxy area. Our one-zone model cannot distinguish between these possibilities. The high efficiency causes the stellar mass to build up to the gas mass before the velocity dispersion in a gas disk has dropped below a few tenths of the rotation speed. This criterion is easier to satisfy if the total galaxy mass increases with the gas mass (Fig. 7).
The high rate of star formation in young galaxy disks is the result of a rapid instability compared to the galaxy age and a high gas mass compared to the galaxy mass. The rapid instability follows from our simple model (Fig. 3). The instability growth rate, , compared to the rotation rate, , is . This is large because the relative gas mass, , is large for young disks, even though the relative velocity dispersion, is somewhat large too. As drops because of turbulent dissipation, and the accretion continues, becomes even larger. The star formation rate declines only when the accretion rate declines.
We conclude that gas accretion is a good source of energy for ISM turbulence in the earliest phases of galaxy growth. It is quickly replaced by other sources after a few rotation times, and is not likely to be the source of turbulence that is observed at high redshift in starbursting systems. Accretion-driven turbulence in a young disk is important because it provides the initial stability that allows the gas to build up to a large mass before star formation begins. It also gives the observed large masses for star-forming clumps. Observations of gas-rich disks before the starburst phase should show the predicted high turbulent speeds that come from accretion.
We are grateful to the referee for helpful suggestions.
References
- (1) Bournaud, F., Elmegreen, B.G. & Elmegreen, D.M. 2007, ApJ, 670, 237
- (2) Bournaud, F. et al. 2008, A&A, 486, 741
- (3) Bournaud, F. et al. 2009, in preparation for ApJ
- (4) Burkert, A. etal. 2009, submitted to ApJ, astro-ph/0907.4777
- (5) Cresci, G. et al. 2009, ApJ, in press.
- (6) Daddi, E., Cimatti, A., Renzini, A., Fontana, A., Mignoli, M., Pozetti, L., Toi, P. & Zamorani, G. 2004, ApJ, 617, 746
- (7) Daddi, E. et al. 2007, ApJ, 670, 156
- (8) Dekel, A. et al. 2009, Nature, 457, 451
- (9) Dekel, A., Sari, R., & Ceverino, D. 2009, ApJ, 703, 785
- (10) Dib, S., Bell, E. & Burkert, A. 2006, ApJ, 638, 797
- (11) Elmegreen, B.G., & Parravano, A. 1994, ApJ, 435, L121
- (12) Elmegreen, D.M. & Elmegreen, B.G. 2005, ApJ, 627, 632
- (13) Erb, D. K., Steidel, C. C., Shapley, A. E., Pettini, M., Reddy, N. A. & Adelberger, K. L. 2006a ApJ, 646,107
- (14) Erb, D. K., Steidel, C. C., Shapley, A. E., Pettini, M., Reddy, N. A. & Adelberger, K. L. 2006b, ApJ, 647,128
- (15) Förster Schreiber, N. M. et al. 2006, ApJ, 645, 1062
- (16) Förster Schreiber, N.M. et al. 2009, 2009arXiv0903.1872
- (17) Genzel, R. et al. 2006, Nature, 442, 786
- (18) Genzel, R. et al. 2008, ApJ, 687, 59
- (19) Goldreich, P. & Lynden Bell, D. 1965, MNRAS, 130 97
- (20) Kennicutt, R.C. 1998, ApJ, 498, 541
- (21) Khochfar, S. & Silk, J. 2009, MNRAS, 397, 506
- (22) Klessen, R., & Hennebelle, P. 2009, astroph/0912.0288
- (23) Krumholz, M.R. & Tan, J.C. 2007, ApJ, 654, 304
- (24) Krumholz, M.R., McKee, C.F., & Tumlinson, J. 2009, ApJ, 699, 850
- (25) Lehnert, M.D., Nesvadba, N.P.H., Le Tiran, L. Di Matteo, P., van Driel, W., Douglas, L.S., Chemin, L., & Bournaud, F. 2009, ApJ, 699, 1660
- (26) Mac Low, M.-M., Klessen, R.S., Burkert, A., & Smith, M.D. 1998. Phys. Rev. Lett., 80, 2754
- (27) Prochaska, J.X., & Wolfe, A.M. 2009, ApJ, 696, 1543
- (28) Schaye, J. 2004, ApJ, 609, 667
- (29) Stone, J.M., Ostriker, E.C., & Gammie, C.F. 1998. ApJ, 508 L99
- (30) Tacconi, L. et al. 2009, in preparation
- (31) Toomre, A. 1964, ApJ 139, 1217
- (32) van Dokkum, P.G. et al. 2006, ApJ, 638, L59