Importance of conduction electron correlation in a Kondo lattice, Ce2CoSi3
Abstract
Kondo systems are usually described by the interaction of strong correlation induced local moment with the highly itinerant conduction electrons. Here, we study the role of electron correlations among conduction electrons in the electronic structure of a Kondo lattice compound, Ce2CoSi3, using high resolution photoemission spectroscopy and ab initio band structure calculations, where Co 3 electrons contribute in the conduction band. High energy resolution employed in the measurements helped to reveal signature of Ce 4 states derived Kondo resonance feature at the Fermi level and dominance of Co 3 contributions at higher binding energies in the conduction band. The line shape of the experimental Co 3 band is found to be significantly different from that obtained from the band structure calculations within the local density approximations, LDA. Consideration of electron-electron Coulomb repulsion, among Co 3 electrons within the LDA+ method leads to a better representation of experimental results. Signature of electron correlation induced satellite feature is also observed in the Co 2 core level spectrum. These results clearly demonstrate the importance of the electron correlation among conduction electrons in deriving the microscopic description of such Kondo systems.
pacs:
75.20.Hr, 71.27.+a, 71.28.+d, 71.15.Mb1 Introduction
Study of Ce-intermetallics have drawn significant attention during past few decades due to the observation of many unusual properties such as valence fluctuations, Kondo screening, heavy fermion superconductivity in these systems. Such properties arise due to the proximity of Ce 4 level to the Fermi level leading to strong hybridization between the Ce 4 states and the conduction electronic states [1]. Such hybridization often leads to a logarithmic enhancement of electrical resistivity at low temperatures in contrast to a decrease expected in a metal. This is known as Kondo effect. In the case of strong Kondo coupling, the antiparallel coupling of the Ce moment with the conduction electrons forms a singlet ground state called Kondo singlet that manifests as a sharp feature (Kondo resonance feature) in the electronic structure in the vicinity of the Fermi level, . A lot of success has been achieved to describe these systems within the Anderson impurity models. Here, the parameters defining the hybridization between 4 states and valence electronic states are often estimated using band structure calculations based on local density approximations (LDA)[2, 3, 4, 5].
The scenario can be different if these materials contain transition metals: the electrons forming the conduction band are strongly correlated. The finite correlation strength among them suggests non-applicability of the band structure results within LDA to derive the hybridization parameters and indicate the need to go beyond LDA prescriptions. A Kondo lattice compound, Ce2CoSi3 is a good candidate for this study. Ce2CoSi3 crystallizes in a AlB2 derived hexagonal structure (space group ) and is a mixed valent (Kondo lattice) compound [6, 7, 8]. The electrical transport measurements revealed temperature dependence[8] typical of a mixed valent system [9]. No signature of magnetic ordering was observed in the magnetic susceptibility measurements down to 0.5 K [8]. Interestingly, gradual substitution of Rh at Co sites leads to plethora of interesting features due to increasing dominance of indirect exchange interaction [8]. For example, = 0.6 composition in Ce2Rh1-xCoxSi3 exhibits quantum critical behavior. Intermediate compositions having higher Rh concentration exhibit signature of spin density wave (SDW) state [8]. Clearly, the electronic states corresponding to the transition metals plays a key role in determining the electronic properties in this interesting class of compounds. It is thus, important to probe the role of electron correlation in the electronic structure of these compounds.
In this paper, we report our results of investigation of the electronic structure of Ce2CoSi3 using high resolution photoemission spectroscopy and ab initio band structure calculations. High energy resolution employed in our measurements enabled us to reveal Kondo-resonance feature and the corresponding spin orbit satellite. The comparison of the experimental spectra and the calculated ones indicate that the correlation strength among Co 3 electrons is significant ( 3 eV). The contribution of the Co 3 partial density of states (PDOS) is small in the vicinity of the Fermi level, where Ce 4 contributions are dominant.
2 Experimental details
Ce2CoSi3 was prepared by melting together stoichiometric amounts of high purity ( 99.9%) Ce, Co and Si in an arc furnace. The single phase was confirmed by the absence of impurity peaks in the -ray diffraction pattern. The specimen was further characterized by scanning electron microscopic measurements and energy dispersive -ray analysis [8]. The photoemission measurements were performed using a Gammadata Scienta SES2002 analyzer and monochromatic laboratory photon sources. The energy resolutions were set to 0.4 eV, 5 meV and 5 meV at Al (1486.6 eV), He II (40.8 eV) and He I (21.2 eV) photon energies, respectively. The base pressure in the vacuum chamber was 3 10-11 torr. The temperature variation down to 20 K was achieved by an open cycle He cryostat, LT-3M from Advanced Research Systems, USA. The sample surface was cleaned by in situ scraping using a diamond file and the surface cleanliness was ensured by the absence of O 1 and C 1 features in the -ray photoelectron (XP) spectra and the absence of impurity features in the binding energy range of 5-6 eV in the ultraviolet photoelectron (UP) spectra. The reproducibility of the spectra was confirmed after each trial of cleaning process.
3 Calculational details
The electronic band structure of Ce2CoSi3 was calculated using state-of-the-art full potential linearized augmented plane wave (FLAPW) method using WIEN2k software[10] within the local density approximations, LDA. The convergence for different calculations were achieved considering 512 points within the first Brillouin zone. The error bar for the energy convergence was set to 0.2 meV per formula unit (fu). In every case, the charge convergence was achieved to be less than 10-3 electronic charge. The lattice constants used in these calculations are determined from the -ray diffraction patterns considering AlB2 derived hexagonal structure and are found to be = 8.104 Å and = 4.197 Å[6]. The muffin-tin radii () for Ce, Co and Si were set to 2.5 a.u., 2.28 a.u. and 2.02 a.u., respectively.
4 Results and discussions
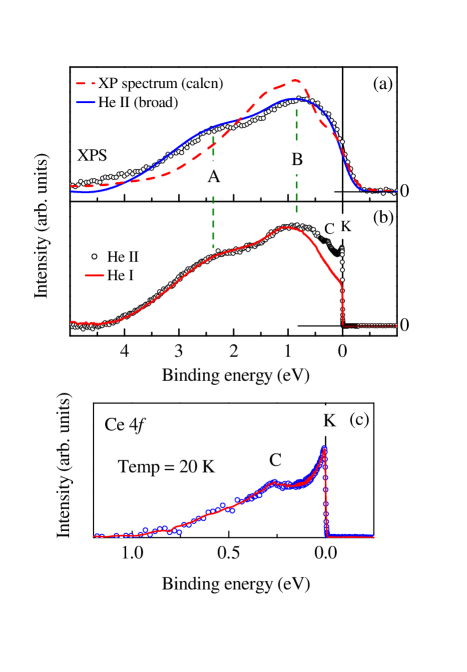
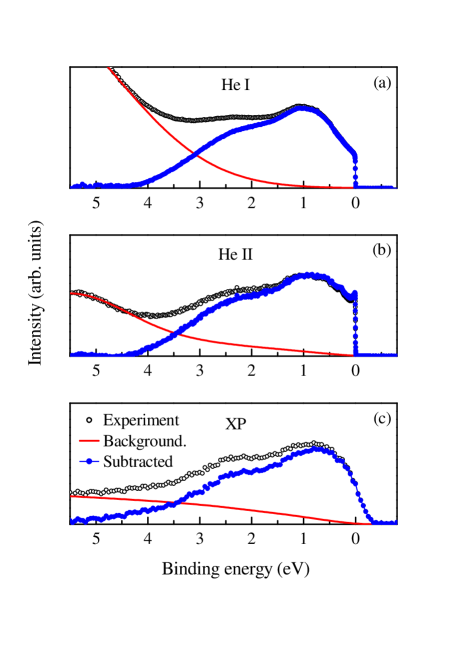
The valence band in Ce2CoSi3 consists of Ce 5, Ce 4, Co 3 and Si 3 electronic states. Since the transition probability of the photoelectrons in the photo-excitation process strongly depends on the excitation energies, a comparison of the photoemission spectra collected at different excitation energies would help to identify experimentally the character of various features constituting the valence band. In Fig. 1(a), we show the valence band spectra collected at 20 K using Al K photon energy. The He II and He I spectra are shown in Fig. 1(b). In order to compare the spectral functions, it is important to subtract suitable background from the raw data as shown in Fig. 2. We have subtracted integral background from Al K and He II spectra. Since the thermalized electrons lead to a large increase in background at low kinetic energies, the background function in the He I spectrum are often found to be better defined by a polynomial (quadratic like) as shown in Fig. 2(a). Evidently, the background contributions in the energy range 0 - 3 eV binding energies is quite small in every case. Moreover, different functional dependence of the background in the He I spectrum does not have significant influence on the conclusions as the calculated spectra are compared with the XP spectrum.
In Fig. 1(b), the intensity close to the Fermi level, , exhibit significantly different behavior as a function of excitation energy. He II spectrum exhibits large intensity and two distinct features C and K near , which are not visible in the other spectra. The high energy resolution employed in the He I and He II measurements helped to resolve distinct signature of the features in the vicinity of . The photoemission cross section for Ce 4 states at He II excitation energy is about 3 times larger than that at He I photon energy while it is almost the same for Si 3 states and double for Co 3 states [11]. Thus, the features C and K can be attributed to the photoemission signal primarily from the Ce 4 states. We have subtracted the He I spectrum from the He II spectrum to delineate the Ce 4 contributions. The subtracted spectrum representing Ce 4 band is shown in Fig. 1(c). The distinct features, C and K corresponding to the spin orbit satellite of the Abrikosov-Suhl resonance (ASR) and the main peak of ASR, respectively, could clearly be identified [17].
In addition to the resonance feature at , each spectrum exhibits two distinct features, A and B at about 2.3 eV and 1 eV binding energies, respectively. Interestingly, the relative intensity of these features does not change with such a large change in photon energies. This is an important observation as the photoemission cross sections corresponding to Ce 5, Ce 4, Co 3 and Si 3 electronic states have significantly different excitation energy dependence [11]. To verify the change in lineshape with better clarity, we have broadened the He II spectrum by convoluting a Gaussian of full width at half maximum (FWHM) = 0.4 eV to make the resolution broadening comparable to that of the XP spectrum. The broadened spectrum is shown by solid line superimposed over the XP spectrum in Fig. 1(a). The lineshapes of both the spectra are almost identical. In Fig. 1(b), the He I and He II spectra are superimposed over each other to investigate the change in lineshape when the energy resolution broadening is the same ( 5 meV). The spectra in the binding energy range beyond 1 eV are found to be almost identical. All these observations are unusual.
These observations can not be associated to the surface preparation via scraping for the following reasons. Scraping helps to break the sample grains in an non-selective manner that helps to expose a clean surface for the measurements. In addition, scraping usually enhances the surface roughness. Such a process will enhance the surface contribution in the spectra. In addition, the linewidth of the features may also get enhanced due to scraping. This later possibility can be ruled out as it is shown experimentally [12, 16] that cleaving and scraping have insignificant influence on the spectral lineshape at higher binding energies as the intrinsic linewidth of these features are already large due to various lifetime effects. As for the enhancement of surface contributions, it is already known that photoemission with He I and He II photons have significant surface sensitivity (probing depth is 8 - 10 Å). Thus, these spectra may contain large surface contributions due to scraping. However, the Al K valence band spectra possess dominant bulk contributions (probing depth 25Å). It is experimentally found that these spectra can often be considered as representative of the bulk electronic structure [12, 13, 14, 15] suggesting that the influence of scraping will have less influence in the Al spectrum. Thus, the observations of similar lineshape in the energy range of 1 to 3 eV binding energies in Figs. 1(a) and 1(b) suggest that either (i) the surface sensitivity in the He I and He II spectra are compensated by scraping or (ii) the surface and bulk electronic structures are quite similar and scraping has insignificant influence in the spectral lineshape. The former is unlikely as scraping enhances the surface contribution that will make the differences more prominent. Thus, the reasonable conclusion will the later case.
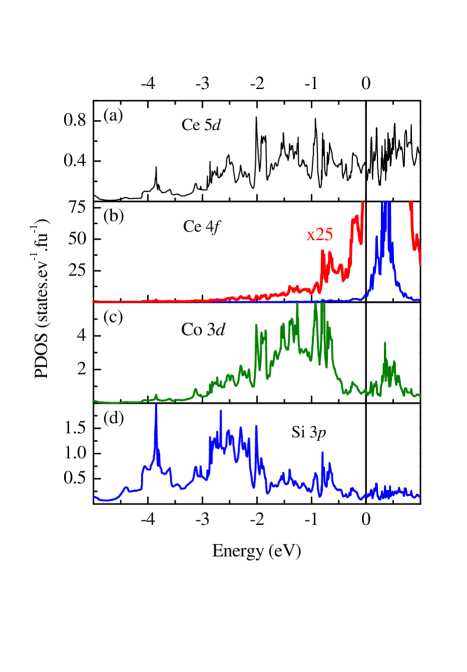
In order to verify the character of the features theoretically, we have calculated the electronic band structure using FPLAPW method. The calculated partial density of states (PDOS) are shown in Fig. 3. The dominant contribution in this energy range arises from the Ce 5, Ce 4, Co 3 and Si 3 PDOS as shown in Fig. 3(a), 3(b), 3(c) and 3(d) respectively. All the other contributions are negligible in this energy range. Evidently, Ce 5 contributions are small and almost equally distributed over the whole energy range shown. Ce 4 band is intense and narrow as expected. In order to provide clarity, we have rescaled the Ce 4 partial density of states (PDOS) by 25 times and shown by thick solid line in Fig. 3(b). The 4 PDOS contribute essentially in the vicinity of the Fermi level ( 1 eV binding energy). The intensity of Ce 4 band is significantly weak at higher binding energies. This is consistent with the observation in Fig. 1(b). Co 3 states also have finite contributions in this energy range due to the hybridization between Co 3 and Ce 4 states.
Co 3 and Si 3 electronic states are strongly hybridized and appear dominantly in the binding energy range larger than 0.5 eV. The bonding states contribute in the energy range higher than 2 eV binding energy, where the Si 3 PDOS has large contributions. The antibonding features appear in the energy range 0.5 to 2 eV, where Co 3 contributions are dominant. This suggests that the feature B in Fig. 1 has dominant Co 3 character and the intensities corresponding to Si 3 photoemission contribute to feature A. The dominance of Co 3 contributions in this whole energy range shown presumably leads to unchanged spectral lineshape with the change in photon energy as observed in Fig 1(a) and 1(b).
In order to compare the experimental spectrum with the calculated results, we have calculated the XP spectrum in the following way: the Ce 5, Ce 4, Co 3 and Si 3 PDOS per formula unit were multiplied by the corresponding photoemission cross sections at Al energy. The sum of all these contributions was convoluted by the Fermi distribution function at 20 K and broadened by the Lorentzian function to account for the photo-hole lifetime broadening. The resolution broadening is introduced via further broadening of the spectrum by a gaussian function of FWHM = 0.4 eV.
The calculated spectrum is shown by dashed line in Fig. 1(a) after normalizing by the total integrated area under the curve. The intensities near in the experimental spectrum appears to be captured reasonably well in the calculated spectra. In the higher binding energy region, the intensity around 1 eV is overestimated and that around 2.5 eV is underestimated (see Fig. 1). Since this energy range contains dominant contribution from the Co 3 states, it naturally indicates that Co 3 PDOS region is not well described and correlations among Co 3 electrons may be important in determining the electronic structure in this energy range. In order to verify this, we have calculated the electronic density of states considering finite electron correlation, , among Co 3 electrons. The spectral functions corresponding to different values are calculated from the LDA+ results following the procedure described above.
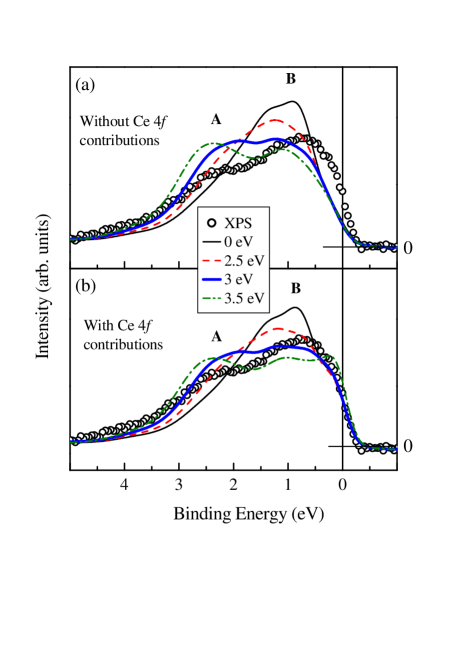
The lines in Fig. 4 represent the spectral functions for different values which are superimposed on the experimental XP spectrum represented by open circles. In Fig. 4(a) we show the calculated spectra without Ce 4 contributions and the ones including Ce 4 contributions are shown in Fig. 4(b). It is evident from the figure that the signature of the feature around 2.3 eV (feature A) becomes more and more prominent with the increase in . Consequently, the intensity of feature B reduces. Thus, the feature A can be attributed to the photoemission signal from electron correlation induced Co 3 bands (lower Hubbard band) in addition to the Si 3 contributions. It is to note here that although the feature A has comparable contributions from Co 3 and Si 3 states from band structure calculations, the photoemission intensity from the Co 3 states would be larger than that of Si 3 states at XPS photon energies due to the matrix element effects.
It is clear that the calculated spectral functions corresponding to 3 eV is close to the experimental spectrum compared to all other cases. For higher values of , the correlation induced feature becomes stronger and appears at higher binding energies. The finding of such correlation among Co 3 electrons is not unrealistic as it is often found in the literature that Co 3 electrons are quite strongly correlated [18, 19, 20, 21, 22]. It is to note here that the estimation of obtained within the LDA+ calculations in this study suggests signature of significant correlation among Co 3 electrons. An accurate estimate of requires further study using other methods e.g. LDA+DMFT.
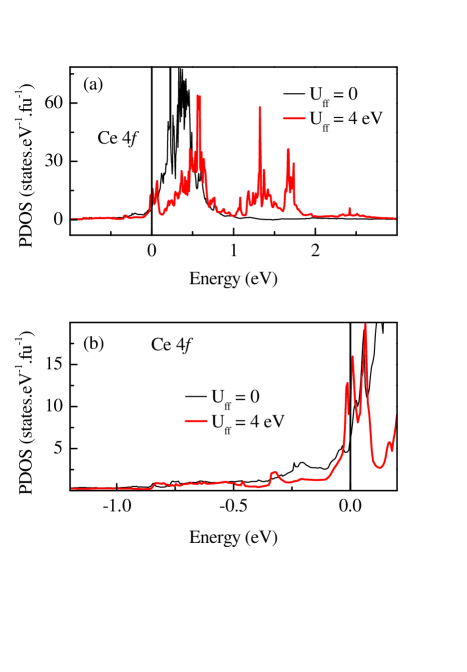
The comparison of Fig. 4(a) and 4(b) establishes that the intensities near essentially arise due to the photoemission from the occupied part of the Ce 4 band. The electron correlation among the Co 3 electrons has negligible influence on the spectral intensity at . Consideration of Ce 4 bands in the spectral function calculation leads to a better description of the spectral intensities at the Fermi level. Electron correlation among Ce 4 electrons is also known to be strong. Thus, we verify if such an effect leads to significant spectral intensity at higher binding energies. We show the Ce 4 PDOS calculated for = 0 and 4 eV in Fig. 5. The unoccupied part of the spectral function exhibits large spectral redistribution. The occupied part exhibits a change in lineshape close to the Fermi level as shown with better clarity in Fig. 5(b). Evidently, the 4 contributions appear essentially in the vicinity of the Fermi level even if the 4 correlations are considered.
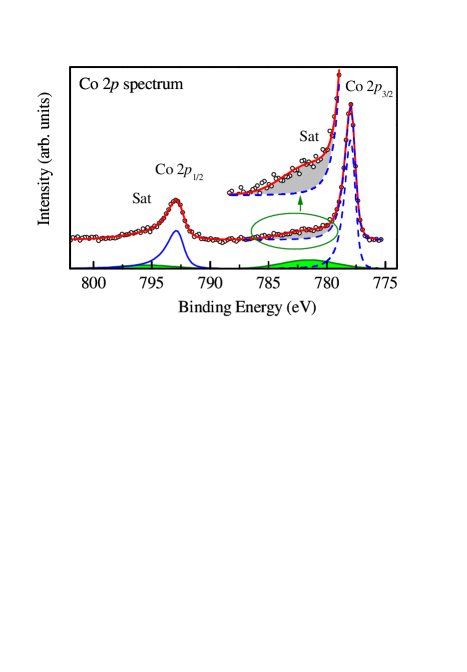
The signature of electron correlations can also be observed in the Co 2 core level spectra [18, 20, 23]. In Fig. 6, we show the Co 2 spectrum collected at 20 K using Al radiation. The spectrum consists of two spin orbit split features Co 2 and Co 2 at 778 eV and 792.9 eV binding energies, respectively (energy separation of about 14.9 eV). These binding energies are identical to those found in elemental Co metals [24, 25]. This indicates that the valence state of Co in this material is very similar to that of the elemental Co metals. In addition, every spin orbit split feature exhibits a weak but distinct shoulder at higher binding energies. This has been shown more clearly by rescaling and shifting this energy region in the same figure. Although the satellite intensity looks small, it appears to be quite intense compared to the ones observed in earlier studies [24, 25]. The energy separation between the main peak and the satellite is about 4 eV.
It is well known that the core level spectra reveal multiple features representing differently screened final states. The intense feature at lower binding energy is usually called the well screened feature and the ones at higher binding energies are called poorly screened features/satellites. Such satellites appear due to the finite electron correlations. The finite intensity of the satellite feature in the present case, independently establishes the presence of electronic correlations among Co 3 electrons as concluded from valence band spectra [23]. Thus, our results establish that the electron correlation strength among Co 3 electrons are significant and needs consideration to derive the electronic structure of these systems.
The mixed valency and/or Kondo effect in this class of compounds depends on the Kondo coupling strength, , where is the hybridization strength between conduction and the 4 electronic states, is the binding energy of the 4 electrons. In the present case, Co 3 electrons contribute significantly in the formation of the conduction band.
Electron correlation introduces local character among 3 electronic states; the band dispersion will be weaker than the case without electron correlation and hence the hybridization strength will be weaker. In addition, the formation of the lower Hubbard band at higher binding energies relative to the uncorrelated band due to the electron correlation will influence the effective energy separation between the Ce 4 band and the conduction electrons. Thus, and various hopping parameters involving Co 3 electronic states are expected to reduce leading to an effective reduction in the degree of mixed valency of Ce. A quantitative estimation of such effects requires detailed modeling of this case presumably within the periodic Anderson model. We believe that these results will help to initiate such research by the theoreticians.
5 Conclusions
In summary, we have studied the electronic structure of Ce2CoSi3 using high resolution photoemission spectroscopy and ab initio band structure calculations. The experimental results indicate the dominance of Co 3 contributions in the valence band. Si 3 states appear at higher binding energies (2 - 3 eV). The Ce 4 contributions appear essentially in the vicinity of the Fermi level. High resolution employed in this study helped to probe the Kondo resonance feature appearing at the Fermi level.
Although the contribution of the Co 3 states at the Fermi level is weak, Co 3 states are found to be hybridized with the Ce 4 states. The comparison of the experimental results with the calculated ones reveal distinct signature of electron correlation among Co 3 electrons. These results suggests that description of the electronic structure and various interesting electronic properties involving Kondo systems requires consideration of correlation among conduction electrons.
6 Acknowledgements
One of the authors S.P., thanks the Council of Scientific and Industrial Research, Government of India for financial support.
References
References
- [1] Brandt N B and Moshchalkov V V 1984 Advances in Physics 33 373
- [2] Wills John M and Cooper Bernard R 1987 Phys. Rev. B 36 3809
- [3] Gunnarsson O and Jepsen O 1988 Phys. Rev. B 38 3568
- [4] Gunnarsson O, Andersen O K, Jepsen O and Zaanen J 1989 Phys. Rev. B 39 1708
- [5] Gunnarsson O and Schönhammer K 1989 Phys. Rev. B 40 4160
- [6] Gordon R A, Alexander M G, Warren C J, DiSalvo F J and Pöttgen R 1997 J. Alloys Compounds 248 24
- [7] Majumdar Subham, Mahesh Kumar M, Mallik R and Sampathkumaran E V 1999 Solid State Comm. 110 509
- [8] Patil Swapnil, Iyer Kartik K, Maiti K and Sampathkumaran E V 2008 Phys. Rev. B 77 094443; Patil Swapnil, Iyer Kartik K, Maiti K and Sampathkumaran E V condmat-0803.0652
- [9] Lawrence J M, Riseborough P S and Parks R D 1981 Rep. Prog. Phys. 44 1
- [10] Blaha P, Schwarz K, Madsen G K H, Kvasnicka D and Luitz J 2001 WIEN2k, An Augmented Plane Wave + Local Orbitals Program for Calculating Crystal Properties (Karlheinz Schwarz, Techn. Universität Wien, Austria), ISBN 3-9501031-1-2
- [11] Yeh J J and Lindau I 1985 At. Data Nucl. Data Tables 32, 1
- [12] Maiti K, Manju U, Ray S, Mahadevan P, Inoue I H, Carbone C and Sarma D D 2006 Phys. Rev. B 73 052508
- [13] Maiti K, Kumar A, Sarma D D, Weschke E and Kaindl G 2004 Phys. Rev. B 70 195112
- [14] Maiti K and Sarma D D, 2000 Phys. Rev. B 61 2525
- [15] Maiti K and Singh R S 2005 Phys. Rev. B 71 161102(R)
- [16] Sekiyama A and Suga S 2002 Physica B 312-313 634
- [17] Ehm D, Hüfner S, Reinert F, Kroha J, Wölfle P, Stockert O, Geibel C and Löhneysen H v 2007 Phys. Rev. B 76 045117
- [18] Chainani A, Mathew M and Sarma D D 1992 Phys. Rev. B 46, 9976
- [19] Wu Z Y, Benfatto M, Pedio M, Cimino R, Mobilio S, Barman S R, Maiti K and Sarma D D 1997 Phys. Rev. B 56 2228
- [20] Saitoh T, Mizokawa T, Fujimori A, Abbate M, Takeda Y and Takano M 1997 Phys. Rev. B 55 4257
- [21] Pandey S K, Kumar A, Patil S, Medicherla V R R, Singh R S, Maiti K, Prabhakaran D, Boothroyd A T and Pimpale A V 2008 Phys. Rev. B 77 045123
- [22] Pandey S K, Patil S, Medicherla V R R, Singh R S and Maiti K 2008 Phys. Rev. B 77 115137
- [23] Imada Masatoshi, Fujimori Atsushi and Tokura Yoshinori 1998 Rev. Mod. Phys. 70 1039
- [24] Nath Krishna G, Haruyama Y and Kinoshita T 2001 Phys. Rev. B 64 245417
- [25] Schneider C M, Pracht U, Kuch W, Chassé A and Kirschner J 1996 Phys. Rev. B 54 R15618