Gamma-ray burst afterglows from trans-relativistic blast wave simulations
Gamma-ray burst afterglows from
trans-relativistic blast wave simulations
H.J. van Eerten1, K. Leventis1, Z. Meliani2 and R.A.M.J. Wijers
1API, University of Amsterdam, 2CfPA, K.U. Leuven
1 Introduction
We present a study of the intermediate regime between ultra-relativistic and nonrelativistic flow for gamma-ray burst afterglows. The hydrodynamics of spherically symmetric blast waves is numerically calculated using the amrvac adaptive mesh refinement code. Spectra and light curves are calculated using a separate radiation code that, for the first time, links a parametrisation of the microphysics of shock acceleration, synchrotron self-absorption and electron cooling to a high-performance hydrodynamics simulation.
All results are presented in more detail in Van Eerten et al. (2009).
2 Dynamics
We used typical physical parameters: explosion energy erg, circumburst number density 1 cm-3, assuming a homogeneous environment, shocked magnetic field energy density a fraction 0.01 of thermal energy density, shocked electron energy density a faction 0.1 of thermal energy density. We trace the evolution of the magnetic field and gradually decrease the fraction of the number density for accelerated particles at the shock from 1 downto 0.1.
The blast wave slows down slower than anticipated from equating the explosion energy to the total swept-up rest mass energy, which in this case would lead to a transition time days. We find days in the emission time frame. The analytical estimate for blast wave velocity Lorentz factor () from Huang et al. (1999) overestimates the late time by a factor .
The simulation uses an advanced equation of state that resulting in an effective adiabatic index gradually evolving from 4/3 to 5/3 from relativistic to nonrelativistic. We find that the lab frame density directly behind the shock , divided by (where the circumburst density) remains numerically close to four throughout the entire simulation:
3 Radiation and GRB030329
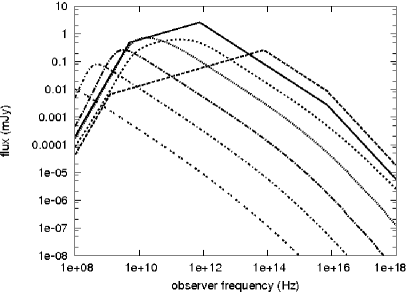
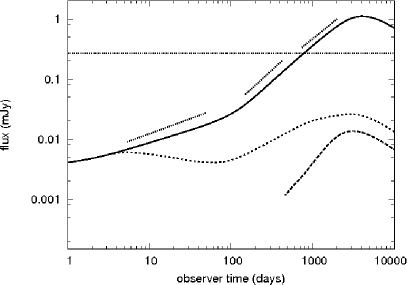
Our code successfully reproduces the synchrotron spectrum, including self-absorption and electron cooling (see fig. 1). The transition to the nonrelativistic regime occurs around days in observer time. Only the relativistic slopes of the light curve match the analytically expected values. The changing leads to a late-time steepening, but the light curve is then more strongly influenced by the change in , leading to a less steep decay.
Simulating GRB030329 using explosion parameters derived from analytical model fits reveals a strong discrepancy between simplified model and more accurate simulation, with flux differences up to an order of magnitude. Simulated late time radio light curves using hard-edged jets indicate that the counterjet should eventually become visible, and show a doubly peaked curve due to the combination of strong self-absorption and the jet break.
References
- Huang et al. (1999) Huang, Y. F., Dai, Z. G., & Lu, T. 1999, MNRAS, 309, 513
- Van Eerten et al. (2009) Van Eerten, H. J., Leventis, K., Meliani, Z., Wijers, R. A. M. J., & Keppens, R. 2009, MNRAS accepted. ArXiv: 0909.2446